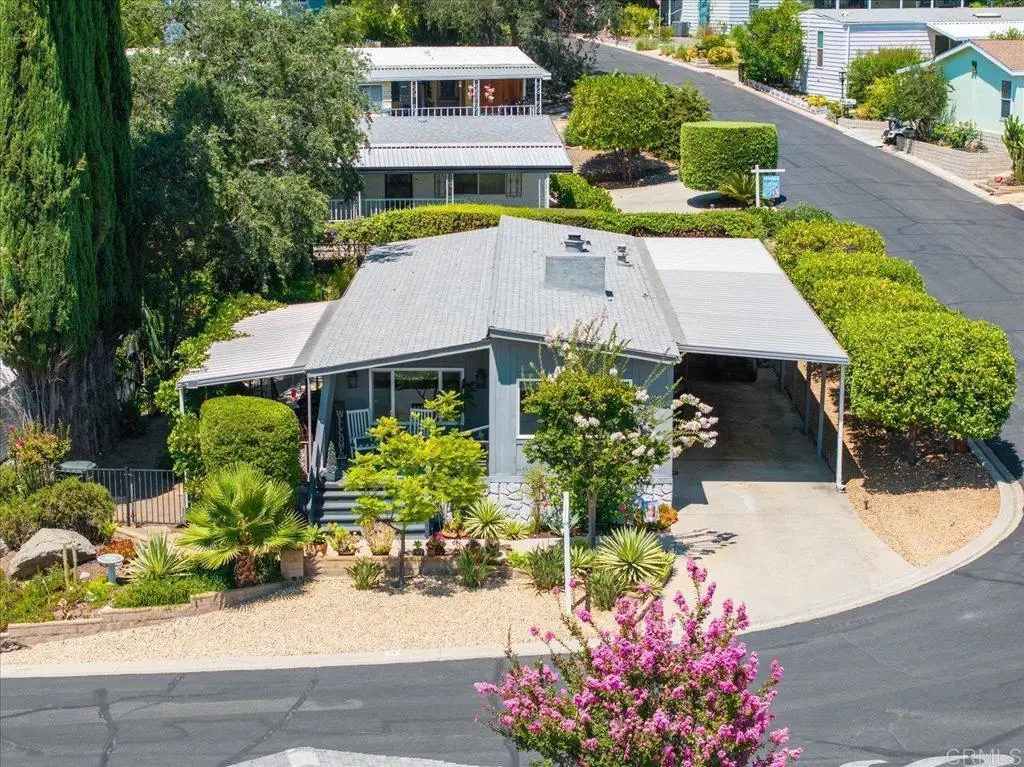
18218 Paradise Mountain Rd #116 · Valley Center, CA
Flood risk 1/10 · Minimal
- FEMA flood zone
- X (unshaded)
- Chance of flooding over 30 yrs
- 0.0%
- Est. flood insurance / yr
- $507 – $1,088
Fire risk 10/10 · Severe
- Est. fire insurance / yr
- $659 – $1,223
Heat risk 4/10 · Minor
- Hot days now (above 97°F)
- 1 days/yr
- Hot days in 30 yrs
- 3 days/yr
Wind risk 1/10 · Minimal
- Chance of severe wind over 30 yrs
- —
Air-quality risk 6/10 · Moderate
- Unhealthy air days now
- 10 days/yr
- Unhealthy air days in 30 yrs
- 12 days/yr
Risk factors via First Street. Map © Google.
Why this score? — see what drove the B+ grade
The composite is a weighted blend of 9 inputs, each scored 0–100. Each bar is that input's sub-score; the figure is the points it added to the 100-point composite (weight × sub-score).
- Cash flow +30.0/30.0
- ARV discount +15.0/15.0
- 1% rule +10.0/10.0
- DSCR +10.0/10.0
- Livability +2.6/5.0
- Rent growth +2.5/5.0
- Condition / age +2.5/5.0
- Schools +2.4/10.0
- Appreciation +0.0/10.0
$147,000
🖨 Deal sheet 📄 Offer letter ✓ Due diligence
Listing remarks
Resort-Style 55+ Living with FREE Golf in Skyline Ranch! Welcome to one of North County’s best-kept secrets - Skyline Ranch Country Club! This spacious and well-maintained 2-bedroom, 2-bath DOUBLEWIDE with numerous updates offers nearly 1,400 sq ft of open-concept living on a desirable corner lot. Enjoy a light-filled layout with wood-burning fireplace, newer roof and dual-pane windows, large living and dining areas, and a kitchen with ample storage, counter space, and breakfast bar. The primary suite features office area plus ensuite bath with soaking tub and separate shower. Relax on two covered porches or enjoy the low-maintenance yard, 2 large storage sheds, and covered carport wi
Key facts
- Newer roof
- Dual-pane windows
- Ensuite bath
Tags
Property features AI
Finance
- Other: Pets allowed: dogs and cats; Park name: Skyline Ranch Country Club
- Financial info: Land lease of $1,750 monthly
- HOA & community: Senior community; Community features include golf course, dog park, and lake
Exterior
- Parking: Two parking spaces; Two carport spaces; Located in Skyline Ranch Country Club park
- Security: Gated community
- Utilities: Public sewer
- Home design: Townhouse model; Single-story; Entry on main level
- Construction: Shingle roof; Mobile home remains (24' x 57')
- Exterior features: Covered patio; Front and rear porches; Community pool; Corner landscaped lot; Level/flat yard with front and back yard; One shed; Has a view
Interior
- Kitchen: Gas cooktop; Garbage disposal; Microwave; Refrigerator; Dishwasher
- Bedrooms: Primary bedroom / primary suite (main level)
- Bathrooms: Two full bathrooms; Double sinks in primary bath
- Heating & cooling: Forced air heating; Central cooling
- Interior features: Open floor plan; Main-level entry; One-story layout; Gated community
- Laundry & utility: Inside laundry room; Washer included; Dryer included; Individual laundry room
Neighborhood map
What this means for you Summary
Snapshot
- This is a 2-bed/2.0-bath manufactured listed at $147k.
Deal economics
- At list price, monthly cash flow is $2k ($19k/yr) — positive.
- The deal already cash-flows at list — no discount required.
- Meets the 1% rule at list price ($3k rent vs $147k).
- Recommended offer: $143k (3.0% below list) — sets the bar for market timing.
- Cap rate 19.1% vs local median 2.5% in Valley Center — top-decile yield for the area; either an underpriced asset or a hidden risk that comps aren't pricing in. Stress-test before assuming the spread holds.
Location & tenants
- Location reads 52/100 on livability (#1,017 in CA) — a working-class tenant base; expect higher turnover. Strengths: employment A+, housing B; Watch: commute C-, schools F, amenities F.
- Valley Center-Pauma Unified (rural): math 16% / reading 34% proficiency, ranked #367 of 517 in CA (top 71%) — low school quality limits family demand, transient renter base, plan for 1-2y turnover.
- Market conditions: 165 active listings in the ZIP; high-income renter base; 11,759 units permitted in San Diego County in 2024 (7,244 in 5+ unit buildings).
- This rent runs 31% of the median local income ($127k/yr) — at the standard rent-burdened threshold; future hikes will face affordability resistance.
Forward outlook
- Local home prices are declining (-3.0%/yr); year-one equity from $1k of loan paydown is wiped out by about $4k of value loss. Plan a longer hold.
- San Diego County population projected at +20% by 2050 — long-run rental-demand tailwind backs the buy-and-hold thesis.
- At projected returns (-3.0% appreciation + 3.0% rent growth), your $41k cash investment doubles in ~3 years — after that, you're playing with house money.
Negotiation context
- It's been on market 48 days — a 3% lower offer ($143k) is reasonable based on typical stale-listing flexibility.
- 6 sale attempts since 12y ago with the ask held roughly flat each time — persistent listings suggest the price (not the market) is what's stuck; bring a comps-based counter.
- Current owner paid $45k; list at $147k implies a 227% gain — meaningful room to come down on a strong offer.
Risks & watch-outs
- Climate carrying-cost: severe wildfire risk — expect insurance premiums to compound above CPI over the hold.
Questions for the listing agent
- It's been on market 48 days. Have you received any prior offers? Is the seller open to a 3% concession, seller financing, or rate buy-down credit?
- Built in 1977 — when were the roof, HVAC, electrical panel, plumbing, and water heater last replaced?
- Is there a deadline driving the sale (1031 exchange, divorce, estate, relocation)? That informs how much negotiation room exists.
- Schools are F-rated, which usually means shorter tenancies and higher turnover. Who's the typical renter profile here, and what's been the actual vacancy rate?
- What's the average days-on-market for RENTAL listings here right now (not sales)? A rising rental-DOM trend means longer vacancies and softer asking-rent achievability than the comps imply.
- What's the recent tenant-quality profile in this submarket — average credit score on applications, eviction rate, late-payment / NSF rate, and stable-employment percentage? A property-management company in the area should have these aggregated.
- How much new for-sale + rental construction is in the pipeline within 1–3 miles? Heavy new supply typically softens prices + rents 12–24 months out; constrained supply supports both.
Investment metrics
- 1% rule
- 2.23% ✓
- Cap rate
- 19.15%
- Cash-on-cash
- 45.91%
- DSCR
- 3.04
- GRM
- 3.7
CMA / ARV
- ARV (median comp)
- $210,000
- List price
- $147,000
- Delta
- -30.00%
- Verdict
- UNDERPRICED
- Comps
- 8 within 1.0 mi
Show comp detail 12 sales within ~0.75 mi
| Address | Dist | Beds/Ba | Sqft | Sold | Price | $/sf | Match |
|---|---|---|---|---|---|---|---|
| 18218 S PARADISE MOUNTAIN RD SPC 109 | 0.00mi | 2/2.0 | 1,440 (+5%) | 12mo | $140,000 | $97 | 81 |
| 18218 Paradise Mountain Rd #7 | 0.00mi | 2/2.0 | 1,355 (-1%) | 21mo | $92,000 | $68 | 81 |
| 18218 Paradise Mountain Rd Spc 10 | 0.13mi | 2/2.0 | 1,306 (-4%) | 9mo | $255,000 | $195 | 79 |
| 18218 Paradise Mountain Rd Spc 211 Lot 211 | 0.13mi | 2/2.0 | 1,248 (-9%) | 2mo | $205,000 | $164 | 78 |
| 18218 Paradise Mountain Rd Spc 145 | 0.09mi | 2/2.0 | 1,440 (+5%) | 14mo | $165,000 | $115 | 75 |
| 18218 Paradise Mountain Rd Spc 105 | 0.13mi | 2/2.0 | 1,440 (+5%) | 12mo | $89,500 | $62 | 75 |
| 18218 Paradise Mountain Rd Spc 150 | 0.00mi | 2/2.0 | 1,536 (+12%) | 8mo | $267,500 | $174 | 73 |
| 18218 Paradise Mountain Rd Spc 79 | 0.00mi | 2/2.0 | 1,530 (+12%) | 10mo | $115,000 | $75 | 72 |
| 18218 Paradise Mountaind Rd #174 | 0.13mi | 3/2.0 (+1) | 1,532 (+12%) | 10mo | $149,000 | $97 | 61 |
| 18218 Paradise Mtn Spc 47 | 0.13mi | 3/2.0 (+1) | 1,560 (+14%) | 12mo | $100,000 | $64 | 56 |
| 18218 Paradise Mountain Rd #12 | 0.26mi | 2/2.0 | 1,536 (+12%) | 22mo | $129,000 | $84 | 49 |
| 18218 Paradise Mountain Rd Spc 11 | 0.13mi | 3/2.0 (+1) | 1,560 (+14%) | 21mo | $180,000 | $115 | 48 |
Match score weights: distance 35% · size 25% · config 20% · recency 20%. Top-matched comps best support the ARV.
Projected returns pro-forma
-3.0% appreciation · 3.0% rent growth · sell at horizon
- IRR
- 43.1%
- Equity multiple
- 2.86×
- Total profit
- $76,522
- Equity at exit
- $21,918
- IRR
- 49.2%
- Equity multiple
- 5.76×
- Total profit
- $195,978
- Equity at exit
- $12,710
Cash invested: $41,160 (down + closing). Projections, not guarantees.
Landlord ↔ Tenant lean methodology
- Overall (STATE)
- 18 Strongly Tenant-Friendly
- State California
- 18 Strongly Tenant-Friendly · D+13
- County
- — inherits STATE
- City
- — inherits STATE
ZIP-level market 92082
- Active inventory
- 165
- Price-to-rent
- 3.7×
Monthly cashflow live
- Estimated rent
- $3,279 medium interval (Pro) →
- Mortgage (P&I)
- −$771
- Tax est. 1.5%
- −$184 /mo · $2,205/yr
- Insurance
- −$61
- HOA
- −$0
- Vacancy / Maint / Mgmt
- −$689
- Net cashflow
- $1,575
Break-even live
UW: 25.0% down · 7.5% · 30yr · 1.5% tax · 5.0% vac · 8.0% maint · 8.0% mgmt
Financing live
Cash to close
- Down payment
- $36,750
- Closing costs
- $4,410
- Reserves months
- —
- Total cash needed
- —
Loan-product check · same deal, 3 products live
Conventional
25% down · 7.5% · 30yr
- Down + closing
- —
- Monthly P&I
- —
- Monthly cashflow
- —
- DSCR
- —
- Eligible?
- —
Personal DTI + credit; lowest rate.
DSCR
20% down · 8.5% · 30yr
- Down + closing
- —
- Monthly P&I
- —
- Monthly cashflow
- —
- DSCR
- —
- Eligible?
- —
No personal income docs; deal must DSCR.
Hard money
10% down · 12.0% · 12mo
- Down + closing
- —
- Monthly P&I
- —
- Monthly cashflow
- —
- DSCR
- —
- Eligible?
- —
Short-term bridge; refi at stabilization.
Listing history 33 events
-
2026-06-18days on market $147,000 Active 48 DOM
-
2026-06-17days on market $147,000 Active 47 DOM
-
2026-06-16days on market $147,000 Active 46 DOM
-
2026-06-15days on market $147,000 Active 45 DOM
-
2026-06-13days on market $147,000 Active 43 DOM
-
2026-06-13days on market $147,000 Active 42 DOM
-
2026-06-09days on market $147,000 Active 39 DOM
-
2026-06-08days on market $147,000 Active 38 DOM
-
2026-06-07days on market $147,000 Active 37 DOM
-
2026-06-04days on market $147,000 Active 34 DOM
-
2026-06-03days on market $147,000 Active 33 DOM
-
2026-06-02days on market $147,000 Active 32 DOM
-
2026-06-01days on market $147,000 Active 31 DOM
-
2026-05-31days on market $147,000 Active 30 DOM
-
2026-05-01$147,000 Active 821-char remark
-
2025-11-05historical
-
2025-10-04price $142,000
-
2025-08-14price $149,000
-
2025-07-14price $149,500
-
2025-06-02price $164,000
-
2025-05-01$179,000 Active
-
2024-11-25historical
-
2024-09-01$237,500 Active
-
2024-09-01historical
-
2024-01-15$259,000 Active
-
2024-01-12historical
-
2023-07-17historical
-
2023-05-12$248,900 Active
-
2023-05-11historical
-
2015-01-12soldstatus $45,000 Sold
-
2014-12-11status Pending
-
2014-11-25price $49,000
-
2014-10-06$54,900 Active
ⓘ Source: listings_history table (triggers on properties + properties_extension) + one-shot
backfill from property_details.listing_events for pre-trigger history.
Climate risk First Street
- Flood 1/10 Low FEMA zone X (unshaded) · 0% chance over 30 yrs
- Wildfire 10/10 Extreme
- Heat 4/10 Moderate 1 d/yr ≥97°F today · 3 d/yr by 30 yrs out
- Wind 1/10 Low
- Air quality 6/10 Major 10 unhealthy d/yr today · 12 by 30 yrs out
Nearby sold comps map
Loading sold comps map…
Walkable amenities ~0.75 mi
Loading nearby amenities…
Taxation est. · year 1
- Rental income
- $39,351
- − Mortgage interest
- −$8,234
- − Property taxes
- −$2,205
- − Insurance
- −$735
- − Repairs & maintenance
- −$3,148
- − Management
- −$3,148
- − Depreciation
- −$4,276
- Taxable income
- $17,604
- Est. tax owed @ 24.0%
- −$4,225
- After-tax cash flow
- $14,671/yr
For passive investors: Depreciation is non-cash, so a rental often shows a tax loss while cash-flowing — sheltering income. Rental losses are passive: they offset passive income freely, and up to $25,000/yr can offset ordinary (W-2) income if you actively participate and your MAGI is under $100k (phasing out to $0 by $150k); unused losses carry forward. On sale, claimed depreciation is recaptured at up to 25%, and gains may owe capital-gains tax (a 1031 exchange can defer both). Figures are a year-1 estimate at your 24.0% rate — not tax advice; consult a CPA.
Schools (NCES district)
- District
- Valley Center-Pauma Unified
- NCES district ID
- 0600069
- Math proficiency
- 16% ▼ -8.00%
- Reading proficiency
- 34% ▼ -5.00%
- Median HH income
- $74,438
- Composite
- 24.32/100
- National rank
- #7705
- State rank
- #367 of 517 in CA
Livability — Valley Center
- Score
- 52/100
- State rank
- #1017
- US rank
- #24938
Category grades
Schools grade is shown separately in the Schools card above.
Census & demographics
- County
- San Diego County · 3,178,799 people
- City population
- 21,727
- Metro
- San Diego-Chula Vista-Carlsbad, CA
- Population (ZIP)
- 21,727
- Household income
- $126,544
- Rent vs Own
- Severe rent burden
- 241.0
Population outlook (San Diego County) Hauer SSP2
- Today (2025)
- 3,678,185 people
- By 2030
- 3,856,546 · +4.8%
- By 2040
- 4,171,407 · +13.4%
- By 2050
- 4,421,607 · +20.2%
- By 2075
- 4,831,599 · +31.4%
- By 2100
- 4,832,502 · +31.4%
Race, ethnicity, and origin ACS 2023
- Neighborhood character
- Diverse neighborhood (Simpson 0.61)
- Race & ethnicity
- White 49% Hispanic / Latino 38% Two or more races 23% Native American 4% Asian 3% Black 2%
- Hispanic origin (detail)
- Mexican 33%
- Common ancestry
- Italian 2% Slovak 2% Iranian 1%
- Foreign-born
- 17% · Canada, South Korea
- Languages at home
- 74% English-only · Spanish 22% Tagalog/Filipino 1% Other Indo-European 1%
Political lean MEDSL · San Diego
- 2024 margin
- D (+16.8) · D 56.9% · R 40.1% · Other 2.9%
- 2008→2024 swing
- +6.6pp toward D · 2008: 10.2pp · 2024: 16.8pp
- All cycles
- 2024: D+16.8 2020: D+22.8 2016: D+17.8 2012: D+5.1 2008: D+10.2
Not yet ingested
- Civics
- —
Market trends
- HPI YoY
- ▼ -293.00%
- Current HPI
- 294.6017
- Rent YoY
- —
- Metro
- San Diego-Chula Vista-Carlsbad, CA
- State GDP YoY
- ▲ 3.21%
- F500 in state
- 116
Industry mix (Fortune 500 HQ in CA)
| Industry | F500 HQs | Revenue |
|---|---|---|
| Technology | 27 | $1,492B |
|
||
| Financial Services | 3 | $174B |
|
||
| Retail | 3 | $44B |
|
||
| Insurance | 3 | $26B |
|
||
| Media / Entertainment | 2 | $115B |
|
||
| Pharmaceuticals / Biotech | 2 | $62B |
|
||
Price history
+167.8% since first listed19 events — show timeline
- 2026-05-01 Listed $147,000 CRMLS
- 2025-11-05 Listing Removed — CRMLS
- 2025-10-04 Price Changed $142,000 CRMLS
- 2025-08-14 Price Changed $149,000 CRMLS
- 2025-07-14 Price Changed $149,500 CRMLS
- 2025-06-02 Price Changed $164,000 CRMLS
- 2025-05-01 Listed $179,000 CRMLS
- 2024-11-25 Listing Removed — CRMLS
- 2024-09-01 Listing Removed — CRMLS
- 2024-09-01 Listed $237,500 CRMLS
- 2024-01-15 Listed $259,000 CRMLS
- 2024-01-12 Coming Soon — CRMLS
- 2023-07-17 Listing Removed — CRMLS
- 2023-05-12 Listed $248,900 CRMLS
- 2023-05-11 Coming Soon — CRMLS
- 2015-01-12 Sold (MLS) $45,000 SDMLS
- 2014-12-11 Pending — SDMLS
- 2014-11-25 Price Changed $49,000 SDMLS
- 2014-10-06 Listed $54,900 SDMLS
Cash-flow waterfall
monthlySold comps — $/sqft
last 12 mo · ≤1 miLoading sold comps…