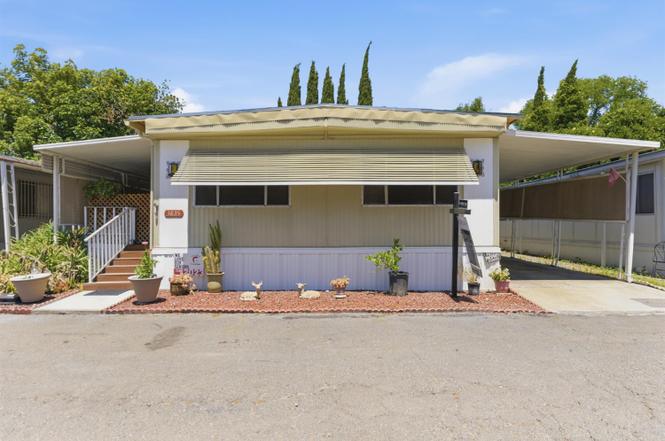
3835 Stillman Park Cir · Lemon Hill, CA
Flood risk No data
- FEMA flood zone
- —
- Chance of flooding over 30 yrs
- —
- Est. flood insurance / yr
- —
Fire risk No data
- Est. fire insurance / yr
- —
Heat risk No data
- Hot days now (above threshold)
- —
- Hot days in 30 yrs
- —
Wind risk No data
- Chance of severe wind over 30 yrs
- —
Air-quality risk No data
- Unhealthy air days now
- —
- Unhealthy air days in 30 yrs
- —
Risk factors via First Street. Map © Google.
Why this score? — see what drove the B- grade
The composite is a weighted blend of 9 inputs, each scored 0–100. Each bar is that input's sub-score; the figure is the points it added to the 100-point composite (weight × sub-score).
- Cash flow +30.0/30.0
- 1% rule +10.0/10.0
- DSCR +10.0/10.0
- Rent growth +4.1/5.0
- Schools +3.5/10.0
- ARV discount +3.0/15.0
- Condition / age +2.5/5.0
- Livability +2.2/5.0
- Appreciation +0.0/10.0
$110,900
🖨 Deal sheet 📄 Offer letter ✓ Due diligence
Listing remarks
Welcome home to this spacious 2-bedroom, 2-bath double-wide offering 1,344 sq. ft. of comfortable living space in a family friendly community. Filled with natural light, the open floor plan provides plenty of room to relax and entertain. Recent improvements include a new roof, new interior paint throughout, a new HVAC system, and a new gas/electric furnace, providing comfort and peace of mind for years to come. One bathroom has been completely renovated, adding a fresh, modern touch. Lovingly maintained and owned by the same family for over 40 years, this home reflects true pride of ownership. Conveniently located near shopping, dining, schools, and everyday amenities, residents can also en
Key facts
- Community pool
- New interior paint
- New roof
Tags
Property features AI
Finance
- Financial info: Land lease: No (listed land lease amount present for reference)
- HOA & community: No association
Exterior
- Parking: Covered parking; Guest parking available
- Utilities: Individual gas meter; Electric service (other); Public sewer; Public water
- Home design: Manufactured home (double wide) located in a park; Built in 1970; Villa West make; Aluminum skirting
- Construction: Metal roof; Aluminum skirting
- Exterior features: Metal roof; Storage shed(s); Additional storage area
Interior
- Kitchen: Free standing refrigerator; Hood over range; Dishwasher; Disposal; Microwave; Free standing electric oven; Free standing electric range
- Bedrooms: 2 bedrooms
- Flooring: Carpet; Laminate; Vinyl
- Bathrooms: 2 full bathrooms; Low-flow showers and toilets; Tub with shower over
- Heating & cooling: Central heating; Central air conditioning; Ceiling fans
- Interior features: Great room living area; Wood counters in the kitchen; Dining and living room combo; Covered deck (carpeted); Storage area
- Laundry & utility: Indoor laundry hookups; Laundry located in an inside room/area
Neighborhood map
What this means for you Summary
Snapshot
- This is a 2-bed/2.0-bath manufactured listed at $111k.
Deal economics
- At list price, monthly cash flow is $789 ($9k/yr) — positive.
- The deal already cash-flows at list — no discount required.
- Meets the 1% rule at list price ($2k rent vs $111k).
- Cap rate 14.8% vs local median 3.8% in Lemon Hill — top-decile yield for the area; either an underpriced asset or a hidden risk that comps aren't pricing in. Stress-test before assuming the spread holds.
Location & tenants
- Location reads 45/100 on livability (#1,302 in CA) — a working-class tenant base; expect higher turnover. Strengths: housing A; Watch: health & safety D, schools F, crime F.
- Sacramento City Unified (urban): math 32% / reading 43% proficiency, ranked #804 of 1,400 in CA (top 57%) — families likely to look elsewhere, expect single-tenant / working-renter base with shorter leases; 63% free/reduced lunch — lower-income household profile, screen leases tightly.
- Market conditions: Rents rising fast (+6.4%/yr); 67 active listings in the ZIP; 19 comparable units currently listed for rent nearby; rentals at typical pace (median 24d on market — plan ~3-4 weeks tenant-placement turnaround); 6,825 units permitted in Sacramento County in 2024 (1,752 in 5+ unit buildings).
- This rent runs 42% of the median local income ($56k/yr) — at the standard rent-burdened threshold; future hikes will face affordability resistance.
Forward outlook
- Local home prices are declining (-3.0%/yr); year-one equity from $767 of loan paydown is wiped out by about $3k of value loss. Plan a longer hold.
- Sacramento County population projected at +17% by 2050 — long-run rental-demand tailwind backs the buy-and-hold thesis.
- At projected returns (-3.0% appreciation + 6.4% rent growth), your $31k cash investment doubles in ~4 years — after that, you're playing with house money.
Negotiation context
- Only 7 days on market — expect competitive offers; lowballing is unlikely to land.
Questions for the listing agent
- Built in 1970 — when were the roof, HVAC, electrical panel, plumbing, and water heater last replaced?
- Is there a deadline driving the sale (1031 exchange, divorce, estate, relocation)? That informs how much negotiation room exists.
- Schools are F-rated, which usually means shorter tenancies and higher turnover. Who's the typical renter profile here, and what's been the actual vacancy rate?
- Crime grade is F in this area — have there been break-ins, vandalism, or insurance claims at this property in the last 3 years? What carrier currently insures it and at what premium?
- What's the average days-on-market for RENTAL listings here right now (not sales)? A rising rental-DOM trend means longer vacancies and softer asking-rent achievability than the comps imply.
- What's the recent tenant-quality profile in this submarket — average credit score on applications, eviction rate, late-payment / NSF rate, and stable-employment percentage? A property-management company in the area should have these aggregated.
- How much new for-sale + rental construction is in the pipeline within 1–3 miles? Heavy new supply typically softens prices + rents 12–24 months out; constrained supply supports both.
Investment metrics
- 1% rule
- 1.78% ✓
- Cap rate
- 14.83%
- Cash-on-cash
- 30.49%
- DSCR
- 2.36
- GRM
- 4.7
CMA / ARV
- ARV (on-the-fly)
- $100,800
- Comps found
- 1
Show comp detail 1 sale within ~0.75 mi
| Address | Dist | Beds/Ba | Sqft | Sold | Price | $/sf | Match |
|---|---|---|---|---|---|---|---|
| 3501 Elite Dr | 0.75mi | 2/2.0 | 1,400 (+4%) | 20mo | $105,000 | $75 | 41 |
Match score weights: distance 35% · size 25% · config 20% · recency 20%. Top-matched comps best support the ARV.
Projected returns pro-forma
-3.0% appreciation · 6.44% rent growth · sell at horizon
- IRR
- 29.0%
- Equity multiple
- 2.27×
- Total profit
- $39,364
- Equity at exit
- $16,536
- IRR
- 38.4%
- Equity multiple
- 5.19×
- Total profit
- $130,162
- Equity at exit
- $9,589
Cash invested: $31,052 (down + closing). Projections, not guarantees.
Landlord ↔ Tenant lean methodology
- Overall (STATE)
- 18 Strongly Tenant-Friendly
- State California
- 18 Strongly Tenant-Friendly · D+13
- County
- — inherits STATE
- City
- — inherits STATE
ZIP-level market 95824
- Rents YoY
- 6.4%
- Active inventory
- 67
- Price-to-rent
- 4.7×
Monthly cashflow live
- Estimated rent
- $1,969 high interval (Pro) →
- Mortgage (P&I)
- −$582
- Tax est. 1.5%
- −$139 /mo · $1,664/yr
- Insurance
- −$46
- HOA
- −$0
- Vacancy / Maint / Mgmt
- −$413
- Net cashflow
- $789
Break-even live
UW: 25.0% down · 7.5% · 30yr · 1.5% tax · 5.0% vac · 8.0% maint · 8.0% mgmt
Financing live
Cash to close
- Down payment
- $27,725
- Closing costs
- $3,327
- Reserves months
- —
- Total cash needed
- —
Loan-product check · same deal, 3 products live
Conventional
25% down · 7.5% · 30yr
- Down + closing
- —
- Monthly P&I
- —
- Monthly cashflow
- —
- DSCR
- —
- Eligible?
- —
Personal DTI + credit; lowest rate.
DSCR
20% down · 8.5% · 30yr
- Down + closing
- —
- Monthly P&I
- —
- Monthly cashflow
- —
- DSCR
- —
- Eligible?
- —
No personal income docs; deal must DSCR.
Hard money
10% down · 12.0% · 12mo
- Down + closing
- —
- Monthly P&I
- —
- Monthly cashflow
- —
- DSCR
- —
- Eligible?
- —
Short-term bridge; refi at stabilization.
Rent comps 19 comps
| Address | Beds | Baths | Sqft | Rent | $/sqft | DOM | Units | Dist |
|---|---|---|---|---|---|---|---|---|
| 6017 40th St Sacramento, CA | 2.0 | 2.0 | 1487 | $1,700 | $1.14 | 7d | 1 | 0.42mi |
| 4197 Cuny Ave Unit 3 Sacramento, CA | 2.0 | 1.0 | 1051 | $2,000 | $1.90 | 17d | 1 | 0.53mi |
| 6315 Ventura St Sacramento, CA | 2.0 | 1.0 | 1000 | $2,000 | $2.00 | 43d | 1 | 0.80mi |
| 6310 Ventura St Sacramento, CA | 2.0 | 1.0 | 1000 | $2,000 | $2.00 | 43d | 1 | 0.84mi |
| 6855 Carnation Ave Unit 6855 Sacramento, CA | 2.0 | 2.0 | 1100 | $2,025 | $1.84 | 3d | 1 | 0.89mi |
| 5891 28th St Sacramento, CA | 3.0 | 2.0 | 1110 | $2,195 | $1.98 | 20d | 1 | 0.92mi |
| 5988 Sampson Blvd Sacramento, CA | 2.0 | 1.0 | 1025 | $2,125 | $2.07 | 23d | 1 | 0.94mi |
| 4911 50th Ave Unit 11 Sacramento, CA | 2.0 | 2.0 | 875 | $1,660 | $1.90 | 23d | 1 | 0.95mi |
| 5619 42nd St Unit 5619-1 Sacramento, CA | 2.0 | 1.0 | 925 | $1,625 | $1.76 | 12d | 1 | 0.96mi |
| 4913 Sky Pkwy Sacramento, CA | 3.0 | 2.0 | 1456 | $2,200 | $1.51 | 43d | 1 | 0.97mi |
| 2620 Fernandez Dr Sacramento, CA | 3.0 | 2.0 | 1405 | $2,495 | $1.78 | 23d | 1 | 1.05mi |
| 5936 Clover Manor Way Sacramento, CA | 3.0 | 2.0 | 1345 | $2,400 | $1.78 | 43d | 1 | 1.05mi |
| 5905 Clover Manor Way Unit 5907 CLOVER Sacramento, CA | 3.0 | 1.0 | 1000 | $2,000 | $2.00 | 3d | 1 | 1.11mi |
| 2360 53rd Ave Sacramento, CA | 3.0 | 1.5 | 1474 | $2,495 | $1.69 | 43d | 1 | 1.18mi |
| 6519 Prentiss Dr Sacramento, CA | 3.0 | 2.0 | 1029 | $2,300 | $2.24 | 12d | 1 | 1.29mi |
| 6739 Ferrier Ct Sacramento, CA | 3.0 | 2.0 | 1106 | $2,325 | $2.10 | 23d | 1 | 1.34mi |
| 7238 East Pkwy Apt B5 Sacramento, CA | 2.0 | 1.5 | 1020 | $1,645 | $1.61 | 7d | 1 | 1.36mi |
| 7236 East Pkwy Sacramento, CA | 2.0 | 1.0–1.5 | 776 | $1,645 | $2.12 | 3d | 1 | 1.36mi |
| 4417 A Pkwy Sacramento, CA | 3.0 | 2.0 | 1440 | $2,200 | $1.53 | 43d | 1 | 1.40mi |
Listing history 7 events
-
2026-06-18days on market $110,900 Active 7 DOM
-
2026-06-17days on market $110,900 Active 6 DOM
-
2026-06-16days on market $110,900 Active 5 DOM
-
2026-06-15days on market $110,900 Active 4 DOM
-
2026-06-13days on market $110,900 Active 2 DOM
-
2026-06-13remarks 699-char remark
-
2026-06-13$110,900 Active 1 DOM
ⓘ Source: listings_history table (triggers on properties + properties_extension) + one-shot
backfill from property_details.listing_events for pre-trigger history.
Nearby sold comps map
Loading sold comps map…
Walkable amenities ~0.75 mi
Loading nearby amenities…
Taxation est. · year 1
- Rental income
- $23,627
- − Mortgage interest
- −$6,212
- − Property taxes
- −$1,664
- − Insurance
- −$554
- − Repairs & maintenance
- −$1,890
- − Management
- −$1,890
- − Depreciation
- −$3,226
- Taxable income
- $8,191
- Est. tax owed @ 24.0%
- −$1,966
- After-tax cash flow
- $7,503/yr
For passive investors: Depreciation is non-cash, so a rental often shows a tax loss while cash-flowing — sheltering income. Rental losses are passive: they offset passive income freely, and up to $25,000/yr can offset ordinary (W-2) income if you actively participate and your MAGI is under $100k (phasing out to $0 by $150k); unused losses carry forward. On sale, claimed depreciation is recaptured at up to 25%, and gains may owe capital-gains tax (a 1031 exchange can defer both). Figures are a year-1 estimate at your 24.0% rate — not tax advice; consult a CPA.
Schools (NCES district)
- District
- Sacramento City Unified
- NCES district ID
- 0633840
- Math proficiency
- 32% ▬ 0.00%
- Reading proficiency
- 43% ▲ 3.00%
- Median HH income
- $49,280
- Composite
- 34.86/100
- National rank
- #10000
- State rank
- #804 of 1400 in CA
Livability — Lemon Hill
- Score
- 45/100
- State rank
- #1302
- US rank
- #26608
Category grades
Schools grade is shown separately in the Schools card above.
Census & demographics
- Census place
- Lemon Hill, CA
- County
- Sacramento County · 1,539,646 people
- Metro
- Sacramento-Roseville-Folsom, CA
- Population (ZIP)
- 33,083
- Household income
- $56,477
- Rent vs Own
- Severe rent burden
- 1671.0
Population outlook (Sacramento County) Hauer SSP2
- Today (2025)
- 1,660,763 people
- By 2030
- 1,732,990 · +4.3%
- By 2040
- 1,855,755 · +11.7%
- By 2050
- 1,941,335 · +16.9%
- By 2075
- 2,046,162 · +23.2%
- By 2100
- 1,961,444 · +18.1%
Race, ethnicity, and origin ACS 2023
- Neighborhood character
- Highly diverse neighborhood (Simpson 0.70)
- Race & ethnicity
- Hispanic / Latino 43% Asian 29% White 13% Two or more races 12% Black 10% Native American 2% Pacific Islander 2%
- Hispanic origin (detail)
- Mexican 38%
- Common ancestry
- Lithuanian 1% Russian 1%
- Foreign-born
- 33% · Canada, Vietnam, China
- Languages at home
- 44% English-only · Spanish 29% Other Asian/Pacific 12% Vietnamese 5%
Political lean MEDSL · Sacramento
- 2024 margin
- D (+19.7) · D 58.1% · R 38.4% · Other 3.5%
- 2008→2024 swing
- +0.7pp no change · 2008: 19.0pp · 2024: 19.7pp
- All cycles
- 2024: D+19.7 2020: D+25.3 2016: D+23.7 2012: D+16.3 2008: D+19.0
Not yet ingested
- Civics
- —
Market trends
- HPI YoY
- ▼ -341.41%
- Current HPI
- 409.6203
- Rent YoY
- ▲ 6.44%
- Metro
- Sacramento-Roseville-Folsom, CA
- State GDP YoY
- ▲ 3.21%
- F500 in state
- 116
Industry mix (Fortune 500 HQ in CA)
| Industry | F500 HQs | Revenue |
|---|---|---|
| Technology | 27 | $1,492B |
|
||
| Financial Services | 3 | $174B |
|
||
| Retail | 3 | $44B |
|
||
| Insurance | 3 | $26B |
|
||
| Media / Entertainment | 2 | $115B |
|
||
| Pharmaceuticals / Biotech | 2 | $62B |
|
||
Cash-flow waterfall
monthlySold comps — $/sqft
last 12 mo · ≤1 miLoading sold comps…