 🏗️ New Construction
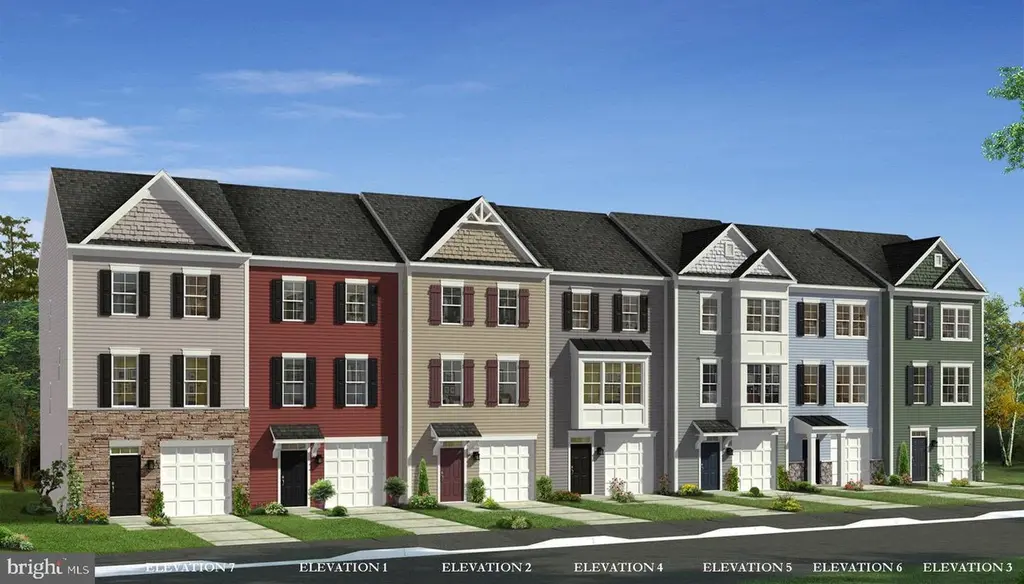
HOMESITE 731 Abigail St · Charles Town, WV
Flood risk 1/10 · Minimal
- FEMA flood zone
- X (unshaded)
- Chance of flooding over 30 yrs
- 0.0%
- Est. flood insurance / yr
- $507 – $1,088
Fire risk 1/10 · Minimal
- Est. fire insurance / yr
- $787 – $1,461
Heat risk 5/10 · Moderate
- Hot days now (above 103°F)
- 7 days/yr
- Hot days in 30 yrs
- 16 days/yr
Wind risk 3/10 · Minor
- Chance of severe wind over 30 yrs
- 5.0%
Air-quality risk 2/10 · Minimal
- Unhealthy air days now
- 1 days/yr
- Unhealthy air days in 30 yrs
- 1 days/yr
Risk factors via First Street. Map © Google.
Why this score? — see what drove the D grade
The composite is a weighted blend of 9 inputs, each scored 0–100. Each bar is that input's sub-score; the figure is the points it added to the 100-point composite (weight × sub-score).
- Cash flow +8.1/30.0
- ARV discount +7.5/15.0
- Appreciation +6.3/10.0
- Condition / age +5.0/5.0
- Livability +3.8/5.0
- Rent growth +3.6/5.0
- Schools +3.4/10.0
- 1% rule +2.8/10.0
- DSCR +2.2/10.0
$299,505
🖨 Deal sheet (PDF) 📄 Offer letter ✓ Due diligence
Listing remarks
The only community within historic Charles Town with resort style amenities! * * UP TO $10,000 CLOSING COST ASSISTANCE AVAILABLE ON SELECT HOMES, FOR PRIMARY RESIDENCE WITH USE OF APPROVED LENDER AND TITLE! * * The Bedford II is a thoughtfully designed three-level home offering a functional and open layout ideal for modern living. A covered front porch welcomes you into a spacious foyer with access to a versatile lower level, featuring an attached 1-car garage or optional flex room or study. The main level showcases an open-concept design with a country kitchen, available with an optional island, flowing seamlessly into the living and dining areas—perfect for everyday living and
Key facts
- $77 HOA
- Garage
- Built 2026
Neighborhood map
What this means for you Summary
Snapshot
- This is a 3-bed/2.5-bath townhouse listed at $300k. Condition is rated excellent.
Deal economics
- At list price, monthly cash flow is $-293 ($-4k/yr) — negative.
- To cash-flow at today's rent, offer at most $261k (12.9% below list).
- To meet the 1% rule (rent ≥ 1% of price), the offer needs to be $238k (20.6% below list).
- Recommended offer: $238k (20.6% below list) — sets the bar for 1% rule.
- Cap rate 5.1% vs local median 3.5% in Charles Town — top-decile yield for the area; either an underpriced asset or a hidden risk that comps aren't pricing in. Stress-test before assuming the spread holds.
Location & tenants
- Location reads 76/100 on livability (#22 in WV, #3,460 nationally) — a middle-class / working-renter tenant base. Strengths: crime A+, housing A+, health & safety A+; Watch: amenities D+, commute F.
- Jefferson County Schools (rural): math 29% / reading 46% proficiency, ranked #6 of 55 in WV (top 11%) — families likely to look elsewhere, expect single-tenant / working-renter base with shorter leases.
- Zoned schools: Page Jackson Elementary (365 students, 0% FRL); Charles Town Middle School (math 22% / reading 45%, grade F, #40 of 109 statewide, top 37%, 637 students, 0% FRL); Washington High School (math 32% / reading 57%, grade F, #11 of 110 statewide, top 11%, 1,328 students, 0% FRL) — zoned schools average 0% FRL vs 33% district-wide (33 pts lower); this property's tenant base skews higher-income than the district average.
- Market conditions: Rents rising fast (+4.3%/yr); 392 active listings in the ZIP; 2 comparable units currently listed for rent nearby; solid renter incomes; 1,162 units permitted in Jefferson County in 2024 (360 in 5+ unit buildings).
Forward outlook
- In year one you build about $10k of equity ($2k loan paydown + $8k appreciation (2.7% local appreciation)).
- Jefferson County population projected at +13% by 2050 — modest demand growth; plan on rents tracking national, not racing it.
- By year 4, paydown + projected appreciation supports a ~$35k cash-out refi (75% LTV) — recoverable capital for the next deal without selling this one.
Negotiation context
- Only 0 days on market — expect competitive offers; lowballing is unlikely to land.
Risks & watch-outs
- Climate carrying-cost: extreme-heat days projected 7→16/yr by 2055 (HVAC capex compounding) — expect insurance premiums to compound above CPI over the hold.
Questions for the listing agent
- What do current leases actually rent for vs. the listed asking? Can we see a recent rent roll and the last 12 months of T-12 income?
- What does the HOA fee cover, when was the last increase, and are there any pending special assessments or reserve-fund shortfalls?
- Is there a deadline driving the sale (1031 exchange, divorce, estate, relocation)? That informs how much negotiation room exists.
- Schools are D-rated, which usually means shorter tenancies and higher turnover. Who's the typical renter profile here, and what's been the actual vacancy rate?
- The area grade is low — what's the realistic commute time and amenity access for the typical tenant pool here? Any planned neighborhood developments (good or bad) we should know about?
- What's the average days-on-market for RENTAL listings here right now (not sales)? A rising rental-DOM trend means longer vacancies and softer asking-rent achievability than the comps imply.
- What's the recent tenant-quality profile in this submarket — average credit score on applications, eviction rate, late-payment / NSF rate, and stable-employment percentage? A property-management company in the area should have these aggregated.
- How much new for-sale + rental construction is in the pipeline within 1–3 miles? Heavy new supply typically softens prices + rents 12–24 months out; constrained supply supports both.
Investment metrics
- 1% rule
- 0.78% ✗
- Cap rate
- 5.13%
- Cash-on-cash
- -4.14%
- DSCR
- 0.82
- GRM
- 10.6
CMA / ARV
- ARV (on-the-fly)
- $303,203
- Comps found
- 9
Show comp detail 9 sales within ~0.75 mi
| Address | Dist | Beds/Ba | Sqft | Sold | Price | $/sf | Match |
|---|---|---|---|---|---|---|---|
| 15 Abigail St | 0.06mi | 3/3.5 | 1,625 (+3%) | 7mo | $294,754 | $181 | 82 |
| 652 Newbury St | 0.06mi | 3/3.5 | 1,658 (+6%) | 7mo | $320,000 | $193 | 78 |
| 781 Lord Fairfax St | 0.10mi | 3/3.5 | 1,630 (+4%) | 9mo | $295,000 | $181 | 77 |
| 815 Lord Fairfax St | 0.11mi | 3/3.5 | 1,630 (+4%) | 9mo | $292,000 | $179 | 77 |
| 626 Newbury St | 0.14mi | 3/3.5 | 1,630 (+4%) | 8mo | $320,013 | $196 | 77 |
| 763 Lord Fairfax St | 0.20mi | 3/3.5 | 1,671 (+6%) | 11mo | $322,720 | $193 | 67 |
| 93 Union Ridge Dr | 0.61mi | 3/2.5 | 1,584 (+1%) | 9mo | $325,000 | $205 | 63 |
| 245 Union Ridge Dr | 0.56mi | 3/3.0 | 1,648 (+5%) | 8mo | $310,000 | $188 | 57 |
| 101 Union Ridge Dr | 0.61mi | 3/2.5 | 1,724 (+10%) | 2mo | $355,000 | $206 | 54 |
Match score weights: distance 35% · size 25% · config 20% · recency 20%. Top-matched comps best support the ARV.
Projected returns pro-forma
2.67% appreciation · 4.35% rent growth · sell at horizon
- IRR
- 3.3%
- Equity multiple
- 1.19×
- Total profit
- $16,046
- Equity at exit
- $130,816
- IRR
- 7.5%
- Equity multiple
- 2.12×
- Total profit
- $94,961
- Equity at exit
- $197,414
Cash invested: $84,897 (down + closing). Projections, not guarantees.
Landlord ↔ Tenant lean methodology
- Overall (STATE)
- 83 Strongly Landlord-Friendly
- State West Virginia
- 83 Strongly Landlord-Friendly · R+22
- County
- — inherits STATE
- City
- — inherits STATE
ZIP-level market 25414
- Home prices YoY
- 0.9%
- Rents YoY
- 4.3%
- Active inventory
- 392
- Price-to-rent
- 10.5×
Monthly cashflow live
- Estimated rent
- $2,379 medium interval (Pro) →
- Mortgage (P&I)
- −$1,590
- Tax est. 1.5%
- −$379 /mo · $4,548/yr
- Insurance
- −$126
- HOA
- −$77
- Vacancy / Maint / Mgmt
- −$500
- Net cashflow
- $-293
Break-even live
Sensitivity live
| Price | -10% $-83 | -5% $-188 | +0% $-293 | +5% $-398 | +10% $-502 |
|---|---|---|---|---|---|
| Rent | -10% $-481 | -5% $-387 | +0% $-293 | +5% $-199 | +10% $-105 |
| Rate | -1.0pp $-140 | -0.5pp $-216 | base $-293 | +0.5pp $-371 | +1.0pp $-451 |
UW: 25.0% down · 7.5% · 30yr · 1.5% tax · 5.0% vac · 8.0% maint · 8.0% mgmt
Financing live
Cash to close
- Down payment
- $75,801
- Closing costs
- $9,096
- Reserves months
- —
- Total cash needed
- —
Loan-product check · same deal, 3 products live
Conventional
25% down · 7.5% · 30yr
- Down + closing
- —
- Monthly P&I
- —
- Monthly cashflow
- —
- DSCR
- —
- Eligible?
- —
Personal DTI + credit; lowest rate.
DSCR
20% down · 8.5% · 30yr
- Down + closing
- —
- Monthly P&I
- —
- Monthly cashflow
- —
- DSCR
- —
- Eligible?
- —
No personal income docs; deal must DSCR.
Hard money
10% down · 12.0% · 12mo
- Down + closing
- —
- Monthly P&I
- —
- Monthly cashflow
- —
- DSCR
- —
- Eligible?
- —
Short-term bridge; refi at stabilization.
Rent comps 2 comps
| Address | Beds | Baths | Sqft | Rent | $/sqft | DOM | Units | Dist |
|---|---|---|---|---|---|---|---|---|
| 37 Abigail St Unit 1 Charles Town, WV | 3.0 | 3.5 | 2169 | $2,150 | $0.99 | 26d | 1 | 0.08mi |
| 341 Bullskin St Charles Town, WV | 3.0 | 2.5 | 1976 | $2,725 | $1.38 | 26d | 1 | 0.57mi |
HOA detail
- Monthly dues
- $77 · $924/yr
Listing history 2 events
-
2026-04-07$299,505
-
2026-04-07historical
ⓘ Source: listings_history table (triggers on properties + properties_extension) + one-shot
backfill from property_details.listing_events for pre-trigger history.
Climate risk First Street
- Flood 1/10 Low FEMA zone X (unshaded) · 0% chance over 30 yrs
- Wildfire 1/10 Low
- Heat 5/10 Major 7 d/yr ≥103°F today · 16 d/yr by 30 yrs out
- Wind 3/10 Moderate 5% chance of damaging wind over 30 yrs
- Air quality 2/10 Low 1 unhealthy d/yr today · 1 by 30 yrs out
Nearby sold comps map
Loading sold comps map…
Walkable amenities ~0.75 mi
Loading nearby amenities…
Taxation est. · year 1
- Rental income
- $28,550
- − Mortgage interest
- −$16,984
- − Property taxes
- −$4,548
- − Insurance
- −$1,516
- − Repairs & maintenance
- −$2,284
- − Management
- −$2,284
- − HOA
- −$924
- − Depreciation
- −$8,820
- Taxable loss
- −$8,811
- Est. tax savings @ 24.0%
- +$2,115
- After-tax cash flow
- $-1,400/yr
For passive investors: Depreciation is non-cash, so a rental often shows a tax loss while cash-flowing — sheltering income. Rental losses are passive: they offset passive income freely, and up to $25,000/yr can offset ordinary (W-2) income if you actively participate and your MAGI is under $100k (phasing out to $0 by $150k); unused losses carry forward. On sale, claimed depreciation is recaptured at up to 25%, and gains may owe capital-gains tax (a 1031 exchange can defer both). Figures are a year-1 estimate at your 24.0% rate — not tax advice; consult a CPA.
Condition & rehab AI · 2 photos
This townhouse is in excellent condition with no visible repairs or maintenance needed. It is move-in ready and ideal for both resale and rental due to its resort-style amenities and modern design.
Schools (NCES district)
- District
- Jefferson County Schools
- NCES district ID
- 5400570
- Math proficiency
- 29% ▼ -13.00%
- Reading proficiency
- 46% ▼ -7.00%
- Median HH income
- $67,038
- Composite
- 33.98/100
- National rank
- #5322
- State rank
- #6 of 55 in WV
Livability — Charles Town
- Score
- 76/100
- State rank
- #22
- US rank
- #3460
Category grades
Schools grade is shown separately in the Schools card above.
Census & demographics
- Census place
- Charles Town, WV
- County
- Jefferson County · 28,403 people
- City population
- 21,073
- Metro
- Washington-Arlington-Alexandria, DC-VA-MD-WV
- Population (ZIP)
- 21,073
- Household income
- $105,500
- Rent vs Own
- Severe rent burden
- 290.0
Population outlook (Jefferson County) Hauer SSP2
- Today (2025)
- 61,715 people
- By 2030
- 64,052 · +3.8%
- By 2040
- 67,713 · +9.7%
- By 2050
- 69,843 · +13.2%
- By 2075
- 72,679 · +17.8%
- By 2100
- 71,872 · +16.5%
Race, ethnicity, and origin ACS 2023
- Neighborhood character
- Predominantly White (78%)
- Race & ethnicity
- White 78% Two or more races 10% Black 7% Hispanic / Latino 7% Asian 1%
- Hispanic origin (detail)
- Mexican 2% Puerto Rican 1%
- Common ancestry
- Romanian 3% Slovak 2% Lithuanian 2%
- Foreign-born
- 5% · Canada, Jamaica
- Languages at home
- 93% English-only · Spanish 5% Other Indo-European 1%
Political lean MEDSL · Jefferson
- 2024 margin
- R (+15.8) · D 41.0% · R 56.8% · Other 2.1%
- 2008→2024 swing
- -20.6pp toward R · 2008: 4.8pp · 2024: -15.8pp
- All cycles
- 2024: R+15.8 2020: R+10.5 2016: R+15.3 2012: R+4.0 2008: D+4.8
Not yet ingested
- Civics
- —
Market trends
- HPI YoY
- ▲ 2.67%
- Current HPI
- 296.8007
- Rent YoY
- ▲ 4.35%
- Metro
- Washington-Arlington-Alexandria, DC-VA-MD-WV
- State GDP YoY
- —
- F500 in state
- 0
Price history
2 events — show timeline
- 2026-04-07 Listing Removed — BRIGHT MLS
- 2026-04-07 Listed $299,505 BRIGHT MLS
Cash-flow waterfall
monthlySold comps — $/sqft
last 12 mo · ≤1 miLoading sold comps…