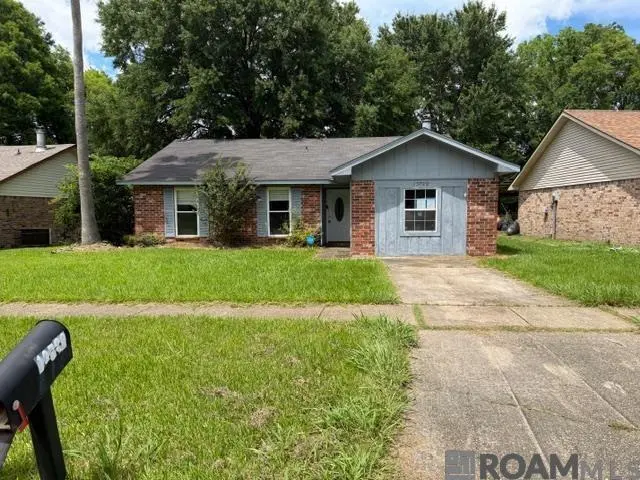
13722 Rampart Ct · Village St. George, LA
Flood risk 4/10 · Minor
- FEMA flood zone
- X
- Chance of flooding over 30 yrs
- 0.2%
- Est. flood insurance / yr
- $507 – $1,088
Fire risk 1/10 · Minimal
- Est. fire insurance / yr
- $1,269 – $2,357
Heat risk 8/10 · Major
- Hot days now (above 108°F)
- 7 days/yr
- Hot days in 30 yrs
- 21 days/yr
Wind risk 9/10 · Severe
- Chance of severe wind over 30 yrs
- 99.0%
Air-quality risk 3/10 · Minor
- Unhealthy air days now
- 3 days/yr
- Unhealthy air days in 30 yrs
- 3 days/yr
Risk factors via First Street. Map © Google.
Why this score? — see what drove the B grade
The composite is a weighted blend of 9 inputs, each scored 0–100. Each bar is that input's sub-score; the figure is the points it added to the 100-point composite (weight × sub-score).
- Cash flow +30.0/30.0
- ARV discount +15.0/15.0
- DSCR +10.0/10.0
- 1% rule +9.3/10.0
- Rent growth +2.7/5.0
- Livability +2.5/5.0
- Condition / age +2.5/5.0
- Schools +2.4/10.0
- Appreciation +0.0/10.0
$110,000
🖨 Deal sheet 📄 Offer letter ✓ Due diligence
Listing remarks MLS
This 3-bedroom, 2-bath home offers a little over 1,500 square feet of living area and is full of possibilities. The kitchen features plenty of cabinet space and is combined with a dining area, creating a comfortable space for family meals and gatherings. The living room includes a cozy fireplace, perfect for relaxing evenings at home. An additional bonus room provides flexibility and could be used as a den, family room, home office, or even a 4th bedroom. Outside, you'll find a fenced backyard with a storage shed, offering extra storage and space for outdoor enjoyment. With a little TLC, this property has tremendous potential and can easily become the perfect place to call home. Don't miss this opportunity to add your personal touch and make it your own!
Key facts
- Bonus room
- Storage shed
- Fenced backyard
Tags
Property features AI
Finance
- Other: Located in the Perkins Village subdivision; Directions: Siegen Lane then Perkins Rd → Conti → Rampart Ct
Exterior
- Parking: Open parking
- Utilities: Public water; Public sewer
- Home design: Detached single-family residence; Residential property
- Construction: Brick construction; Slab foundation; Built in 1544
- Exterior features: Chain-link fencing
Interior
- Bathrooms: 2 full bathrooms
- Heating & cooling: Central heating; Central air conditioning
- Interior features: Fireplace (1)
Neighborhood map
What this means for you Summary
Snapshot
- This is a 3-bed/2.0-bath single-family listed at $110k.
Deal economics
- At list price, monthly cash flow is $513 ($6k/yr) — positive.
- The deal already cash-flows at list — no discount required.
- Meets the 1% rule at list price ($2k rent vs $110k).
- Cap rate 11.9% vs local median 3.9% in Village St. George — top-decile yield for the area; either an underpriced asset or a hidden risk that comps aren't pricing in. Stress-test before assuming the spread holds.
Location & tenants
- Location reads: area grade B — affects rentability + tenant quality, not the cash-flow math above.
- East Baton Rouge Parish (urban): math 22% / reading 34% proficiency, ranked #47 of 98 in LA (top 48%) — low school quality limits family demand, transient renter base, plan for 1-2y turnover; 77% free/reduced lunch — lower-income household profile, screen leases tightly.
- Market conditions: Rents flat; 625 active listings in the ZIP; 13 comparable units currently listed for rent nearby; rentals lingering (median 44d on market — plan ~5-8 weeks vacancy on turnover, expect pricing pressure); 62% of comp listings sitting > 30 days — soft ceiling on asking rent; solid renter incomes; 2,252 units permitted in East Baton Rouge Parish in 2024 (440 in 5+ unit buildings).
Forward outlook
- Local home prices are declining (-3.0%/yr); year-one equity from $761 of loan paydown is wiped out by about $3k of value loss. Plan a longer hold.
- East Baton Rouge County population projected at +4% by 2050 — modest demand growth; plan on rents tracking national, not racing it.
- At projected returns (-3.0% appreciation + 0.7% rent growth), your $31k cash investment doubles in ~8 years — after that, you're playing with house money.
Negotiation context
- Only 9 days on market — expect competitive offers; lowballing is unlikely to land.
- 10 sale attempts since 21y ago with the ask held roughly flat each time — persistent listings suggest the price (not the market) is what's stuck; bring a comps-based counter.
Risks & watch-outs
- Climate carrying-cost: severe wind risk, 99% chance of damaging wind over 30y; extreme-heat days projected 7→21/yr by 2055 (HVAC capex compounding) — expect insurance premiums to compound above CPI over the hold.
Questions for the listing agent
- Is there a deadline driving the sale (1031 exchange, divorce, estate, relocation)? That informs how much negotiation room exists.
- What's the average days-on-market for RENTAL listings here right now (not sales)? A rising rental-DOM trend means longer vacancies and softer asking-rent achievability than the comps imply.
- What's the recent tenant-quality profile in this submarket — average credit score on applications, eviction rate, late-payment / NSF rate, and stable-employment percentage? A property-management company in the area should have these aggregated.
- How much new for-sale + rental construction is in the pipeline within 1–3 miles? Heavy new supply typically softens prices + rents 12–24 months out; constrained supply supports both.
Investment metrics
- 1% rule
- 1.43% ✓
- Cap rate
- 11.89%
- Cash-on-cash
- 20.00%
- DSCR
- 1.89
- GRM
- 5.8
CMA / ARV
- ARV (on-the-fly)
- $188,188
- Comps found
- 12
Show comp detail 12 sales within ~0.75 mi
| Address | Dist | Beds/Ba | Sqft | Sold | Price | $/sf | Match |
|---|---|---|---|---|---|---|---|
| 14105 Rampart Ct | 0.10mi | 3/2.0 | 1,218 (-0%) | 0mo | $188,500 | $155 | 94 |
| 13776 Broad Ct | 0.18mi | 3/2.0 | 1,222 (0%) | 3mo | $188,500 | $154 | 89 |
| 14267 Gravier Ave | 0.17mi | 3/2.0 | 1,175 (-4%) | 3mo | $150,000 | $128 | 83 |
| 14104 Gravier Ave | 0.09mi | 4/2.0 (+1) | 1,260 (+3%) | 6mo | $169,500 | $135 | 81 |
| 1977 Denver Dr | 0.62mi | 3/2.0 | 1,155 (-6%) | 4mo | $195,000 | $169 | 59 |
| 9127 Baronne Dr | 0.17mi | 4/2.0 (+1) | 1,400 (+15%) | 8mo | $219,000 | $156 | 56 |
| 7344 Meadowview Ave | 0.55mi | 3/1.5 | 1,100 (-10%) | 2mo | $169,000 | $154 | 54 |
| 7356 Meadowview Ave | 0.56mi | 4/2.0 (+1) | 1,330 (+9%) | 5mo | $189,000 | $142 | 50 |
| 1922 Mullen Dr | 0.68mi | 3/1.5 | 1,375 (+12%) | 3mo | $215,000 | $156 | 43 |
| 1884 Mullen Dr | 0.69mi | 3/2.0 | 1,375 (+12%) | 10mo | $229,000 | $167 | 38 |
| 1711 Southland Ct | 0.60mi | 3/1.5 | 1,064 (-13%) | 14mo | $147,000 | $138 | 37 |
| 1954 Denver St | 0.60mi | 3/1.0 | 1,069 (-12%) | 21mo | $130,000 | $122 | 29 |
Match score weights: distance 35% · size 25% · config 20% · recency 20%. Top-matched comps best support the ARV.
Projected returns pro-forma
-3.0% appreciation · 0.68% rent growth · sell at horizon
- IRR
- 9.6%
- Equity multiple
- 1.37×
- Total profit
- $11,293
- Equity at exit
- $16,401
- IRR
- 16.7%
- Equity multiple
- 2.23×
- Total profit
- $37,906
- Equity at exit
- $9,511
Cash invested: $30,800 (down + closing). Projections, not guarantees.
Landlord ↔ Tenant lean methodology
- Overall (STATE)
- 90 Strongly Landlord-Friendly
- State Louisiana
- 90 Strongly Landlord-Friendly · R+12
- County
- — inherits STATE
- City
- — inherits STATE
ZIP-level market 70810
- Rents YoY
- 0.7%
- Active inventory
- 625
- Price-to-rent
- 5.8×
Monthly cashflow live
- Estimated rent
- $1,573 high interval (Pro) →
- Mortgage (P&I)
- −$577
- Tax from tax record
- −$106 /mo · $1,275/yr
- Insurance
- −$46
- HOA
- −$0
- Vacancy / Maint / Mgmt
- −$330
- Net cashflow
- $513
Break-even live
UW: 25.0% down · 7.5% · 30yr · 1.5% tax · 5.0% vac · 8.0% maint · 8.0% mgmt
Financing live
Cash to close
- Down payment
- $27,500
- Closing costs
- $3,300
- Reserves months
- —
- Total cash needed
- —
Loan-product check · same deal, 3 products live
Conventional
25% down · 7.5% · 30yr
- Down + closing
- —
- Monthly P&I
- —
- Monthly cashflow
- —
- DSCR
- —
- Eligible?
- —
Personal DTI + credit; lowest rate.
DSCR
20% down · 8.5% · 30yr
- Down + closing
- —
- Monthly P&I
- —
- Monthly cashflow
- —
- DSCR
- —
- Eligible?
- —
No personal income docs; deal must DSCR.
Hard money
10% down · 12.0% · 12mo
- Down + closing
- —
- Monthly P&I
- —
- Monthly cashflow
- —
- DSCR
- —
- Eligible?
- —
Short-term bridge; refi at stabilization.
Rent comps 13 comps
| Address | Beds | Baths | Sqft | Rent | $/sqft | DOM | Units | Dist |
|---|---|---|---|---|---|---|---|---|
| 14145 Gravier Ave Baton Rouge, LA | 4.0 | 2.0 | 1442 | $2,200 | $1.53 | 23d | 1 | 0.11mi |
| 8933 Baronne Dr Baton Rouge, LA | 3.0 | 2.0 | 1386 | $1,450 | $1.05 | 44d | 1 | 0.15mi |
| 13650 Kenner Ave Unit 13650A Baton Rouge, LA | 2.0 | 2.5 | 1175 | $975 | $0.83 | 44d | 1 | 0.33mi |
| 13621 Kenner Ave Unit 13621D Baton Rouge, LA | 2.0 | 2.5 | 1175 | $975 | $0.83 | 23d | 1 | 0.34mi |
| 13610 Kenner Ave Unit 13610D Baton Rouge, LA | 2.0 | 2.5 | 1175 | $975 | $0.83 | 44d | 1 | 0.37mi |
| 7047 Meadow Park Avennue Baton Rouge, LA | 3.0 | 2.0 | 1100 | $1,150 | $1.05 | 44d | 1 | 0.56mi |
| 7317 Meadow Park Ave Baton Rouge, LA | 3.0 | 2.0 | 1251 | $1,600 | $1.28 | 44d | 1 | 0.59mi |
| 8363 Siegen Ln Baton Rouge, LA | 1.0–3.0 | 1.0–1.5 | 741 | $1,111 | $1.50 | 14d | 4 | 0.67mi |
| 1345 Bullrush Dr Baton Rouge, LA | 3.0 | 2.0 | 1294 | $1,800 | $1.39 | 14d | 1 | 1.01mi |
| 9645 Siegen Ln Baton Rouge, LA | 2.0 | 2.0 | 1100 | $1,350 | $1.23 | 44d | 1 | 1.13mi |
| 9849 Siegen Ln Baton Rouge, LA | 2.0 | 2.5 | 1260 | $1,575 | $1.25 | 14d | 1 | 1.25mi |
| 9843 Siegen Ln Baton Rouge, LA | 2.0 | 2.5 | 1225 | $1,500 | $1.22 | 44d | 1 | 1.26mi |
| 1741 Twisted Oak Ln Baton Rouge, LA | 3.0 | 2.0 | 1368 | $1,825 | $1.33 | 44d | 1 | 1.39mi |
Listing history 9 events
-
2026-06-09status $110,000 Pending 9 DOM
-
2026-06-08days on market $110,000 Active 9 DOM
-
2026-06-07days on market $110,000 Active 8 DOM
-
2026-06-05days on market $110,000 Active 5 DOM
-
2026-06-03days on market $110,000 Active 4 DOM
-
2026-06-02days on market $110,000 Active 3 DOM
-
2026-06-01days on market $110,000 Active 2 DOM
-
2026-05-31remarks 699-char remark
-
2026-05-31$110,000 Active 1 DOM
ⓘ Source: listings_history table (triggers on properties + properties_extension) + one-shot
backfill from property_details.listing_events for pre-trigger history.
Tax reassessment forecast LA · Resets to sale price
- Current annual tax
- $1,275 · $106/mo
- Projected year-2 tax
- $1,275 · $106/mo
- Expected delta
- $0/yr ($0/mo · 0.0%)
ⓘ Screening estimate from a state-policy table — verify with the county assessor before closing.
Climate risk First Street
- Flood 4/10 Moderate FEMA zone X · 20% chance over 30 yrs
- Wildfire 1/10 Low
- Heat 8/10 Severe 7 d/yr ≥108°F today · 21 d/yr by 30 yrs out
- Wind 9/10 Extreme 99% chance of damaging wind over 30 yrs
- Air quality 3/10 Moderate 3 unhealthy d/yr today · 3 by 30 yrs out
Nearby sold comps map
Loading sold comps map…
Walkable amenities ~0.75 mi
Loading nearby amenities…
Taxation est. · year 1
- Rental income
- $18,872
- − Mortgage interest
- −$6,162
- − Property taxes
- −$1,275
- − Insurance
- −$550
- − Repairs & maintenance
- −$1,510
- − Management
- −$1,510
- − Depreciation
- −$3,200
- Taxable income
- $4,665
- Est. tax owed @ 24.0%
- −$1,120
- After-tax cash flow
- $5,042/yr
For passive investors: Depreciation is non-cash, so a rental often shows a tax loss while cash-flowing — sheltering income. Rental losses are passive: they offset passive income freely, and up to $25,000/yr can offset ordinary (W-2) income if you actively participate and your MAGI is under $100k (phasing out to $0 by $150k); unused losses carry forward. On sale, claimed depreciation is recaptured at up to 25%, and gains may owe capital-gains tax (a 1031 exchange can defer both). Figures are a year-1 estimate at your 24.0% rate — not tax advice; consult a CPA.
Schools (NCES district)
- District
- East Baton Rouge Parish
- NCES district ID
- 2200540
- Math proficiency
- 22% ▼ -36.00%
- Reading proficiency
- 34% ▼ -31.00%
- Median HH income
- $46,263
- Composite
- 24.14/100
- National rank
- #7745
- State rank
- #47 of 98 in LA
Livability — Village St. George
No livability data for this city. (Only ~50 U.S. cities are tracked.)
Census & demographics
- Census place
- Village St. George, LA
- County
- East Baton Rouge Parish · 399,686 people
- Metro
- Baton Rouge, LA
- Population (ZIP)
- 42,659
- Household income
- $92,098
- Rent vs Own
- Severe rent burden
- 1106.0
Population outlook (East Baton Rouge County) Hauer SSP2
- Today (2025)
- 464,810 people
- By 2030
- 472,137 · +1.6%
- By 2040
- 480,243 · +3.3%
- By 2050
- 484,422 · +4.2%
- By 2075
- 492,069 · +5.9%
- By 2100
- 476,347 · +2.5%
Race, ethnicity, and origin ACS 2023
- Neighborhood character
- Diverse neighborhood (Simpson 0.60)
- Race & ethnicity
- White 55% Black 29% Hispanic / Latino 7% Two or more races 6% Asian 6%
- Hispanic origin (detail)
- Mexican 1%
- Common ancestry
- Lithuanian 11% Slovak 2% Scottish 1%
- Foreign-born
- 9% · Canada, China, South Korea
- Languages at home
- 89% English-only · Spanish 4% Other Indo-European 2% Chinese 1%
Political lean MEDSL · East Baton Rouge
- 2024 margin
- D (+11.1) · D 54.5% · R 43.4% · Other 2.1%
- 2008→2024 swing
- +8.9pp toward D · 2008: 2.2pp · 2024: 11.1pp
- All cycles
- 2024: D+11.1 2020: D+13.1 2016: D+9.2 2012: D+5.2 2008: D+2.2
Not yet ingested
- Civics
- —
Market trends
- HPI YoY
- ▼ -117.55%
- Current HPI
- 172.7593
- Rent YoY
- ▲ 0.68%
- Metro
- Baton Rouge, LA
- State GDP YoY
- ▲ 3.29%
- F500 in state
- 10
Industry mix (Fortune 500 HQ in LA)
| Industry | F500 HQs | Revenue |
|---|---|---|
| Telecommunications | 2 | $23B |
|
||
| Utilities | 1 | $12B |
|
||
| Wholesale / Distribution | 1 | $5B |
|
||
| Advertising | 1 | $2B |
|
||
Price history
+0.9% since first listed13 events — show timeline
- 2026-05-30 Listed $110,000 GBRMLS
- 2026-05-30 Listed $110,000 AcadianaMLS
- 2013-08-12 Sold (MLS) — GBRMLS
- 2013-06-13 Listed $79,900 AcadianaMLS
- 2013-06-13 Listed $79,900 GBRMLS
- 2013-03-24 Listed $65,500 AcadianaMLS
- 2013-03-24 Listed $65,500 GBRMLS
- 2013-01-04 Listed $90,000 AcadianaMLS
- 2013-01-04 Listed $90,000 GBRMLS
- 2005-12-08 Sold (Public Records) $109,000 Public Records
- 2005-12-05 Sold (MLS) — GBRMLS
- 2005-09-27 Listed $109,000 GBRMLS
- 2005-09-27 Listed $109,000 AcadianaMLS
Property tax history
+11.3%/yrLatest (2025): $1,275 · -0.5% YoY. Source: county tax records.
Cash-flow waterfall
monthlySold comps — $/sqft
last 12 mo · ≤1 miLoading sold comps…