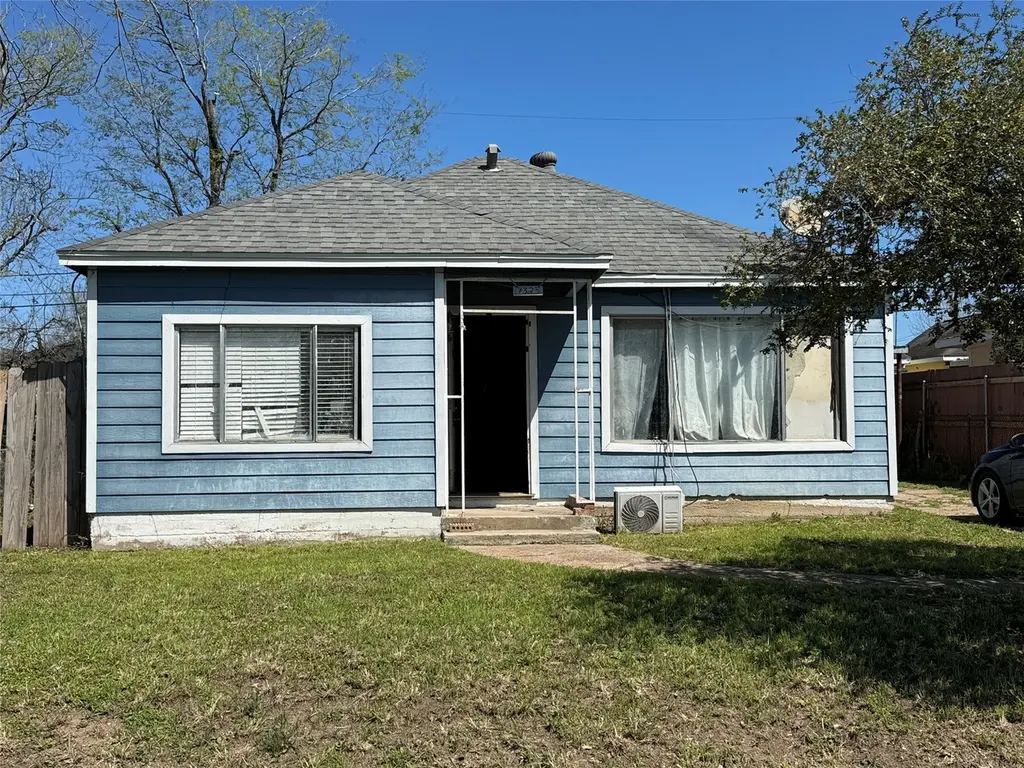
7323 Dallas St · Houston, TX
Flood risk 9/10 · Severe
- FEMA flood zone
- AE
- Chance of flooding over 30 yrs
- 0.99%
- Est. flood insurance / yr
- $1,737 – $8,500
Fire risk 1/10 · Minimal
- Est. fire insurance / yr
- $1,222 – $2,270
Heat risk 9/10 · Severe
- Hot days now (above 109°F)
- 7 days/yr
- Hot days in 30 yrs
- 24 days/yr
Wind risk 9/10 · Severe
- Chance of severe wind over 30 yrs
- 99.0%
Air-quality risk 2/10 · Minimal
- Unhealthy air days now
- 2 days/yr
- Unhealthy air days in 30 yrs
- 2 days/yr
Risk factors via First Street. Map © Google.
Why this score? — see what drove the B+ grade
The composite is a weighted blend of 9 inputs, each scored 0–100. Each bar is that input's sub-score; the figure is the points it added to the 100-point composite (weight × sub-score).
- Cash flow +30.0/30.0
- 1% rule +10.0/10.0
- DSCR +10.0/10.0
- Appreciation +10.0/10.0
- ARV discount +7.5/15.0
- Livability +3.7/5.0
- Schools +2.7/10.0
- Condition / age +2.5/5.0
- Rent growth +1.8/5.0
$110,000
🖨 Deal sheet (PDF) 📄 Offer letter ✓ Due diligence
Listing remarks MLS
Calling all investors! This property is a prime opportunity for an investor looking to capitalize on the rapid redevelopment in the East Park subdivision located just minutes from downtown Houston. 7323 Dallas St. sits in an up and coming area where new construction is transforming the neighborhood. Whether you choose a full-scale "to the studs" renovation or prefer to clear the lot to build a modern single-family home or a duplex, there is great potential for ROI. Make your appointment today.
Key facts
- New construction
- 5,000 sq ft lot
- Garage
Tags
Neighborhood map
What this means for you Summary
Snapshot
- This is a 4-bed/2.0-bath single-family listed at $110k.
Deal economics
- At list price, monthly cash flow is $45 ($546/yr) — positive.
- The deal already cash-flows at list — no discount required.
- Meets the 1% rule at list price ($2k rent vs $110k).
- Recommended offer: $107k (3.0% below list) — sets the bar for market timing.
- Cap rate 11.4% vs local median 3.2% in Houston — top-decile yield for the area; either an underpriced asset or a hidden risk that comps aren't pricing in. Stress-test before assuming the spread holds.
Location & tenants
- Location reads 74/100 on livability (#184 in TX, #4,771 nationally) — a middle-class / working-renter tenant base. Strengths: amenities A+, cost of living A+, housing A+; Watch: schools D, crime F.
- Houston ISD (urban): math 27% / reading 35% proficiency, ranked #593 of 826 in TX (top 72%) — families likely to look elsewhere, expect single-tenant / working-renter base with shorter leases; 71% free/reduced lunch — lower-income household profile, screen leases tightly.
- Market conditions: Rents soft (-2.9%/yr); 161 active listings in the ZIP; 9 comparable units currently listed for rent nearby; rentals at typical pace (median 25d on market — plan ~3-4 weeks tenant-placement turnaround); 44% of comp listings sitting > 30 days — soft ceiling on asking rent; 29,883 units permitted in Harris County in 2024 (8,621 in 5+ unit buildings).
- This rent runs 43% of the median local income ($50k/yr) — at the standard rent-burdened threshold; future hikes will face affordability resistance.
Forward outlook
- In year one you build about $12k of equity ($761 loan paydown + $11k appreciation (10.0% local appreciation)).
- Harris County population projected at +47% by 2050 — long-run rental-demand tailwind backs the buy-and-hold thesis.
- At projected returns (10.0% appreciation + 0.0% rent growth), your $31k cash investment doubles in ~3 years — after that, you're playing with house money.
- By year 4, paydown + projected appreciation supports a ~$42k cash-out refi (75% LTV) — recoverable capital for the next deal without selling this one.
Negotiation context
- It's been on market 38 days — a 3% lower offer ($107k) is reasonable based on typical stale-listing flexibility.
- 2 sale attempts; this cycle's ask has dropped $20k (15%) from the opening price — seller is motivated, your offer sets the floor, not the list.
Risks & watch-outs
- Watch-outs: property tax is 3.4% of price; flood insurance adds $427/mo; built in 1945 — expect roof / HVAC / electrical / plumbing capex.
- Climate carrying-cost: in FEMA flood zone AE (mandatory federal flood insurance); severe wind risk, 99% chance of damaging wind over 30y; extreme-heat days projected 7→24/yr by 2055 (HVAC capex compounding) — expect insurance premiums to compound above CPI over the hold.
Questions for the listing agent
- It's been on market 38 days. Have you received any prior offers? Is the seller open to a 3% concession, seller financing, or rate buy-down credit?
- Built in 1945 — when were the roof, HVAC, electrical panel, plumbing, and water heater last replaced?
- Property tax is high relative to price — has the assessment been appealed recently, and will the sale trigger a re-assessment?
- What's the actual annual flood-insurance premium (NFIP or private), and is the property in a SFHA with mandatory coverage?
- Is there a deadline driving the sale (1031 exchange, divorce, estate, relocation)? That informs how much negotiation room exists.
- Schools are D-rated, which usually means shorter tenancies and higher turnover. Who's the typical renter profile here, and what's been the actual vacancy rate?
- Crime grade is F in this area — have there been break-ins, vandalism, or insurance claims at this property in the last 3 years? What carrier currently insures it and at what premium?
- What's the average days-on-market for RENTAL listings here right now (not sales)? A rising rental-DOM trend means longer vacancies and softer asking-rent achievability than the comps imply.
- What's the recent tenant-quality profile in this submarket — average credit score on applications, eviction rate, late-payment / NSF rate, and stable-employment percentage? A property-management company in the area should have these aggregated.
- How much new for-sale + rental construction is in the pipeline within 1–3 miles? Heavy new supply typically softens prices + rents 12–24 months out; constrained supply supports both.
Investment metrics
- 1% rule
- 1.62% ✓
- Cap rate
- 11.44%
- Cash-on-cash
- 18.39%
- DSCR
- 1.82
- GRM
- 5.2
CMA / ARV
- ARV (median comp)
- $229,078
- List price
- $110,000
- Delta
- -51.98%
- Verdict
- UNDERPRICED
- Comps
- 20 within 1.0 mi
Show comp detail 11 sales within ~0.75 mi
| Address | Dist | Beds/Ba | Sqft | Sold | Price | $/sf | Match |
|---|---|---|---|---|---|---|---|
| 7323 Dallas St | 0.00mi | 4/2.0 | 1,252 (0%) | 1mo | $110,000 | $88 | 99 |
| 7305 Walker St | 0.16mi | 3/2.0 (-1) | 1,365 (+9%) | 13mo | $165,000 | $121 | 62 |
| 7424 Rusk St | 0.23mi | 5/2.0 (+1) | 1,104 (-12%) | 20mo | $205,000 | $186 | 48 |
| 706 72nd St | 0.70mi | 3/2.0 (-1) | 1,300 (+4%) | 9mo | $260,000 | $200 | 48 |
| 7204 Avenue E | 0.55mi | 3/2.0 (-1) | 1,139 (-9%) | 9mo | $234,900 | $206 | 47 |
| 7547 Magnolia St | 0.75mi | 3/1.0 (-1) | 1,207 (-4%) | 4mo | $172,000 | $143 | 47 |
| 1819 Alta Vista St | 0.33mi | 3/1.5 (-1) | 1,166 (-7%) | 23mo | $289,900 | $249 | 47 |
| 7424 Azalea St | 0.66mi | 3/2.0 (-1) | 1,281 (+2%) | 19mo | $239,000 | $187 | 44 |
| 2047 Alta Vista St | 0.65mi | 3/2.0 (-1) | 1,430 (+14%) | 10mo | $349,000 | $244 | 33 |
| 7637 Avenue C | 0.67mi | 3/2.0 (-1) | 1,077 (-14%) | 17mo | $237,000 | $220 | 26 |
| 7432 Azalea St | 0.67mi | 3/3.0 (-1) | 1,436 (+15%) | 15mo | $365,000 | $254 | 23 |
Match score weights: distance 35% · size 25% · config 20% · recency 20%. Top-matched comps best support the ARV.
Projected returns pro-forma
10.0% appreciation · 0.0% rent growth · sell at horizon
- IRR
- 23.9%
- Equity multiple
- 2.88×
- Total profit
- $57,992
- Equity at exit
- $99,097
- IRR
- 20.0%
- Equity multiple
- 6.19×
- Total profit
- $159,960
- Equity at exit
- $213,706
Cash invested: $30,800 (down + closing). Projections, not guarantees.
Landlord ↔ Tenant lean methodology
- Overall (STATE)
- 87 Strongly Landlord-Friendly
- State Texas
- 87 Strongly Landlord-Friendly · R+5
- County
- — inherits STATE
- City
- — inherits STATE
ZIP-level market 77011
- Home prices YoY
- 30.1%
- Rents YoY
- -2.9%
- Active inventory
- 161
- Price-to-rent
- 5.2×
Monthly cashflow live
- Estimated rent
- $1,777 high interval (Pro) →
- Mortgage (P&I)
- −$577
- Tax from tax record
- −$309 /mo · $3,709/yr
- Insurance
- −$46
- Flood insurance flood zone
- −$427 /mo · $5,118/yr
- HOA
- −$0
- Vacancy / Maint / Mgmt
- −$373
- Net cashflow
- $45
Break-even live
Sensitivity live
| Price | -10% $108 | -5% $77 | +0% $45 | +5% $14 | +10% $-17 |
|---|---|---|---|---|---|
| Rent | -10% $-95 | -5% $-25 | +0% $45 | +5% $116 | +10% $186 |
| Rate | -1.0pp $101 | -0.5pp $73 | base $45 | +0.5pp $17 | +1.0pp $-12 |
UW: 25.0% down · 7.5% · 30yr · 1.5% tax · 5.0% vac · 8.0% maint · 8.0% mgmt
Financing live
Cash to close
- Down payment
- $27,500
- Closing costs
- $3,300
- Reserves months
- —
- Total cash needed
- —
Loan-product check · same deal, 3 products live
Conventional
25% down · 7.5% · 30yr
- Down + closing
- —
- Monthly P&I
- —
- Monthly cashflow
- —
- DSCR
- —
- Eligible?
- —
Personal DTI + credit; lowest rate.
DSCR
20% down · 8.5% · 30yr
- Down + closing
- —
- Monthly P&I
- —
- Monthly cashflow
- —
- DSCR
- —
- Eligible?
- —
No personal income docs; deal must DSCR.
Hard money
10% down · 12.0% · 12mo
- Down + closing
- —
- Monthly P&I
- —
- Monthly cashflow
- —
- DSCR
- —
- Eligible?
- —
Short-term bridge; refi at stabilization.
Rent comps 9 comps
| Address | Beds | Baths | Sqft | Rent | $/sqft | DOM | Units | Dist |
|---|---|---|---|---|---|---|---|---|
| 7334 Texas St Houston, TX | 3.0 | 2.0 | 1782 | $2,200 | $1.23 | 44d | 1 | 0.31mi |
| 7250 Avenue C Houston, TX | 1.0–3.0 | 1.0–2.0 | 886 | $1,680 | $1.90 | 1d | 14 | 0.42mi |
| 7310 Sherman St Houston, TX | 1.0–3.0 | 1.0–2.0 | 879 | $1,499 | $1.71 | 3d | 7 | 0.47mi |
| 1016 S Wayside Dr Houston, TX | 3.0 | 2.0 | 1021 | $1,425 | $1.40 | 44d | 1 | 0.75mi |
| 1010 S Wayside Dr #101 Houston, TX | 4.0 | 2.0 | 1400 | $1,199 | $0.86 | 24d | 1 | 0.79mi |
| 1010 S Wayside Dr #101 Houston, TX | 4.0 | 2.0 | 1400 | $1,982 | $1.42 | 44d | 1 | 0.79mi |
| 7043 Avenue L Houston, TX | 3.0 | 2.0 | 999 | $1,845 | $1.85 | 44d | 1 | 0.95mi |
| 916 Redwood St Houston, TX | 3.0 | 1.0 | 1209 | $1,140 | $0.94 | 24d | 1 | 0.98mi |
| 6403 Avenue C Unit 1019625P Houston, TX | 2.0–8.0 | 1.0–4.0 | 1232 | $4,453 | $3.61 | 3d | 2 | 1.15mi |
Listing history 7 events
-
2026-05-09status Pending 508-char remark
Show marketing remark (508 chars)
Calling all investors! This property is a prime opportunity for an investor looking to capitalize on the rapid redevelopment in the East Park subdivision located just minutes from downtown Houston. 7323 Dallas St. sits in an up and coming area where new construction is transforming the neighborhood. Whether you choose a full-scale "to the studs" renovation or prefer to clear the lot to build a modern single-family home or a duplex, there is great potential for ROI. Make your appointment today.
-
2026-05-07price $110,000 508-char remark
Show marketing remark (508 chars)
Calling all investors! This property is a prime opportunity for an investor looking to capitalize on the rapid redevelopment in the East Park subdivision located just minutes from downtown Houston. 7323 Dallas St. sits in an up and coming area where new construction is transforming the neighborhood. Whether you choose a full-scale "to the studs" renovation or prefer to clear the lot to build a modern single-family home or a duplex, there is great potential for ROI. Make your appointment today.
-
2026-05-04status Active 508-char remark
Show marketing remark (508 chars)
Calling all investors! This property is a prime opportunity for an investor looking to capitalize on the rapid redevelopment in the East Park subdivision located just minutes from downtown Houston. 7323 Dallas St. sits in an up and coming area where new construction is transforming the neighborhood. Whether you choose a full-scale "to the studs" renovation or prefer to clear the lot to build a modern single-family home or a duplex, there is great potential for ROI. Make your appointment today.
-
2026-05-04price $120,000 508-char remark
Show marketing remark (508 chars)
Calling all investors! This property is a prime opportunity for an investor looking to capitalize on the rapid redevelopment in the East Park subdivision located just minutes from downtown Houston. 7323 Dallas St. sits in an up and coming area where new construction is transforming the neighborhood. Whether you choose a full-scale "to the studs" renovation or prefer to clear the lot to build a modern single-family home or a duplex, there is great potential for ROI. Make your appointment today.
-
2026-04-29status Pending 508-char remark
Show marketing remark (508 chars)
Calling all investors! This property is a prime opportunity for an investor looking to capitalize on the rapid redevelopment in the East Park subdivision located just minutes from downtown Houston. 7323 Dallas St. sits in an up and coming area where new construction is transforming the neighborhood. Whether you choose a full-scale "to the studs" renovation or prefer to clear the lot to build a modern single-family home or a duplex, there is great potential for ROI. Make your appointment today.
-
2026-04-01$130,000 Active 508-char remark
Show marketing remark (508 chars)
Calling all investors! This property is a prime opportunity for an investor looking to capitalize on the rapid redevelopment in the East Park subdivision located just minutes from downtown Houston. 7323 Dallas St. sits in an up and coming area where new construction is transforming the neighborhood. Whether you choose a full-scale "to the studs" renovation or prefer to clear the lot to build a modern single-family home or a duplex, there is great potential for ROI. Make your appointment today.
-
1990-03-30soldstatus
ⓘ Source: listings_history table (triggers on properties + properties_extension) + one-shot
backfill from property_details.listing_events for pre-trigger history.
Tax reassessment forecast TX · Resets to sale price
- Current annual tax
- $3,709 · $309/mo
- Projected year-2 tax
- $3,709 · $309/mo
- Expected delta
- $0/yr ($0/mo · 0.0%)
ⓘ Screening estimate from a state-policy table — verify with the county assessor before closing.
Climate risk First Street
- Flood 9/10 Extreme FEMA zone AE · 99% chance over 30 yrs
- Wildfire 1/10 Low
- Heat 9/10 Extreme 7 d/yr ≥109°F today · 24 d/yr by 30 yrs out
- Wind 9/10 Extreme 99% chance of damaging wind over 30 yrs
- Air quality 2/10 Low 2 unhealthy d/yr today · 2 by 30 yrs out
Nearby sold comps map
Loading sold comps map…
Walkable amenities ~0.75 mi
Loading nearby amenities…
Taxation est. · year 1
- Rental income
- $21,323
- − Mortgage interest
- −$6,162
- − Property taxes
- −$3,709
- − Insurance
- −$5,668
- − Repairs & maintenance
- −$1,706
- − Management
- −$1,706
- − Depreciation
- −$3,200
- Taxable loss
- −$828
- Est. tax savings @ 24.0%
- +$199
- After-tax cash flow
- $744/yr
For passive investors: Depreciation is non-cash, so a rental often shows a tax loss while cash-flowing — sheltering income. Rental losses are passive: they offset passive income freely, and up to $25,000/yr can offset ordinary (W-2) income if you actively participate and your MAGI is under $100k (phasing out to $0 by $150k); unused losses carry forward. On sale, claimed depreciation is recaptured at up to 25%, and gains may owe capital-gains tax (a 1031 exchange can defer both). Figures are a year-1 estimate at your 24.0% rate — not tax advice; consult a CPA.
Schools (NCES district)
- District
- Houston ISD
- NCES district ID
- 4823640
- Math proficiency
- 27% ▼ -18.00%
- Reading proficiency
- 35% ▼ -6.00%
- Median HH income
- $46,054
- Composite
- 26.63/100
- National rank
- #7173
- State rank
- #593 of 826 in TX
Livability — Houston
- Score
- 74/100
- State rank
- #184
- US rank
- #4771
Category grades
Schools grade is shown separately in the Schools card above.
Census & demographics
- Census place
- Houston, TX
- County
- Harris County · 4,702,590 people
- City population
- 3,226,434
- Metro
- Houston-The Woodlands-Sugar Land, TX
- Population (ZIP)
- 14,940
- Household income
- $50,133
- Rent vs Own
- Severe rent burden
- 655.0
Population outlook (Harris County) Hauer SSP2
- Today (2025)
- 5,571,493 people
- By 2030
- 6,089,821 · +9.3%
- By 2040
- 7,142,806 · +28.2%
- By 2050
- 8,185,864 · +46.9%
- By 2075
- 10,574,329 · +89.8%
- By 2100
- 12,109,958 · +117.4%
Race, ethnicity, and origin ACS 2023
- Neighborhood character
- Predominantly Hispanic (88%)
- Race & ethnicity
- Hispanic / Latino 88% Two or more races 29% White 7% Black 3%
- Hispanic origin (detail)
- Mexican 81%
- Foreign-born
- 33% · Canada
- Languages at home
- 24% English-only · Spanish 76%
Political lean MEDSL · Harris
- 2024 margin
- Lean D (+5.5) · D 52.0% · R 46.4% · Other 1.6%
- 2008→2024 swing
- +3.9pp toward D · 2008: 1.6pp · 2024: 5.5pp
- All cycles
- 2024: D+5.5 2020: D+13.3 2016: D+12.4 2012: D+0.1 2008: D+1.6
Not yet ingested
- Civics
- —
Market trends
- HPI YoY
- ▲ 68.18%
- Current HPI
- 295.1198
- Rent YoY
- ▼ -2.93%
- Metro
- Houston-The Woodlands-Sugar Land, TX
- State GDP YoY
- ▲ 3.95%
- F500 in state
- 110
Industry mix (Fortune 500 HQ in TX)
| Industry | F500 HQs | Revenue |
|---|---|---|
| Energy | 16 | $1,198B |
|
||
| Technology | 5 | $198B |
|
||
| Engineering / Construction | 4 | $72B |
|
||
| Energy Services | 3 | $60B |
|
||
| Utilities | 3 | $41B |
|
||
| Healthcare | 2 | $330B |
|
||
Price history
-15.4% since first listed7 events — show timeline
- 2026-05-09 Pending — HARMLS
- 2026-05-07 Price Changed $110,000 HARMLS
- 2026-05-04 Relisted — HARMLS
- 2026-05-04 Price Changed $120,000 HARMLS
- 2026-04-29 Pending — HARMLS
- 2026-04-01 Listed $130,000 HARMLS
- 1990-03-30 Sold (Public Records) — Public Records
Property tax history
+4.9%/yrLatest (2025): $3,709 · +11.6% YoY. Source: county tax records.
Cash-flow waterfall
monthlySold comps — $/sqft
last 12 mo · ≤1 miLoading sold comps…