 Multi-family
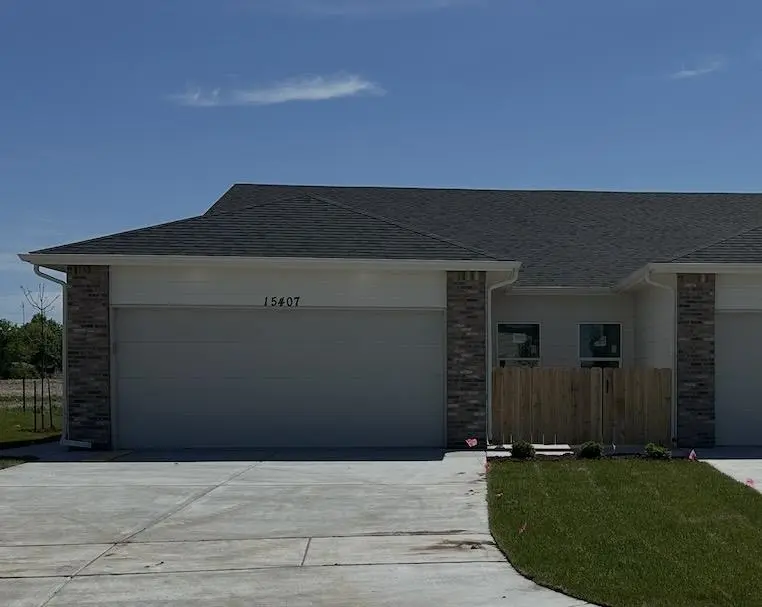
15407 W Josephine St · Wichita, KS
Flood risk 4/10 · Minor
- FEMA flood zone
- X (unshaded)
- Chance of flooding over 30 yrs
- 0.22%
- Est. flood insurance / yr
- $507 – $1,088
Fire risk 1/10 · Minimal
- Est. fire insurance / yr
- $1,154 – $2,142
Heat risk 5/10 · Moderate
- Hot days now (above 105°F)
- 7 days/yr
- Hot days in 30 yrs
- 18 days/yr
Wind risk 2/10 · Minimal
- Chance of severe wind over 30 yrs
- 2.0%
Air-quality risk 2/10 · Minimal
- Unhealthy air days now
- 0 days/yr
- Unhealthy air days in 30 yrs
- 2 days/yr
Risk factors via First Street. Map © Google.
Why this score? — see what drove the B grade
The composite is a weighted blend of 9 inputs, each scored 0–100. Each bar is that input's sub-score; the figure is the points it added to the 100-point composite (weight × sub-score).
- Cash flow +30.0/30.0
- 1% rule +10.0/10.0
- DSCR +10.0/10.0
- ARV discount +7.5/15.0
- Schools +4.4/10.0
- Condition / age +4.0/5.0
- Livability +3.6/5.0
- Rent growth +2.5/5.0
- Appreciation +0.0/10.0
$189,500
🖨 Deal sheet 📄 Offer letter ✓ Due diligence
Multi-family units
County records classify this as Multi-Family (2-4 Unit). Listing-text estimate: 1 unit. estimate disagrees with records
Key facts
- Modern finishes
- Fenced backyard
- Open-concept layout
Tags
Property features AI
Finance
- HOA & community: Has association; Association fee $840 (includes lawn service, recreation facility, general upkeep for common areas); HOA initiation fee $250
Exterior
- Parking: 2-car garage
- Utilities: Public water; Sewer available; Natural gas available
- Home design: Duplex; Single-story
- Construction: Composition roof; No foundation details listed
- Exterior features: Covered patio; Wrought iron fencing; One-level property
Interior
- Kitchen: Dishwasher; Range; Disposal
- Bedrooms: Main-floor laundry in a separate room
- Bathrooms: 2 full bathrooms
- Heating & cooling: Central air (electric); Forced air heating (natural gas)
- Interior features: Dishwasher, Disposal, Range; Electric living room fireplace; Storm windows; No basement
- Laundry & utility: Main-floor laundry in a separate room
Neighborhood map
What this means for you Summary
Snapshot
- This is a 4-bed/2.0-bath multifamily listed at $190k. Condition is rated good.
Deal economics
- At list price, monthly cash flow is $881 ($11k/yr) — positive.
- The deal already cash-flows at list — no discount required.
- Meets the 1% rule at list price ($3k rent vs $190k).
- Recommended offer: $184k (3.0% below list) — sets the bar for market timing.
Location & tenants
- Location reads 72/100 on livability (#100 in KS) — a middle-class / working-renter tenant base. Strengths: amenities A+, cost of living A+, housing A+; Watch: employment D+, crime F, commute F.
- Renwick (rural): math 46% / reading 51% proficiency, ranked #9 of 169 in KS (top 5%) — families likely to look elsewhere, expect single-tenant / working-renter base with shorter leases; only 10% free/reduced lunch — higher-income household profile.
- Zoned schools: St. Marks School (math 57% / reading 67%, grade B, #59 of 684 statewide, top 9%, 315 students, 11% FRL); Andale High (math 27% / reading 32%, grade F, #60 of 327 statewide, top 24%, 375 students, 16% FRL) — zoned schools at 14% FRL track the district average.
- Market conditions: 407 active listings in the ZIP; 9 comparable units currently listed for rent nearby; rentals at typical pace (median 24d on market — plan ~3-4 weeks tenant-placement turnaround); solid renter incomes; 2,613 units permitted in Sedgwick County in 2024 (258 in 5+ unit buildings).
- This rent runs 33% of the median local income ($103k/yr) — at the standard rent-burdened threshold; future hikes will face affordability resistance.
Forward outlook
- Local home prices are declining (-3.0%/yr); year-one equity from $1k of loan paydown is wiped out by about $6k of value loss. Plan a longer hold.
- Sedgwick County population projected at +5% by 2050 — modest demand growth; plan on rents tracking national, not racing it.
- At projected returns (-3.0% appreciation + 3.0% rent growth), your $53k cash investment doubles in ~7 years — after that, you're playing with house money.
Negotiation context
- It's been on market 59 days — a 3% lower offer ($184k) is reasonable based on typical stale-listing flexibility.
Risks & watch-outs
- Climate carrying-cost: extreme-heat days projected 7→18/yr by 2055 (HVAC capex compounding) — expect insurance premiums to compound above CPI over the hold.
Questions for the listing agent
- It's been on market 59 days. Have you received any prior offers? Is the seller open to a 3% concession, seller financing, or rate buy-down credit?
- What does the HOA fee cover, when was the last increase, and are there any pending special assessments or reserve-fund shortfalls?
- Is there a deadline driving the sale (1031 exchange, divorce, estate, relocation)? That informs how much negotiation room exists.
- Schools are F-rated, which usually means shorter tenancies and higher turnover. Who's the typical renter profile here, and what's been the actual vacancy rate?
- Crime grade is F in this area — have there been break-ins, vandalism, or insurance claims at this property in the last 3 years? What carrier currently insures it and at what premium?
- What's the average days-on-market for RENTAL listings here right now (not sales)? A rising rental-DOM trend means longer vacancies and softer asking-rent achievability than the comps imply.
- What's the recent tenant-quality profile in this submarket — average credit score on applications, eviction rate, late-payment / NSF rate, and stable-employment percentage? A property-management company in the area should have these aggregated.
- How much new apartment / multifamily construction is in the pipeline within 1–3 miles? Heavy new supply (>2% of stock underway) typically softens rents 12–24 months out; light construction supports rent growth.
Investment metrics
- 1% rule
- 1.51% ✓
- Cap rate
- 11.87%
- Cash-on-cash
- 19.93%
- DSCR
- 1.89
- GRM
- 5.5
CMA / ARV
No comps found within radius.
Projected returns pro-forma
-3.0% appreciation · 3.0% rent growth · sell at horizon
- IRR
- 12.1%
- Equity multiple
- 1.48×
- Total profit
- $25,515
- Equity at exit
- $28,255
- IRR
- 21.1%
- Equity multiple
- 2.79×
- Total profit
- $94,853
- Equity at exit
- $16,384
Cash invested: $53,060 (down + closing). Projections, not guarantees.
Landlord ↔ Tenant lean methodology
- Overall (STATE)
- 83 Strongly Landlord-Friendly
- State Kansas
- 83 Strongly Landlord-Friendly · R+10
- County
- — inherits STATE
- City
- — inherits STATE
ZIP-level market 67052
- Home prices YoY
- -17.1%
- Active inventory
- 407
- Price-to-rent
- 11.0×
Monthly cashflow live
- Estimated rent
- $2,862 medium interval (Pro) →
- Mortgage (P&I)
- −$994
- Tax est. 1.5%
- −$237 /mo · $2,842/yr
- Insurance
- −$79
- HOA
- −$70
- Vacancy / Maint / Mgmt
- −$601
- Net cashflow
- $881
Break-even live
2-unit breakdown (identical units grouped — click to expand)
| Units | Beds | Baths | Est. rent |
|---|---|---|---|
| 2× units | 2 | 1 | $2,862 |
| #1 | 2 | 1 | $1,431 |
| #2 | 2 | 1 | $1,431 |
| Total (2 units) | $2,862 | ||
UW: 25.0% down · 7.5% · 30yr · 1.5% tax · 5.0% vac · 8.0% maint · 8.0% mgmt
Financing live
Cash to close
- Down payment
- $47,375
- Closing costs
- $5,685
- Reserves months
- —
- Total cash needed
- —
Loan-product check · same deal, 3 products live
Conventional
25% down · 7.5% · 30yr
- Down + closing
- —
- Monthly P&I
- —
- Monthly cashflow
- —
- DSCR
- —
- Eligible?
- —
Personal DTI + credit; lowest rate.
DSCR
20% down · 8.5% · 30yr
- Down + closing
- —
- Monthly P&I
- —
- Monthly cashflow
- —
- DSCR
- —
- Eligible?
- —
No personal income docs; deal must DSCR.
Hard money
10% down · 12.0% · 12mo
- Down + closing
- —
- Monthly P&I
- —
- Monthly cashflow
- —
- DSCR
- —
- Eligible?
- —
Short-term bridge; refi at stabilization.
Rent comps 9 comps
| Address | Beds | Baths | Sqft | Rent | $/sqft | DOM | Units | Dist |
|---|---|---|---|---|---|---|---|---|
| 2021 N Melody Ln , KS | 5.0 | 2.0 | 1503 | $1,695 | $1.13 | 23d | 1 | 0.12mi |
| 15214 W Kristina St Goddard, KS | 4.0 | 2.0 | 1433 | $1,600 | $1.12 | 23d | 1 | 0.15mi |
| 2174 N Melody Ct Goddard, KS | 5.0 | 2.0 | 1503 | $1,695 | $1.13 | 23d | 1 | 0.17mi |
| 15800 W 21st St N Goddard, KS | 3.0–5.0 | 2.0–3.0 | 1379 | $1,675 | $1.21 | 14d | 1 | 0.23mi |
| 2054 N Reece St Goddard, KS | 3.0 | 2.0 | 1280 | $1,550 | $1.21 | 14d | 1 | 0.24mi |
| 2155 N Reece St Unit 2157 Reece Goddard, KS | 3.0 | 2.0 | 1200 | $1,395 | $1.16 | 23d | 1 | 0.26mi |
| 2113 N Reece St Unit 2115 Reece Goddard, KS | 3.0 | 2.0 | 1275 | $1,425 | $1.12 | 23d | 1 | 0.26mi |
| 2119 N Reece St Unit 2119 Reece Goddard, KS | 3.0 | 2.0 | 1275 | $1,425 | $1.12 | 23d | 1 | 0.27mi |
| 13625 W Nantucket St Wichita, KS | 3.0 | 2.0 | 1100 | $1,395 | $1.27 | 21d | 1 | 1.26mi |
HOA detail
- Monthly dues
- $70 · $840/yr
Listing history 16 events
-
2026-06-18days on market $189,500 Active 59 DOM
-
2026-06-17days on market $189,500 Active 58 DOM
-
2026-06-16days on market $189,500 Active 57 DOM
-
2026-06-15days on market $189,500 Active 56 DOM
-
2026-06-14days on market $189,500 Active 54 DOM
-
2026-06-10days on market $189,500 Active 51 DOM
-
2026-06-09days on market $189,500 Active 50 DOM
-
2026-06-08days on market $189,500 Active 49 DOM
-
2026-06-07days on market $189,500 Active 48 DOM
-
2026-06-05days on market $189,500 Active 45 DOM
-
2026-06-03days on market $189,500 Active 44 DOM
-
2026-06-02days on market $189,500 Active 43 DOM
-
2026-06-01days on market $189,500 Active 42 DOM
-
2026-05-31days on market $189,500 Active 41 DOM
-
2026-05-30days on market $189,500 Active 40 DOM
-
2026-04-17$189,500 Active
ⓘ Source: listings_history table (triggers on properties + properties_extension) + one-shot
backfill from property_details.listing_events for pre-trigger history.
Climate risk First Street
- Flood 4/10 Moderate FEMA zone X (unshaded) · 22% chance over 30 yrs
- Wildfire 1/10 Low
- Heat 5/10 Major 7 d/yr ≥105°F today · 18 d/yr by 30 yrs out
- Wind 2/10 Low 2% chance of damaging wind over 30 yrs
- Air quality 2/10 Low 0 unhealthy d/yr today · 2 by 30 yrs out
Nearby sold comps map
Loading sold comps map…
Walkable amenities ~0.75 mi
Loading nearby amenities…
Taxation est. · year 1
- Rental income
- $34,344
- − Mortgage interest
- −$10,615
- − Property taxes
- −$2,842
- − Insurance
- −$948
- − Repairs & maintenance
- −$2,748
- − Management
- −$2,748
- − HOA
- −$840
- − Depreciation
- −$5,513
- Taxable income
- $8,091
- Est. tax owed @ 24.0%
- −$1,942
- After-tax cash flow
- $8,635/yr
For passive investors: Depreciation is non-cash, so a rental often shows a tax loss while cash-flowing — sheltering income. Rental losses are passive: they offset passive income freely, and up to $25,000/yr can offset ordinary (W-2) income if you actively participate and your MAGI is under $100k (phasing out to $0 by $150k); unused losses carry forward. On sale, claimed depreciation is recaptured at up to 25%, and gains may owe capital-gains tax (a 1031 exchange can defer both). Figures are a year-1 estimate at your 24.0% rate — not tax advice; consult a CPA.
Condition & rehab AI · 9 photos
This multi-family home is in excellent condition with new finishes and systems, making it move-in ready for both resale and rental markets.
Value-add opportunities
- Both Painting exterior and interior walls — Fresh paint enhances curb appeal and interior aesthetics
- Both Landscaping and curb appeal improvements — Enhances curb appeal and can attract more buyers
- Both New flooring in bathrooms — New flooring can improve the look and feel of the bathrooms
- Both New lighting fixtures throughout — New lighting can improve the ambiance and energy efficiency of the home
Renovation cost estimate screening
Value-add ROI direction
- Both Painting exterior and interior walls — Fresh paint enhances curb appeal and interior aesthetics ↑
- Both Landscaping and curb appeal improvements — Enhances curb appeal and can attract more buyers ↑
- Both New flooring in bathrooms — New flooring can improve the look and feel of the bathrooms ↑
- Both New lighting fixtures throughout — New lighting can improve the ambiance and energy efficiency of the home ↑
ⓘ Cost ranges are severity-bucket heuristics (US national rule-of-thumb). Get contractor quotes + a written scope before underwriting a rehab budget.
Schools (NCES district)
- District
- Renwick
- NCES district ID
- 2011080
- Math proficiency
- 46% ▼ -7.00%
- Reading proficiency
- 51% ▲ 3.00%
- Median HH income
- $76,876
- Composite
- 44.1/100
- National rank
- #2869
- State rank
- #9 of 169 in KS
Livability — Wichita
- Score
- 72/100
- State rank
- #100
- US rank
- #5730
Category grades
Schools grade is shown separately in the Schools card above.
Census & demographics
- County
- Sedgwick County · 432,957 people
- City population
- 365,168
- Metro
- Wichita, KS
- Population (ZIP)
- 9,262
- Household income
- $103,148
- Rent vs Own
- Severe rent burden
- 43.0
Population outlook (Sedgwick County) Hauer SSP2
- Today (2025)
- 537,014 people
- By 2030
- 546,984 · +1.9%
- By 2040
- 559,141 · +4.1%
- By 2050
- 562,027 · +4.7%
- By 2075
- 557,255 · +3.8%
- By 2100
- 513,383 · -4.4%
Race, ethnicity, and origin ACS 2023
- Neighborhood character
- Predominantly White (88%)
- Race & ethnicity
- White 88% Hispanic / Latino 8% Two or more races 6%
- Hispanic origin (detail)
- Mexican 6%
- Common ancestry
- Iranian 2% Romanian 2% Lithuanian 2%
- Foreign-born
- 1% · China, Canada
- Languages at home
- 95% English-only · Spanish 4%
Political lean MEDSL · Sedgwick
- 2024 margin
- R (+13.8) · D 42.3% · R 56.1% · Other 1.6%
- 2008→2024 swing
- -1.1pp toward R · 2008: -12.7pp · 2024: -13.8pp
- All cycles
- 2024: R+13.8 2020: R+12.6 2016: R+19.1 2012: R+19.7 2008: R+12.7
Not yet ingested
- Civics
- —
Market trends
- HPI YoY
- ▼ -54.44%
- Current HPI
- 264.1893
- Rent YoY
- —
- Metro
- Wichita, KS
- State GDP YoY
- —
- F500 in state
- 0
Price history
1 event — show timeline
- 2026-04-17 Listed $189,500 SCKMLS as Distributed by MLS Grid
Cash-flow waterfall
monthlySold comps — $/sqft
last 12 mo · ≤1 miLoading sold comps…