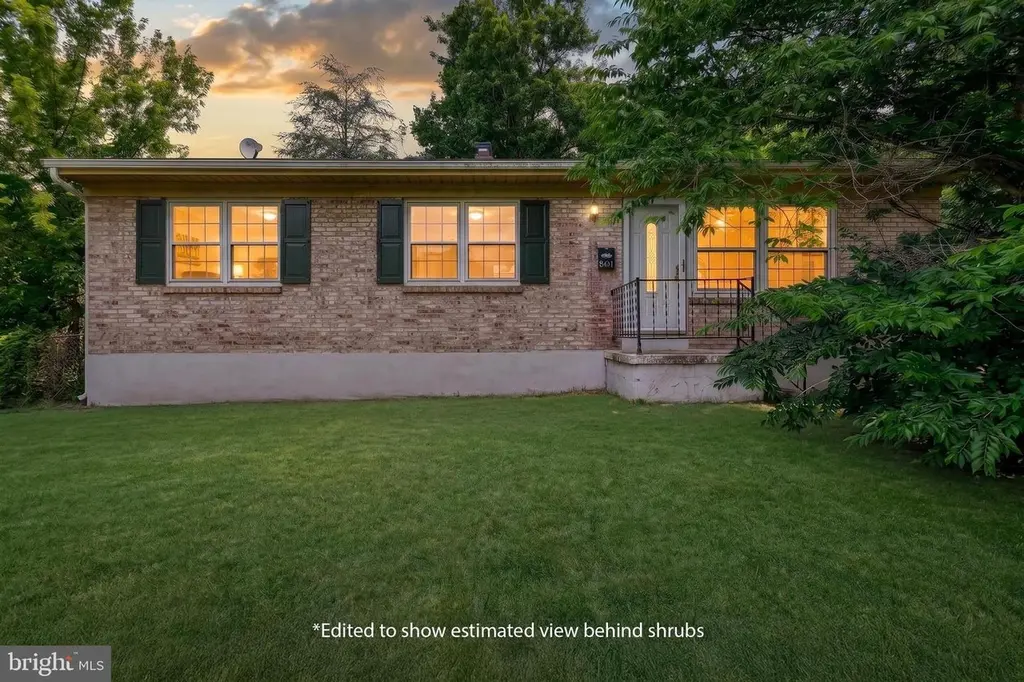
861 W Foxcroft Dr · Wormleysburg, PA
Flood risk 1/10 · Minimal
- FEMA flood zone
- X (unshaded)
- Chance of flooding over 30 yrs
- 0.0%
- Est. flood insurance / yr
- $507 – $1,088
Fire risk 1/10 · Minimal
- Est. fire insurance / yr
- $511 – $949
Heat risk 5/10 · Moderate
- Hot days now (above 100°F)
- 7 days/yr
- Hot days in 30 yrs
- 15 days/yr
Wind risk 3/10 · Minor
- Chance of severe wind over 30 yrs
- 5.0%
Air-quality risk 2/10 · Minimal
- Unhealthy air days now
- 1 days/yr
- Unhealthy air days in 30 yrs
- 3 days/yr
Risk factors via First Street. Map © Google.
Why this score? — see what drove the D+ grade
The composite is a weighted blend of 9 inputs, each scored 0–100. Each bar is that input's sub-score; the figure is the points it added to the 100-point composite (weight × sub-score).
- ARV discount +15.0/15.0
- Cash flow +12.7/30.0
- Schools +4.1/10.0
- Rent growth +4.0/5.0
- Livability +4.0/5.0
- 1% rule +3.8/10.0
- DSCR +3.8/10.0
- Condition / age +2.5/5.0
- Appreciation +0.0/10.0
$199,900
🖨 Deal sheet (PDF) 📄 Offer letter ✓ Due diligence
Listing remarks MLS
Adorable ranch that is brick on all sides. Great schools and neighborhood. Home has been freshly painted with crown molding throughout. Recent upgrades include: central Air, refinished hardwood floors, new ceramic tiles in kitchen, new kitchen sink and counter-tops, finished basement that includes lifetime waterproofing warranty. Plenty of room to add extra bathroom in the basement.
Key facts
- 0.24 acre lot
- Built 1960
- Listed 4 days
Property features AI
Finance
- Other: Fee simple ownership; Accessibility with multiple access/exit points; Estimated above-grade and below-grade finished area (above grade approx. 1,107; below grade approx. 550)
Exterior
- Parking: Off-street parking via driveway
- Utilities: Public water; Public sewer; 200+ amp electric service; Electric hot water
- Home design: Detached structure; Estimated year built; Composite roof; Block foundation
- Construction: Brick and frame construction; Fully finished basement (below grade)
- Exterior features: Not in a federal flood zone; Above- and below-grade finished living areas
Interior
- Kitchen: Microwave; Garbage disposal; Refrigerator; Electric range/oven
- Bedrooms: Three bedrooms on the second/upper level; Multiple bedrooms including master bedroom, den, office (see room list)
- Bathrooms: Two full bathrooms (one on main level, one on second/upper level)
- Interior features: Dining area; Fully finished basement with full height
- Laundry & utility: Laundry room
Neighborhood map
What this means for you Summary
Snapshot
- This is a 3-bed/1.0-bath single-family listed at $200k.
Deal economics
- At list price, monthly cash flow is $-21 ($-253/yr) — negative.
- To cash-flow at today's rent, offer at most $196k (1.9% below list).
- To meet the 1% rule (rent ≥ 1% of price), the offer needs to be $176k (12.0% below list).
- Recommended offer: $176k (12.0% below list) — sets the bar for 1% rule.
Location & tenants
- Location reads 79/100 on livability (#268 in PA, #2,349 nationally) — a middle-class / working-renter tenant base. Strengths: crime A+, cost of living A+, housing A+; Watch: amenities D, commute F.
- West Shore SD (suburban): math 37% / reading 56% proficiency, ranked #222 of 539 in PA (top 41%) — families likely to look elsewhere, expect single-tenant / working-renter base with shorter leases.
- Zoned schools: Washington Heights El Sch (math 27% / reading 37%, grade F, #1,094 of 1,518 statewide, top 73%, 392 students, 63% FRL); New Cumberland Ms (math 17% / reading 49%, grade F, #346 of 512 statewide, top 69%, 549 students, 49% FRL); Cedar Cliff Hs (math 56% / reading 24%, grade F, #263 of 437 statewide, top 60%, 1,353 students, 39% FRL) — zoned schools average 50% FRL vs 25% district-wide (25 pts higher); higher-poverty schools than district average — tighter screening recommended.
- Market conditions: Rents rising fast (+6.1%/yr); 148 active listings in the ZIP; 7 comparable units currently listed for rent nearby; rentals lingering (median 46d on market — plan ~5-8 weeks vacancy on turnover, expect pricing pressure); 57% of comp listings sitting > 30 days — soft ceiling on asking rent; solid renter incomes; 1,052 units permitted in Cumberland County in 2024 (310 in 5+ unit buildings).
Forward outlook
- Local home prices are declining (-3.0%/yr); year-one equity from $1k of loan paydown is wiped out by about $6k of value loss. Plan a longer hold.
- Cumberland County population projected at +17% by 2050 — long-run rental-demand tailwind backs the buy-and-hold thesis.
Negotiation context
- Only 4 days on market — expect competitive offers; lowballing is unlikely to land.
- 3 sale attempts since 19y ago with the ask held roughly flat each time — persistent listings suggest the price (not the market) is what's stuck; bring a comps-based counter.
- Current owner paid $153k; 31% above their basis — modest negotiation headroom, anchor on the comps not their cost.
Risks & watch-outs
- Climate carrying-cost: extreme-heat days projected 7→15/yr by 2055 (HVAC capex compounding) — expect insurance premiums to compound above CPI over the hold.
Questions for the listing agent
- What do current leases actually rent for vs. the listed asking? Can we see a recent rent roll and the last 12 months of T-12 income?
- Built in 1960 — when were the roof, HVAC, electrical panel, plumbing, and water heater last replaced?
- Is there a deadline driving the sale (1031 exchange, divorce, estate, relocation)? That informs how much negotiation room exists.
- The area grade is low — what's the realistic commute time and amenity access for the typical tenant pool here? Any planned neighborhood developments (good or bad) we should know about?
- What's the average days-on-market for RENTAL listings here right now (not sales)? A rising rental-DOM trend means longer vacancies and softer asking-rent achievability than the comps imply.
- What's the recent tenant-quality profile in this submarket — average credit score on applications, eviction rate, late-payment / NSF rate, and stable-employment percentage? A property-management company in the area should have these aggregated.
- How much new for-sale + rental construction is in the pipeline within 1–3 miles? Heavy new supply typically softens prices + rents 12–24 months out; constrained supply supports both.
Investment metrics
- 1% rule
- 0.88% ✗
- Cap rate
- 6.17%
- Cash-on-cash
- -0.45%
- DSCR
- 0.98
- GRM
- 9.5
CMA / ARV
- ARV (on-the-fly)
- $295,830
- Comps found
- 12
Show comp detail 12 sales within ~0.75 mi
| Address | Dist | Beds/Ba | Sqft | Sold | Price | $/sf | Match |
|---|---|---|---|---|---|---|---|
| 531 Rupley Rd | 0.09mi | 3/1.5 | 1,620 (+4%) | 4mo | $287,500 | $177 | 83 |
| 510 Echo Rd | 0.12mi | 3/2.5 | 1,695 (+9%) | 7mo | $319,900 | $189 | 68 |
| 901 W Foxcroft Dr | 0.03mi | 3/1.5 | 1,760 (+13%) | 10mo | $310,000 | $176 | 67 |
| 832 Yverdon Dr | 0.13mi | 3/2.0 | 1,700 (+9%) | 11mo | $310,000 | $182 | 65 |
| 12 Shady Rd | 0.50mi | 3/3.0 | 1,550 (-0%) | 5mo | $385,000 | $248 | 64 |
| 51 Burd Dr | 0.30mi | 4/2.0 (+1) | 1,675 (+8%) | 2mo | $365,000 | $218 | 63 |
| 58 Burd Dr | 0.36mi | 3/2.0 | 1,724 (+11%) | 2mo | $327,000 | $190 | 60 |
| 817 Yverdon Dr | 0.19mi | 3/2.0 | 1,650 (+6%) | 21mo | $336,150 | $204 | 60 |
| 5 Arnold St | 0.27mi | 3/3.0 | 1,619 (+4%) | 18mo | $314,900 | $195 | 58 |
| 531 N 2nd St | 0.56mi | 3/2.0 | 1,459 (-6%) | 16mo | $200,000 | $137 | 46 |
| 6 Stephen Rd | 0.75mi | 3/1.5 | 1,782 (+14%) | 1mo | $285,000 | $160 | 38 |
| 312 Glenn Rd | 0.66mi | 4/1.5 (+1) | 1,720 (+10%) | 9mo | $335,000 | $195 | 37 |
Match score weights: distance 35% · size 25% · config 20% · recency 20%. Top-matched comps best support the ARV.
Projected returns pro-forma
-3.0% appreciation · 6.14% rent growth · sell at horizon
- IRR
- -13.5%
- Equity multiple
- 0.50×
- Total profit
- $-27,959
- Equity at exit
- $29,806
- IRR
- -0.2%
- Equity multiple
- 0.99×
- Total profit
- $-803
- Equity at exit
- $17,284
Cash invested: $55,972 (down + closing). Projections, not guarantees.
Landlord ↔ Tenant lean methodology
- Overall (STATE)
- 62 Landlord-Friendly
- State Pennsylvania
- 62 Landlord-Friendly · EVEN
- County
- — inherits STATE
- City
- — inherits STATE
ZIP-level market 17011
- Rents YoY
- 6.1%
- Active inventory
- 148
- Price-to-rent
- 9.5×
Monthly cashflow live
- Estimated rent
- $1,759 high interval (Pro) →
- Mortgage (P&I)
- −$1,048
- Tax from tax record
- −$279 /mo · $3,351/yr
- Insurance
- −$83
- HOA
- −$0
- Vacancy / Maint / Mgmt
- −$369
- Net cashflow
- $-21
Break-even live
Sensitivity live
| Price | -10% $92 | -5% $35 | +0% $-21 | +5% $-78 | +10% $-134 |
|---|---|---|---|---|---|
| Rent | -10% $-160 | -5% $-91 | +0% $-21 | +5% $48 | +10% $118 |
| Rate | -1.0pp $80 | -0.5pp $30 | base $-21 | +0.5pp $-73 | +1.0pp $-126 |
UW: 25.0% down · 7.5% · 30yr · 1.5% tax · 5.0% vac · 8.0% maint · 8.0% mgmt
Financing live
Cash to close
- Down payment
- $49,975
- Closing costs
- $5,997
- Reserves months
- —
- Total cash needed
- —
Loan-product check · same deal, 3 products live
Conventional
25% down · 7.5% · 30yr
- Down + closing
- —
- Monthly P&I
- —
- Monthly cashflow
- —
- DSCR
- —
- Eligible?
- —
Personal DTI + credit; lowest rate.
DSCR
20% down · 8.5% · 30yr
- Down + closing
- —
- Monthly P&I
- —
- Monthly cashflow
- —
- DSCR
- —
- Eligible?
- —
No personal income docs; deal must DSCR.
Hard money
10% down · 12.0% · 12mo
- Down + closing
- —
- Monthly P&I
- —
- Monthly cashflow
- —
- DSCR
- —
- Eligible?
- —
Short-term bridge; refi at stabilization.
Rent comps 7 comps
| Address | Beds | Baths | Sqft | Rent | $/sqft | DOM | Units | Dist |
|---|---|---|---|---|---|---|---|---|
| 400 W Crestwood Dr Camp Hill, PA | 1.0–3.0 | 1.0–2.0 | 1042 | $2,071 | $1.99 | 16d | 14 | 0.36mi |
| 20 House Ave Camp Hill, PA | 2.0 | 2.0 | 1243 | $1,720 | $1.38 | 16d | 2 | 0.47mi |
| 616 N Front St Lemoyne, PA | 3.0 | 1.0 | 1408 | $1,650 | $1.17 | 45d | 1 | 0.52mi |
| 1320 Penn St Harrisburg, PA | 2.0 | 1.0 | 1193 | $1,495 | $1.25 | 45d | 1 | 1.42mi |
| 1008 N 2nd St Unit 2 Harrisburg, PA | 2.0 | 1.0 | 1410 | $1,295 | $0.92 | 45d | 1 | 1.42mi |
| 1202 Penn St Harrisburg, PA | 4.0 | 1.0 | 1706 | $1,495 | $0.88 | 45d | 1 | 1.44mi |
| 1834 Green St Harrisburg, PA | 4.0 | 1.0 | 1792 | $1,495 | $0.83 | 25d | 1 | 1.45mi |
Listing history 4 events
-
2026-06-15status $199,900 Pending 4 DOM
-
2026-06-15days on market $199,900 Active 4 DOM
-
2026-06-14remarks 218-char remark
-
2026-06-14$199,900 Active 2 DOM
ⓘ Source: listings_history table (triggers on properties + properties_extension) + one-shot
backfill from property_details.listing_events for pre-trigger history.
Tax reassessment forecast PA · Partial reset (capped growth)
- Current annual tax
- $3,351 · $279/mo
- Projected year-2 tax
- $3,351 · $279/mo
- Expected delta
- $0/yr ($0/mo · -0.0%)
ⓘ Screening estimate from a state-policy table — verify with the county assessor before closing.
Climate risk First Street
- Flood 1/10 Low FEMA zone X (unshaded) · 0% chance over 30 yrs
- Wildfire 1/10 Low
- Heat 5/10 Major 7 d/yr ≥100°F today · 15 d/yr by 30 yrs out
- Wind 3/10 Moderate 5% chance of damaging wind over 30 yrs
- Air quality 2/10 Low 1 unhealthy d/yr today · 3 by 30 yrs out
Nearby sold comps map
Loading sold comps map…
Walkable amenities ~0.75 mi
Loading nearby amenities…
Taxation est. · year 1
- Rental income
- $21,110
- − Mortgage interest
- −$11,198
- − Property taxes
- −$3,351
- − Insurance
- −$1,000
- − Repairs & maintenance
- −$1,689
- − Management
- −$1,689
- − Depreciation
- −$5,815
- Taxable loss
- −$3,631
- Est. tax savings @ 24.0%
- +$871
- After-tax cash flow
- $618/yr
For passive investors: Depreciation is non-cash, so a rental often shows a tax loss while cash-flowing — sheltering income. Rental losses are passive: they offset passive income freely, and up to $25,000/yr can offset ordinary (W-2) income if you actively participate and your MAGI is under $100k (phasing out to $0 by $150k); unused losses carry forward. On sale, claimed depreciation is recaptured at up to 25%, and gains may owe capital-gains tax (a 1031 exchange can defer both). Figures are a year-1 estimate at your 24.0% rate — not tax advice; consult a CPA.
Schools (NCES district)
- District
- West Shore SD
- NCES district ID
- 4225830
- Math proficiency
- 37% ▼ -12.00%
- Reading proficiency
- 56% ▼ -10.00%
- Median HH income
- $61,398
- Composite
- 40.9/100
- National rank
- #3617
- State rank
- #222 of 539 in PA
Livability — Wormleysburg
- Score
- 79/100
- State rank
- #268
- US rank
- #2349
Category grades
Schools grade is shown separately in the Schools card above.
Census & demographics
- Census place
- Wormleysburg, PA
- County
- Cumberland County · 257,673 people
- Metro
- Harrisburg-Carlisle, PA
- Population (ZIP)
- 39,664
- Household income
- $92,556
- Rent vs Own
- Severe rent burden
- 858.0
Population outlook (Cumberland County) Hauer SSP2
- Today (2025)
- 267,950 people
- By 2030
- 278,105 · +3.8%
- By 2040
- 296,552 · +10.7%
- By 2050
- 312,937 · +16.8%
- By 2075
- 349,233 · +30.3%
- By 2100
- 361,875 · +35.1%
Race, ethnicity, and origin ACS 2023
- Neighborhood character
- Predominantly White (74%)
- Race & ethnicity
- White 74% Black 8% Hispanic / Latino 7% Two or more races 6% Asian 6%
- Hispanic origin (detail)
- Mexican 2% Puerto Rican 2%
- Common ancestry
- Italian 3% Romanian 3% Lithuanian 3%
- Foreign-born
- 9% · Canada, Vietnam, China
- Languages at home
- 88% English-only · Spanish 4% Other Asian/Pacific 2% Other Indo-European 1%
Political lean MEDSL · Cumberland
- 2024 margin
- Lean R (+9.4) · D 44.6% · R 54.1% · Other 1.3%
- 2008→2024 swing
- +4.2pp toward D · 2008: -13.6pp · 2024: -9.4pp
- All cycles
- 2024: R+9.4 2020: R+10.6 2016: R+18.6 2012: R+18.5 2008: R+13.6
Not yet ingested
- Civics
- —
Market trends
- HPI YoY
- ▼ -232.65%
- Current HPI
- 254.4755
- Rent YoY
- ▲ 6.14%
- Metro
- Harrisburg-Carlisle, PA
- State GDP YoY
- ▲ 1.68%
- F500 in state
- 34
Industry mix (Fortune 500 HQ in PA)
| Industry | F500 HQs | Revenue |
|---|---|---|
| Healthcare | 2 | $309B |
|
||
| Insurance | 2 | $27B |
|
||
| Telecommunications / Media | 1 | $124B |
|
||
| Industrial Distribution | 1 | $22B |
|
||
| Financial Services | 1 | $20B |
|
||
| Chemicals / Materials | 1 | $18B |
|
||
Price history
+139.4% since first listed9 events — show timeline
- 2026-06-11 Listed $199,900 BRIGHT MLS
- 2015-06-12 Sold (Public Records) $153,000 Public Records
- 2015-06-12 Sold (MLS) $153,000 BRIGHT MLS
- 2015-03-31 Listed $153,000 BRIGHT MLS
- 2007-09-25 Sold (Public Records) $157,000 Public Records
- 2007-09-21 Sold (MLS) $157,000 BRIGHT MLS
- 2007-07-23 Listing Removed — BRIGHT MLS
- 2007-07-23 Listed $154,900 BRIGHT MLS
- 1990-06-11 Sold (Public Records) $83,500 Public Records
Property tax history
+4.0%/yrLatest (2026): $3,351 · +7.9% YoY. Source: county tax records.
Cash-flow waterfall
monthlySold comps — $/sqft
last 12 mo · ≤1 miLoading sold comps…