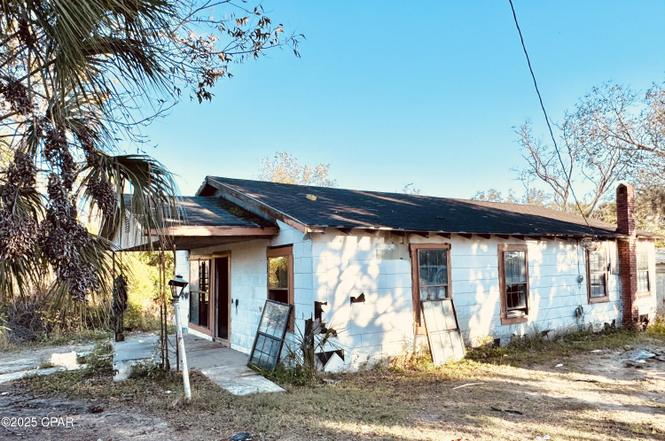
861 8th Ave · Graceville, FL
Flood risk 1/10 · Minimal
- FEMA flood zone
- X (unshaded)
- Chance of flooding over 30 yrs
- 0.0%
- Est. flood insurance / yr
- $507 – $1,088
Fire risk 5/10 · Moderate
- Est. fire insurance / yr
- $947 – $1,759
Heat risk 8/10 · Major
- Hot days now (above 107°F)
- 7 days/yr
- Hot days in 30 yrs
- 19 days/yr
Wind risk 8/10 · Major
- Chance of severe wind over 30 yrs
- 99.0%
Air-quality risk 3/10 · Minor
- Unhealthy air days now
- 3 days/yr
- Unhealthy air days in 30 yrs
- 4 days/yr
Risk factors via First Street. Map © Google.
Why this score? — see what drove the B+ grade
The composite is a weighted blend of 9 inputs, each scored 0–100. Each bar is that input's sub-score; the figure is the points it added to the 100-point composite (weight × sub-score).
- Cash flow +30.0/30.0
- ARV discount +13.3/15.0
- 1% rule +10.0/10.0
- DSCR +10.0/10.0
- Schools +4.2/10.0
- Livability +3.4/5.0
- Rent growth +2.5/5.0
- Condition / age +2.5/5.0
- Appreciation +0.0/10.0
$45,000
🖨 Deal sheet 📄 Offer letter ✓ Due diligence
Listing remarks
🔥 FIXER-UPPER OPPORTUNITY IN GRACEVILLE, FL! 🔥 Bring ALL offers! This 1950s 4 bedroom, 1 bathroom home sits on a spacious double lot right on the corner of 8th Ave—centrally located in town and surrounded by the charm of Florida's Panhandle. Just 1 hour to Panama City, FL, 30 minutes to Dothan, AL, and only 10 minutes to Highway 231 for easy commuting. Inside, this wood frame home offers original pine wood paneling on the walls, ceilings, and floors with tons of character—perfect for buyers looking to restore or redesign a classic southern home. The interior showcases large windows that bring in natural light, rustic wood tones, and a layout with great renovation potential. T
Key facts
- 0.32 acre lot
- Built 1950
- Listed 172 days
Property features AI
Finance
- HOA & community: Short-term rentals allowed
Exterior
- Utilities: Sewer available
- Home design: Single-story property
- Construction: Wood frame construction; Shingle/composition roof; Pillar/post/pier foundation; Zoned for single-family residential
- Exterior features: Open porch/patio; Paved lot; City street frontage; Publicly maintained road
Interior
- Kitchen: Kitchen — approx. 15 x 13
- Bedrooms: Bedroom (first floor) — approx. 15 x 12
- Bathrooms: 1 full bathroom
- Interior features: Total of 3 rooms; Living room on the first floor; Bedroom on the first floor; Kitchen on the first floor
Neighborhood map
What this means for you Summary
Snapshot
- This is a 2-bed/1.0-bath single-family listed at $45k.
Deal economics
- At list price, monthly cash flow is $527 ($6k/yr) — positive.
- The deal already cash-flows at list — no discount required.
- Meets the 1% rule at list price ($1k rent vs $45k).
- Recommended offer: $40k (12.0% below list) — sets the bar for market timing.
Location & tenants
- Location reads 68/100 on livability (#528 in FL) — a middle-class / working-renter tenant base. Strengths: crime A+, cost of living A+, health & safety A+; Watch: schools D, amenities F, commute F.
- Jackson (rural): math 47% / reading 54% proficiency, ranked #39 of 73 in FL (top 53%) — acceptable for families but not a draw, mixed tenant base, ~2y average lease.
- Market conditions: 62 active listings in the ZIP; 1 comparable units currently listed for rent nearby; 153 units permitted in Jackson County in 2024 (40 in 5+ unit buildings).
Forward outlook
- Local home prices are declining (-3.0%/yr); year-one equity from $311 of loan paydown is wiped out by about $1k of value loss. Plan a longer hold.
- Jackson County population projected at -18% by 2050 — secular population decline; favor cash flow + early exit over multi-decade hold.
- At projected returns (-3.0% appreciation + 3.0% rent growth), your $13k cash investment doubles in ~3 years — after that, you're playing with house money.
Negotiation context
- It's been on market 173 days — a 12% lower offer ($40k) is reasonable based on typical stale-listing flexibility.
- 2 sale attempts; this cycle's ask has dropped $15k (25%) from the opening price — seller is motivated, your offer sets the floor, not the list.
Risks & watch-outs
- Watch-outs: built in 1950 — expect roof / HVAC / electrical / plumbing capex.
- Climate carrying-cost: severe wind risk, 99% chance of damaging wind over 30y; moderate wildfire risk; extreme-heat days projected 7→19/yr by 2055 (HVAC capex compounding) — expect insurance premiums to compound above CPI over the hold.
Questions for the listing agent
- It's been on market 173 days. Have you received any prior offers? Is the seller open to a 12% concession, seller financing, or rate buy-down credit?
- Built in 1950 — when were the roof, HVAC, electrical panel, plumbing, and water heater last replaced?
- Why hasn't it sold? Are there any deal-killer items the seller is aware of (foundation, flood, title, zoning, code violations)?
- Is there a deadline driving the sale (1031 exchange, divorce, estate, relocation)? That informs how much negotiation room exists.
- Schools are D-rated, which usually means shorter tenancies and higher turnover. Who's the typical renter profile here, and what's been the actual vacancy rate?
- What's the average days-on-market for RENTAL listings here right now (not sales)? A rising rental-DOM trend means longer vacancies and softer asking-rent achievability than the comps imply.
- What's the recent tenant-quality profile in this submarket — average credit score on applications, eviction rate, late-payment / NSF rate, and stable-employment percentage? A property-management company in the area should have these aggregated.
- How much new for-sale + rental construction is in the pipeline within 1–3 miles? Heavy new supply typically softens prices + rents 12–24 months out; constrained supply supports both.
Investment metrics
- 1% rule
- 2.42% ✓
- Cap rate
- 20.34%
- Cash-on-cash
- 50.16%
- DSCR
- 3.23
- GRM
- 3.4
CMA / ARV
- ARV (on-the-fly)
- $51,660
- Comps found
- 3
Show comp detail 3 sales within ~0.75 mi
| Address | Dist | Beds/Ba | Sqft | Sold | Price | $/sf | Match |
|---|---|---|---|---|---|---|---|
| 914 8th Ave | 0.27mi | 3/1.0 (+1) | 1,247 (-1%) | 6mo | $14,000 | $11 | 75 |
| 5290 Alabama St | 0.57mi | 3/1.0 (+1) | 1,307 (+4%) | 6mo | $97,000 | $74 | 57 |
| 5276 Alabama St | 0.60mi | 3/1.0 (+1) | 1,107 (-12%) | 16mo | $45,500 | $41 | 34 |
Match score weights: distance 35% · size 25% · config 20% · recency 20%. Top-matched comps best support the ARV.
Projected returns pro-forma
-3.0% appreciation · 3.0% rent growth · sell at horizon
- IRR
- 47.9%
- Equity multiple
- 3.09×
- Total profit
- $26,280
- Equity at exit
- $6,710
- IRR
- 53.6%
- Equity multiple
- 6.25×
- Total profit
- $66,198
- Equity at exit
- $3,891
Cash invested: $12,600 (down + closing). Projections, not guarantees.
Landlord ↔ Tenant lean methodology
- Overall (STATE)
- 87 Strongly Landlord-Friendly
- State Florida
- 87 Strongly Landlord-Friendly · R+3
- County
- — inherits STATE
- City
- — inherits STATE
ZIP-level market 32440
- Home prices YoY
- -19.4%
- Active inventory
- 62
- Price-to-rent
- 3.4×
Monthly cashflow live
- Estimated rent
- $1,089 medium interval (Pro) →
- Mortgage (P&I)
- −$236
- Tax from tax record
- −$79 /mo · $947/yr
- Insurance
- −$19
- HOA
- −$0
- Vacancy / Maint / Mgmt
- −$229
- Net cashflow
- $527
Break-even live
UW: 25.0% down · 7.5% · 30yr · 1.5% tax · 5.0% vac · 8.0% maint · 8.0% mgmt
Financing live
Cash to close
- Down payment
- $11,250
- Closing costs
- $1,350
- Reserves months
- —
- Total cash needed
- —
Loan-product check · same deal, 3 products live
Conventional
25% down · 7.5% · 30yr
- Down + closing
- —
- Monthly P&I
- —
- Monthly cashflow
- —
- DSCR
- —
- Eligible?
- —
Personal DTI + credit; lowest rate.
DSCR
20% down · 8.5% · 30yr
- Down + closing
- —
- Monthly P&I
- —
- Monthly cashflow
- —
- DSCR
- —
- Eligible?
- —
No personal income docs; deal must DSCR.
Hard money
10% down · 12.0% · 12mo
- Down + closing
- —
- Monthly P&I
- —
- Monthly cashflow
- —
- DSCR
- —
- Eligible?
- —
Short-term bridge; refi at stabilization.
Rent comps 1 comps
| Address | Beds | Baths | Sqft | Rent | $/sqft | DOM | Units | Dist |
|---|---|---|---|---|---|---|---|---|
| 5487 Pelham Ct Graceville, FL | 3.0 | 1.0 | 1478 | $1,089 | $0.74 | 21d | 1 | 1.11mi |
Listing history 18 events
-
2026-06-18days on market $45,000 Active 173 DOM
-
2026-06-17days on market $45,000 Active 172 DOM
-
2026-06-16days on market $45,000 Active 171 DOM
-
2026-06-15days on market $45,000 Active 170 DOM
-
2026-06-13days on market $45,000 Active 168 DOM
-
2026-06-12days on market $45,000 Active 167 DOM
-
2026-06-09days on market $45,000 Active 164 DOM
-
2026-06-08days on market $45,000 Active 163 DOM
-
2026-06-07days on market $45,000 Active 162 DOM
-
2026-06-04days on market $45,000 Active 158 DOM
-
2026-06-02days on market $45,000 Active 157 DOM
-
2026-06-01days on market $45,000 Active 156 DOM
-
2026-05-31days on market $45,000 Active 155 DOM
-
2026-05-31days on market $45,000 Active 154 DOM
-
2026-03-17status Active
-
2026-03-17price $45,000
-
2026-02-20status Pending
-
2025-11-28$60,000 Active
ⓘ Source: listings_history table (triggers on properties + properties_extension) + one-shot
backfill from property_details.listing_events for pre-trigger history.
Tax reassessment forecast FL · Resets to sale price
- Current annual tax
- $947 · $79/mo
- Projected year-2 tax
- $947 · $79/mo
- Expected delta
- $0/yr ($0/mo · -0.0%)
ⓘ Screening estimate from a state-policy table — verify with the county assessor before closing.
Climate risk First Street
- Flood 1/10 Low FEMA zone X (unshaded) · 0% chance over 30 yrs
- Wildfire 5/10 Major
- Heat 8/10 Severe 7 d/yr ≥107°F today · 19 d/yr by 30 yrs out
- Wind 8/10 Severe 99% chance of damaging wind over 30 yrs
- Air quality 3/10 Moderate 3 unhealthy d/yr today · 4 by 30 yrs out
Nearby sold comps map
Loading sold comps map…
Walkable amenities ~0.75 mi
Loading nearby amenities…
Taxation est. · year 1
- Rental income
- $13,068
- − Mortgage interest
- −$2,521
- − Property taxes
- −$947
- − Insurance
- −$225
- − Repairs & maintenance
- −$1,045
- − Management
- −$1,045
- − Depreciation
- −$1,309
- Taxable income
- $5,975
- Est. tax owed @ 24.0%
- −$1,434
- After-tax cash flow
- $4,886/yr
For passive investors: Depreciation is non-cash, so a rental often shows a tax loss while cash-flowing — sheltering income. Rental losses are passive: they offset passive income freely, and up to $25,000/yr can offset ordinary (W-2) income if you actively participate and your MAGI is under $100k (phasing out to $0 by $150k); unused losses carry forward. On sale, claimed depreciation is recaptured at up to 25%, and gains may owe capital-gains tax (a 1031 exchange can defer both). Figures are a year-1 estimate at your 24.0% rate — not tax advice; consult a CPA.
Schools (NCES district)
- District
- Jackson
- NCES district ID
- 1200960
- Math proficiency
- 47% ▼ -9.00%
- Reading proficiency
- 54% ▼ -3.00%
- Median HH income
- $36,824
- Composite
- 41.92/100
- National rank
- #3358
- State rank
- #39 of 73 in FL
Livability — Graceville
- Score
- 68/100
- State rank
- #528
- US rank
- #9865
Category grades
Schools grade is shown separately in the Schools card above.
Census & demographics
- Census place
- Graceville, FL
- Population (ZIP)
- 8,048
Population outlook (Jackson County) Hauer SSP2
- Today (2025)
- 46,095 people
- By 2030
- 44,432 · -3.6%
- By 2040
- 41,077 · -10.9%
- By 2050
- 37,587 · -18.5%
- By 2075
- 28,921 · -37.3%
- By 2100
- 19,332 · -58.1%
Race, ethnicity, and origin ACS 2023
- Neighborhood character
- Predominantly White (71%)
- Race & ethnicity
- White 71% Black 21% Two or more races 4% Hispanic / Latino 3%
- Common ancestry
- Italian 1% Lithuanian 1% Slovak 1%
- Foreign-born
- 1% · Canada
- Languages at home
- 93% English-only · Spanish 4% Other Asian/Pacific 1% French/Haitian/Cajun 1%
Political lean MEDSL · Jackson
- 2024 margin
- Solid R (+46.1) · D 26.7% · R 72.7%
- 2008→2024 swing
- -18.0pp toward R · 2008: -28.0pp · 2024: -46.1pp
- All cycles
- 2024: R+46.1 2020: R+38.9 2016: R+37.4 2012: R+29.0 2008: R+28.0
Not yet ingested
- Civics
- —
Market trends
- HPI YoY
- ▼ -37.19%
- Current HPI
- 154.1728
- Rent YoY
- —
- Metro
- —
- State GDP YoY
- ▲ 3.28%
- F500 in state
- 36
Industry mix (Fortune 500 HQ in FL)
| Industry | F500 HQs | Revenue |
|---|---|---|
| Industrial Technology | 2 | $29B |
|
||
| Insurance | 2 | $17B |
|
||
| Retail | 1 | $60B |
|
||
| Technology Distribution | 1 | $58B |
|
||
| Homebuilding | 1 | $35B |
|
||
| Technology Manufacturing | 1 | $35B |
|
||
Price history
-25.0% since first listed4 events — show timeline
- 2026-03-17 Relisted — CPARMLS
- 2026-03-17 Price Changed $45,000 CPARMLS
- 2026-02-20 Pending — CPARMLS
- 2025-11-28 Listed $60,000 CPARMLS
Property tax history
+4.1%/yrLatest (2025): $947 · +6.5% YoY. Source: county tax records.
Cash-flow waterfall
monthlySold comps — $/sqft
last 12 mo · ≤1 miLoading sold comps…