179 NE Diana Ter · Five Points, FL
Flood risk 1/10 · Minimal
- FEMA flood zone
- X (unshaded)
- Chance of flooding over 30 yrs
- 0.0%
- Est. flood insurance / yr
- $507 – $1,088
Fire risk 5/10 · Moderate
- Est. fire insurance / yr
- $947 – $1,759
Heat risk 8/10 · Major
- Hot days now (above 107°F)
- 7 days/yr
- Hot days in 30 yrs
- 20 days/yr
Wind risk 9/10 · Severe
- Chance of severe wind over 30 yrs
- 99.0%
Air-quality risk 5/10 · Moderate
- Unhealthy air days now
- 9 days/yr
- Unhealthy air days in 30 yrs
- 10 days/yr
Risk factors via First Street. Map © Google.
Why this score? — see what drove the C grade
The composite is a weighted blend of 9 inputs, each scored 0–100. Each bar is that input's sub-score; the figure is the points it added to the 100-point composite (weight × sub-score).
- ARV discount +15.0/15.0
- Cash flow +13.1/30.0
- Appreciation +10.0/10.0
- Schools +4.5/10.0
- DSCR +3.9/10.0
- Livability +3.0/5.0
- 1% rule +2.7/10.0
- Rent growth +2.5/5.0
- Condition / age +2.5/5.0
$125,000
🖨 Deal sheet (PDF) 📄 Offer letter ✓ Due diligence
Listing remarks
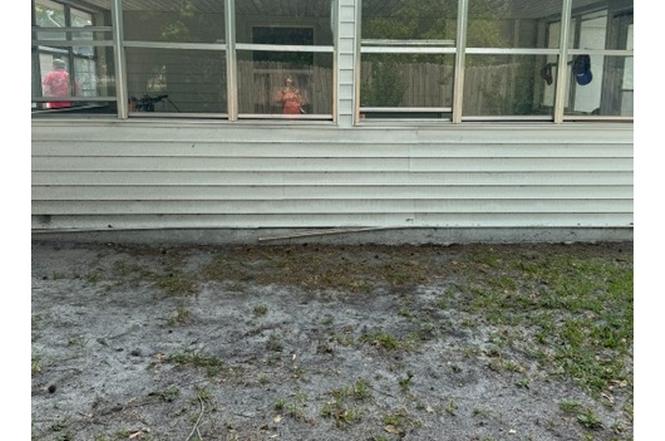
Homes shows a lot of care and love, great for a couple just starting out, or use for a rental. Very pretty yard well taken care of, back of home fence for privacy with nice restful layout. A building that can be used for your choice, additional building for storage. Don't let the age or size discourage you come see for your self.
Key facts
- Pretty yard
- Back of home fence
- 1.02 acre lot
Tags
Property features AI
Finance
- Other:
- Financial info:
- HOA & community:
Exterior
- Parking:
- Security:
- Utilities: Private well water
- Home design: Manufactured home; Residential property; Located in Five Points Acres
- Construction: Frame construction; Shingle roof
- Exterior features: Deck; Wood fencing; Shed(s); Workshop
Interior
- Kitchen: Electric cooktop; Refrigerator
- Bedrooms:
- Flooring: Vinyl
- Bathrooms: 2 full bathrooms
- Heating & cooling: Central heating; Electric heating; Central air conditioning
- Interior features: Furnished; Vinyl flooring
- Laundry & utility:
Neighborhood map
What this means for you Summary
Snapshot
- This is a 2-bed/2.0-bath manufactured listed at $125k.
Deal economics
- At list price, monthly cash flow is $-4 ($-51/yr) — negative.
- To cash-flow at today's rent, offer at most $124k (0.6% below list).
- To meet the 1% rule (rent ≥ 1% of price), the offer needs to be $96k (23.4% below list).
- Recommended offer: $96k (23.4% below list) — sets the bar for 1% rule.
Location & tenants
- Location reads 59/100 on livability (#830 in FL) — a working-class tenant base; expect higher turnover. Strengths: crime A+, cost of living A+, housing B+; Watch: amenities F, commute F, employment F.
- Columbia (town): math 53% / reading 54% proficiency, ranked #25 of 73 in FL (top 34%) — acceptable for families but not a draw, mixed tenant base, ~2y average lease.
- Zoned schools: Five Points Elementary School (math 47% / reading 47%, grade D-, #1,191 of 2,144 statewide, top 57%, 400 students, 83% FRL); Columbia High School (math 28% / reading 45%, grade F, #351 of 667 statewide, top 54%, 1,737 students, 50% FRL).
- Market conditions: 144 active listings in the ZIP; 178 units permitted in Columbia County in 2024 (0 in 5+ unit buildings).
Forward outlook
- In year one you build about $13k of equity ($864 loan paydown + $12k appreciation (10.0% local appreciation)).
- Columbia County population projected to shrink 7% by 2050 — rents likely to lag national; underwrite the cash flow, not the appreciation.
- At projected returns (10.0% appreciation + 3.0% rent growth), your $35k cash investment doubles in ~3 years — after that, you're playing with house money.
- By year 3, paydown + projected appreciation supports a ~$34k cash-out refi (75% LTV) — recoverable capital for the next deal without selling this one.
Negotiation context
- It's been on market 155 days — a 12% lower offer ($110k) is reasonable based on typical stale-listing flexibility.
- Current owner paid $78k; list at $125k implies a 61% gain — meaningful room to come down on a strong offer.
Risks & watch-outs
- Climate carrying-cost: severe wind risk, 99% chance of damaging wind over 30y; moderate wildfire risk; extreme-heat days projected 7→20/yr by 2055 (HVAC capex compounding) — expect insurance premiums to compound above CPI over the hold.
Questions for the listing agent
- What do current leases actually rent for vs. the listed asking? Can we see a recent rent roll and the last 12 months of T-12 income?
- It's been on market 155 days. Have you received any prior offers? Is the seller open to a 23% concession, seller financing, or rate buy-down credit?
- Why hasn't it sold? Are there any deal-killer items the seller is aware of (foundation, flood, title, zoning, code violations)?
- Is there a deadline driving the sale (1031 exchange, divorce, estate, relocation)? That informs how much negotiation room exists.
- Schools are F-rated, which usually means shorter tenancies and higher turnover. Who's the typical renter profile here, and what's been the actual vacancy rate?
- What's the average days-on-market for RENTAL listings here right now (not sales)? A rising rental-DOM trend means longer vacancies and softer asking-rent achievability than the comps imply.
- What's the recent tenant-quality profile in this submarket — average credit score on applications, eviction rate, late-payment / NSF rate, and stable-employment percentage? A property-management company in the area should have these aggregated.
- How much new for-sale + rental construction is in the pipeline within 1–3 miles? Heavy new supply typically softens prices + rents 12–24 months out; constrained supply supports both.
Investment metrics
- 1% rule
- 0.77% ✗
- Cap rate
- 6.25%
- Cash-on-cash
- -0.15%
- DSCR
- 0.99
- GRM
- 10.9
CMA / ARV
- ARV (on-the-fly)
- $174,636
- Comps found
- 4
Show comp detail 4 sales within ~0.75 mi
| Address | Dist | Beds/Ba | Sqft | Sold | Price | $/sf | Match |
|---|---|---|---|---|---|---|---|
| 179 NE Diana Ter | 0.00mi | 2/2.0 | 925 (+0%) | 1mo | $100,000 | $108 | 99 |
| 202 NE Colvin Ave | 0.31mi | 2/2.0 | 896 (-3%) | 12mo | $185,000 | $206 | 71 |
| 197 NE Windall Ln | 0.75mi | 2/2.0 | 896 (-3%) | 5mo | $169,000 | $189 | 56 |
| 232 NE Sunnybrook St | 0.67mi | 3/2.0 (+1) | 924 (0%) | 9mo | $125,000 | $135 | 56 |
Match score weights: distance 35% · size 25% · config 20% · recency 20%. Top-matched comps best support the ARV.
Projected returns pro-forma
10.0% appreciation · 3.0% rent growth · sell at horizon
- IRR
- 24.2%
- Equity multiple
- 2.94×
- Total profit
- $67,759
- Equity at exit
- $112,610
- IRR
- 21.4%
- Equity multiple
- 6.70×
- Total profit
- $199,654
- Equity at exit
- $242,848
Cash invested: $35,000 (down + closing). Projections, not guarantees.
Landlord ↔ Tenant lean methodology
- Overall (STATE)
- 87 Strongly Landlord-Friendly
- State Florida
- 87 Strongly Landlord-Friendly · R+3
- County
- — inherits STATE
- City
- — inherits STATE
ZIP-level market 32055
- Home prices YoY
- 24.1%
- Active inventory
- 144
- Price-to-rent
- 10.9×
Monthly cashflow live
- Estimated rent
- $957 medium interval (Pro) →
- Mortgage (P&I)
- −$656
- Tax from tax record
- −$53 /mo · $634/yr
- Insurance
- −$52
- HOA
- −$0
- Lot rent leased land?
- −$0
- Vacancy / Maint / Mgmt
- −$201
- Net cashflow
- $-4
Break-even live
Sensitivity live
| Price | -10% $67 | -5% $31 | +0% $-4 | +5% $-40 | +10% $-75 |
|---|---|---|---|---|---|
| Rent | -10% $-80 | -5% $-42 | +0% $-4 | +5% $34 | +10% $71 |
| Rate | -1.0pp $59 | -0.5pp $28 | base $-4 | +0.5pp $-37 | +1.0pp $-70 |
UW: 25.0% down · 7.5% · 30yr · 1.5% tax · 5.0% vac · 8.0% maint · 8.0% mgmt
Financing live
Cash to close
- Down payment
- $31,250
- Closing costs
- $3,750
- Reserves months
- —
- Total cash needed
- —
Loan-product check · same deal, 3 products live
Conventional
25% down · 7.5% · 30yr
- Down + closing
- —
- Monthly P&I
- —
- Monthly cashflow
- —
- DSCR
- —
- Eligible?
- —
Personal DTI + credit; lowest rate.
DSCR
20% down · 8.5% · 30yr
- Down + closing
- —
- Monthly P&I
- —
- Monthly cashflow
- —
- DSCR
- —
- Eligible?
- —
No personal income docs; deal must DSCR.
Hard money
10% down · 12.0% · 12mo
- Down + closing
- —
- Monthly P&I
- —
- Monthly cashflow
- —
- DSCR
- —
- Eligible?
- —
Short-term bridge; refi at stabilization.
Listing history 2 events
-
2025-12-22$125,000 Active
-
2022-10-04soldstatus $77,500
ⓘ Source: listings_history table (triggers on properties + properties_extension) + one-shot
backfill from property_details.listing_events for pre-trigger history.
Tax reassessment forecast FL · Resets to sale price
- Current annual tax
- $634 · $53/mo
- Projected year-2 tax
- $1,038 · $86/mo
- Expected delta
- +$404/yr (+$34/mo · 63.8%)
ⓘ Screening estimate from a state-policy table — verify with the county assessor before closing.
Climate risk First Street
- Flood 1/10 Low FEMA zone X (unshaded) · 0% chance over 30 yrs
- Wildfire 5/10 Major
- Heat 8/10 Severe 7 d/yr ≥107°F today · 20 d/yr by 30 yrs out
- Wind 9/10 Extreme 99% chance of damaging wind over 30 yrs
- Air quality 5/10 Major 9 unhealthy d/yr today · 10 by 30 yrs out
Nearby sold comps map
Loading sold comps map…
Walkable amenities ~0.75 mi
Loading nearby amenities…
Taxation est. · year 1
- Rental income
- $11,486
- − Mortgage interest
- −$7,002
- − Property taxes
- −$634
- − Insurance
- −$625
- − Repairs & maintenance
- −$919
- − Management
- −$919
- − Depreciation
- −$3,636
- Taxable loss
- −$2,249
- Est. tax savings @ 24.0%
- +$540
- After-tax cash flow
- $489/yr
For passive investors: Depreciation is non-cash, so a rental often shows a tax loss while cash-flowing — sheltering income. Rental losses are passive: they offset passive income freely, and up to $25,000/yr can offset ordinary (W-2) income if you actively participate and your MAGI is under $100k (phasing out to $0 by $150k); unused losses carry forward. On sale, claimed depreciation is recaptured at up to 25%, and gains may owe capital-gains tax (a 1031 exchange can defer both). Figures are a year-1 estimate at your 24.0% rate — not tax advice; consult a CPA.
Schools (NCES district)
- District
- Columbia
- NCES district ID
- 1200360
- Math proficiency
- 53% ▼ -10.00%
- Reading proficiency
- 54% ▼ -3.00%
- Median HH income
- $40,053
- Composite
- 44.74/100
- National rank
- #2750
- State rank
- #25 of 73 in FL
Livability — Five Points
- Score
- 59/100
- State rank
- #830
- US rank
- #20313
Category grades
Schools grade is shown separately in the Schools card above.
Census & demographics
- County
- Columbia County · 40,507 people
- Metro
- Lake City, FL
- Population (ZIP)
- 17,559
- Household income
- $61,111
- Rent vs Own
- Severe rent burden
- 391.0
Population outlook (Columbia County) Hauer SSP2
- Today (2025)
- 68,129 people
- By 2030
- 67,501 · -0.9%
- By 2040
- 65,465 · -3.9%
- By 2050
- 63,058 · -7.4%
- By 2075
- 56,291 · -17.4%
- By 2100
- 45,243 · -33.6%
Race, ethnicity, and origin ACS 2023
- Neighborhood character
- Majority White (61%)
- Race & ethnicity
- White 61% Black 29% Two or more races 5% Hispanic / Latino 4%
- Common ancestry
- Romanian 2% Iranian 2% Lithuanian 1%
- Foreign-born
- 3% · Canada
- Languages at home
- 96% English-only · Spanish 2%
Political lean MEDSL · Columbia
- 2024 margin
- Solid R (+50.2) · D 24.6% · R 74.7%
- 2008→2024 swing
- -16.4pp toward R · 2008: -33.8pp · 2024: -50.2pp
- All cycles
- 2024: R+50.2 2020: R+45.2 2016: R+44.5 2012: R+36.7 2008: R+33.8
Not yet ingested
- Civics
- —
Market trends
- HPI YoY
- ▲ 67.79%
- Current HPI
- 348.8923
- Rent YoY
- —
- Metro
- Lake City, FL
- State GDP YoY
- ▲ 3.28%
- F500 in state
- 36
Industry mix (Fortune 500 HQ in FL)
| Industry | F500 HQs | Revenue |
|---|---|---|
| Industrial Technology | 2 | $29B |
|
||
| Insurance | 2 | $17B |
|
||
| Retail | 1 | $60B |
|
||
| Technology Distribution | 1 | $58B |
|
||
| Homebuilding | 1 | $35B |
|
||
| Technology Manufacturing | 1 | $35B |
|
||
Price history
+61.3% since first listed2 events — show timeline
- 2025-12-22 Listed $125,000 NFMLS
- 2022-10-04 Sold (Public Records) $77,500 Public Records
Property tax history
+0.0%/yrLatest (2025): $634 · +0.3% YoY. Source: county tax records.
Cash-flow waterfall
monthlySold comps — $/sqft
last 12 mo · ≤1 miLoading sold comps…