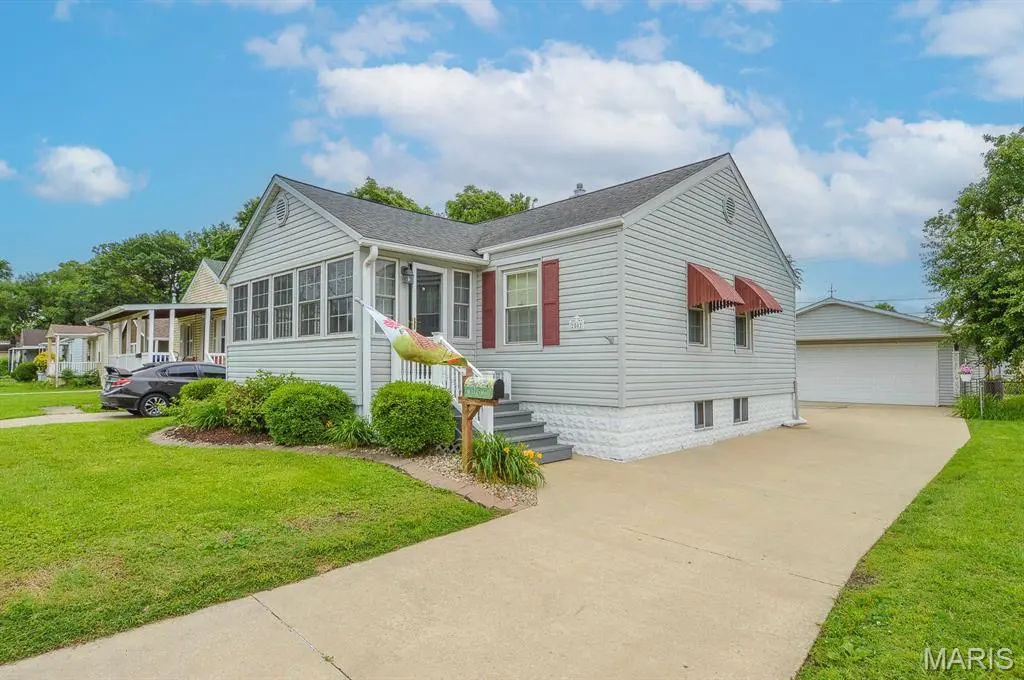
2502 E 28th St · Granite City, IL
Flood risk 1/10 · Minimal
- FEMA flood zone
- X
- Chance of flooding over 30 yrs
- 0.0%
- Est. flood insurance / yr
- $473 – $860
Fire risk 1/10 · Minimal
- Est. fire insurance / yr
- $804 – $1,492
Heat risk 6/10 · Moderate
- Hot days now (above 108°F)
- 7 days/yr
- Hot days in 30 yrs
- 21 days/yr
Wind risk 2/10 · Minimal
- Chance of severe wind over 30 yrs
- 1.0%
Air-quality risk 4/10 · Minor
- Unhealthy air days now
- 4 days/yr
- Unhealthy air days in 30 yrs
- 5 days/yr
Risk factors via First Street. Map © Google.
Why this score? — see what drove the B- grade
The composite is a weighted blend of 9 inputs, each scored 0–100. Each bar is that input's sub-score; the figure is the points it added to the 100-point composite (weight × sub-score).
- Cash flow +30.0/30.0
- 1% rule +10.0/10.0
- DSCR +10.0/10.0
- ARV discount +7.5/15.0
- Livability +3.2/5.0
- Rent growth +2.9/5.0
- Condition / age +2.5/5.0
- Schools +0.9/10.0
- Appreciation +0.0/10.0
$30,000
🖨 Deal sheet 📄 Offer letter ✓ Due diligence
Listing remarks
Price listed is Starting Bid Only. Bidding starts closing 7/1/2026 @ 5 p. m. Welcome home to a place filled with charm, natural light, and the kind of care you can feel the moment you step inside. This delightful two bedroom, one bath home, features hardwood floors that stretch across the inviting living room and both spacious bedrooms. The recently updated bathroom offers a walk in shower and fresh modern touches. The cozy eat in kitchen makes everyday living easy with plenty of storage and all appliances included. Just off the kitchen, the sunroom becomes a favorite spot—surrounded by windows and overlooking the beautifully kept front lawn, it is perfect for morning coffee or quiet
Key facts
- Eat in kitchen
- Sunroom
- Hardwood floors
Tags
Property features AI
Finance
- Other: Lease not considered
- Financial info: Property listed as private ownership; Auction listing
Exterior
- Parking: Two total parking spaces; Two-car garage
- Utilities: Public water; Public sewer; Electricity connected; Natural gas connected; Cable available; Water connected; Sewer connected
- Home design: Single-family house; One level
- Construction: Other construction materials; Architectural shingle roof
- Exterior features: Front porch (glass enclosed); Back yard with a few trees
Interior
- Bedrooms: Two bedrooms on the main level
- Bathrooms: One full bathroom on the main level
- Heating & cooling: Forced air heating (natural gas); Central air conditioning
- Interior features: Crawl space basement with partial finished areas and interior walk-up entry; No fireplace
- Laundry & utility: Laundry located in the basement
Neighborhood map
What this means for you Summary
Snapshot
- This is a 2-bed/1.0-bath single-family listed at $30k.
Deal economics
- At list price, monthly cash flow is $495 ($6k/yr) — positive.
- The deal already cash-flows at list — no discount required.
- Meets the 1% rule at list price ($872 rent vs $30k).
- Cap rate 26.1% vs local median 7.0% in Granite City — top-decile yield for the area; either an underpriced asset or a hidden risk that comps aren't pricing in. Stress-test before assuming the spread holds.
Location & tenants
- Location reads 65/100 on livability (#623 in IL) — a middle-class / working-renter tenant base. Strengths: cost of living A+, housing A+; Watch: crime F, amenities F, commute F.
- Granite City CUSD 9 (suburban): math 9% / reading 11% proficiency, ranked #570 of 620 in IL (top 92%) — low school quality limits family demand, transient renter base, plan for 1-2y turnover.
- Zoned schools: Granite City High School (math 10% / reading 12%, grade F, #522 of 693 statewide, top 76%, 1,805 students, 0% FRL) — zoned schools average 0% FRL vs 59% district-wide (59 pts lower); this property's tenant base skews higher-income than the district average.
- Market conditions: Rents rising (+1.7%/yr); 194 active listings in the ZIP; 3 comparable units currently listed for rent nearby; rentals at typical pace (median 22d on market — plan ~3-4 weeks tenant-placement turnaround); 336 units permitted in Madison County in 2024 (0 in 5+ unit buildings).
- This rent is only 17% of the median local income ($60k/yr) — well below the 30% rent-burden line; pricing power to push rent on renewal without tenant pushback.
Forward outlook
- Local home prices are declining (-3.0%/yr); year-one equity from $207 of loan paydown is wiped out by about $900 of value loss. Plan a longer hold.
- Madison County population projected at -18% by 2050 — secular population decline; favor cash flow + early exit over multi-decade hold.
- At projected returns (-3.0% appreciation + 1.7% rent growth), your $8k cash investment doubles in ~2 years — after that, you're playing with house money.
Negotiation context
- Only 14 days on market — expect competitive offers; lowballing is unlikely to land.
Risks & watch-outs
- Watch-outs: built in 1943 — expect roof / HVAC / electrical / plumbing capex.
- Climate carrying-cost: extreme-heat days projected 7→21/yr by 2055 (HVAC capex compounding) — expect insurance premiums to compound above CPI over the hold.
Questions for the listing agent
- Built in 1943 — when were the roof, HVAC, electrical panel, plumbing, and water heater last replaced?
- Is there a deadline driving the sale (1031 exchange, divorce, estate, relocation)? That informs how much negotiation room exists.
- Schools are F-rated, which usually means shorter tenancies and higher turnover. Who's the typical renter profile here, and what's been the actual vacancy rate?
- Crime grade is F in this area — have there been break-ins, vandalism, or insurance claims at this property in the last 3 years? What carrier currently insures it and at what premium?
- What's the average days-on-market for RENTAL listings here right now (not sales)? A rising rental-DOM trend means longer vacancies and softer asking-rent achievability than the comps imply.
- What's the recent tenant-quality profile in this submarket — average credit score on applications, eviction rate, late-payment / NSF rate, and stable-employment percentage? A property-management company in the area should have these aggregated.
- How much new for-sale + rental construction is in the pipeline within 1–3 miles? Heavy new supply typically softens prices + rents 12–24 months out; constrained supply supports both.
Investment metrics
- 1% rule
- 2.91% ✓
- Cap rate
- 26.09%
- Cash-on-cash
- 70.71%
- DSCR
- 4.15
- GRM
- 2.9
CMA / ARV
- ARV (on-the-fly)
- $67,680
- Comps found
- 12
Show comp detail 12 sales within ~0.75 mi
| Address | Dist | Beds/Ba | Sqft | Sold | Price | $/sf | Match |
|---|---|---|---|---|---|---|---|
| 2524 Propes Ave | 0.11mi | 2/1.0 | 728 (+1%) | 8mo | $85,000 | $117 | 87 |
| 2532 E 27th St | 0.08mi | 3/1.0 (+1) | 720 (0%) | 9mo | $60,000 | $83 | 84 |
| 2664 E 28th St | 0.25mi | 2/1.0 | 720 (0%) | 6mo | $85,000 | $118 | 83 |
| 2657 E 27th St | 0.24mi | 2/1.0 | 720 (0%) | 9mo | $97,000 | $135 | 82 |
| 2748 Myrtle Ave | 0.35mi | 2/1.0 | 744 (+3%) | 3mo | $70,000 | $94 | 76 |
| 2954 Washington Ave | 0.29mi | 1/1.0 (-1) | 747 (+4%) | 3mo | $65,000 | $87 | 73 |
| 2541 Washington Ave | 0.43mi | 2/1.0 | 748 (+4%) | 5mo | $10,000 | $13 | 69 |
| 2711 Iowa St | 0.18mi | 2/1.0 | 810 (+12%) | 9mo | $47,900 | $59 | 63 |
| 2205 E 24th St | 0.63mi | 3/1.0 (+1) | 736 (+2%) | 5mo | $12,000 | $16 | 57 |
| 3017 Ramona Dr | 0.66mi | 2/1.0 | 780 (+8%) | 3mo | $150,000 | $192 | 53 |
| 2435 Washington Ave | 0.55mi | 3/2.0 (+1) | 648 (-10%) | 4mo | $95,000 | $147 | 46 |
| 3140 Aubrey Ave | 0.74mi | 2/1.0 | 792 (+10%) | 5mo | $59,900 | $76 | 45 |
Match score weights: distance 35% · size 25% · config 20% · recency 20%. Top-matched comps best support the ARV.
Projected returns pro-forma
-3.0% appreciation · 1.67% rent growth · sell at horizon
- IRR
- 68.8%
- Equity multiple
- 4.04×
- Total profit
- $25,515
- Equity at exit
- $4,473
- IRR
- 72.5%
- Equity multiple
- 7.93×
- Total profit
- $58,228
- Equity at exit
- $2,594
Cash invested: $8,400 (down + closing). Projections, not guarantees.
Landlord ↔ Tenant lean methodology
- Overall (STATE)
- 43 Moderately Tenant-Leaning
- State Illinois
- 43 Moderately Tenant-Leaning · D+7
- County
- — inherits STATE
- City
- — inherits STATE
ZIP-level market 62040
- Home prices YoY
- -21.8%
- Rents YoY
- 1.7%
- Active inventory
- 194
- Price-to-rent
- 2.9×
Monthly cashflow live
- Estimated rent
- $872 medium interval (Pro) →
- Mortgage (P&I)
- −$157
- Tax from tax record
- −$24 /mo · $293/yr
- Insurance
- −$12
- HOA
- −$0
- Vacancy / Maint / Mgmt
- −$183
- Net cashflow
- $495
Break-even live
UW: 25.0% down · 7.5% · 30yr · 1.5% tax · 5.0% vac · 8.0% maint · 8.0% mgmt
Financing live
Cash to close
- Down payment
- $7,500
- Closing costs
- $900
- Reserves months
- —
- Total cash needed
- —
Loan-product check · same deal, 3 products live
Conventional
25% down · 7.5% · 30yr
- Down + closing
- —
- Monthly P&I
- —
- Monthly cashflow
- —
- DSCR
- —
- Eligible?
- —
Personal DTI + credit; lowest rate.
DSCR
20% down · 8.5% · 30yr
- Down + closing
- —
- Monthly P&I
- —
- Monthly cashflow
- —
- DSCR
- —
- Eligible?
- —
No personal income docs; deal must DSCR.
Hard money
10% down · 12.0% · 12mo
- Down + closing
- —
- Monthly P&I
- —
- Monthly cashflow
- —
- DSCR
- —
- Eligible?
- —
Short-term bridge; refi at stabilization.
Rent comps 3 comps
| Address | Beds | Baths | Sqft | Rent | $/sqft | DOM | Units | Dist |
|---|---|---|---|---|---|---|---|---|
| 2734 Center St Unit D Granite City, IL | 1.0 | 1.0 | 680 | $1,025 | $1.51 | 12d | 1 | 0.74mi |
| 1215 22nd St Unit 1223 Granite City, IL | 1.0 | 1.0 | 600 | $550 | $0.92 | 21d | 1 | 1.08mi |
| 1215 22nd St Unit 1227 Granite City, IL | 1.0 | 1.0 | 600 | $600 | $1.00 | 43d | 1 | 1.08mi |
Listing history 11 events
-
2026-06-18days on market $30,000 Active 14 DOM
-
2026-06-09days on market $30,000 Active 12 DOM
-
2026-06-08days on market $30,000 Active 11 DOM
-
2026-06-07days on market $30,000 Active 10 DOM
-
2026-06-05days on market $30,000 Active 7 DOM
-
2026-06-03days on market $30,000 Active 6 DOM
-
2026-06-02days on market $30,000 Active 5 DOM
-
2026-06-01days on market $30,000 Active 4 DOM
-
2026-05-31days on market $30,000 Active 3 DOM
-
2026-05-28$30,000 Active
-
1990-07-12soldstatus $30,000
ⓘ Source: listings_history table (triggers on properties + properties_extension) + one-shot
backfill from property_details.listing_events for pre-trigger history.
Tax reassessment forecast IL · Partial reset (capped growth)
- Current annual tax
- $293 · $24/mo
- Projected year-2 tax
- $487 · $41/mo
- Expected delta
- +$194/yr (+$16/mo · 66.3%)
ⓘ Screening estimate from a state-policy table — verify with the county assessor before closing.
Climate risk First Street
- Flood 1/10 Low FEMA zone X · 0% chance over 30 yrs
- Wildfire 1/10 Low
- Heat 6/10 Major 7 d/yr ≥108°F today · 21 d/yr by 30 yrs out
- Wind 2/10 Low 100% chance of damaging wind over 30 yrs
- Air quality 4/10 Moderate 4 unhealthy d/yr today · 5 by 30 yrs out
Nearby sold comps map
Loading sold comps map…
Walkable amenities ~0.75 mi
Loading nearby amenities…
Taxation est. · year 1
- Rental income
- $10,469
- − Mortgage interest
- −$1,680
- − Property taxes
- −$293
- − Insurance
- −$150
- − Repairs & maintenance
- −$837
- − Management
- −$837
- − Depreciation
- −$873
- Taxable income
- $5,798
- Est. tax owed @ 24.0%
- −$1,391
- After-tax cash flow
- $4,548/yr
For passive investors: Depreciation is non-cash, so a rental often shows a tax loss while cash-flowing — sheltering income. Rental losses are passive: they offset passive income freely, and up to $25,000/yr can offset ordinary (W-2) income if you actively participate and your MAGI is under $100k (phasing out to $0 by $150k); unused losses carry forward. On sale, claimed depreciation is recaptured at up to 25%, and gains may owe capital-gains tax (a 1031 exchange can defer both). Figures are a year-1 estimate at your 24.0% rate — not tax advice; consult a CPA.
Schools (NCES district)
- District
- Granite City CUSD 9
- NCES district ID
- 1717280
- Math proficiency
- 9% ▼ -4.00%
- Reading proficiency
- 11% ▼ -7.00%
- Median HH income
- $45,082
- Composite
- 9.15/100
- National rank
- #9864
- State rank
- #570 of 620 in IL
Livability — Granite City
- Score
- 65/100
- State rank
- #623
- US rank
- #12751
Category grades
Schools grade is shown separately in the Schools card above.
Census & demographics
- Census place
- Granite City, IL
- County
- Madison County · 189,064 people
- City population
- 40,404
- Metro
- St. Louis, MO-IL
- Population (ZIP)
- 40,404
- Household income
- $60,031
- Rent vs Own
- Severe rent burden
- 923.0
Population outlook (Madison County) Hauer SSP2
- Today (2025)
- 258,371 people
- By 2030
- 251,523 · -2.7%
- By 2040
- 233,640 · -9.6%
- By 2050
- 213,042 · -17.5%
- By 2075
- 165,255 · -36.0%
- By 2100
- 123,953 · -52.0%
Race, ethnicity, and origin ACS 2023
- Neighborhood character
- Predominantly White (76%)
- Race & ethnicity
- White 76% Hispanic / Latino 9% Black 9% Two or more races 7% Asian 1%
- Hispanic origin (detail)
- Mexican 7%
- Common ancestry
- Romanian 2% Lithuanian 2% Serbian 2%
- Foreign-born
- 3% · Canada, Vietnam
- Languages at home
- 93% English-only · Spanish 5%
Political lean MEDSL · Madison
- 2024 margin
- R (+13.3) · D 42.5% · R 55.8% · Other 1.8%
- 2008→2024 swing
- -22.5pp toward R · 2008: 9.2pp · 2024: -13.3pp
- All cycles
- 2024: R+13.3 2020: R+13.2 2016: R+15.6 2012: R+1.4 2008: D+9.2
Not yet ingested
- Civics
- —
Market trends
- HPI YoY
- ▼ -56.88%
- Current HPI
- 204.4612
- Rent YoY
- ▲ 1.67%
- Metro
- St. Louis, MO-IL
- State GDP YoY
- ▲ 1.59%
- F500 in state
- 60
Industry mix (Fortune 500 HQ in IL)
| Industry | F500 HQs | Revenue |
|---|---|---|
| Insurance | 4 | $201B |
|
||
| Consumer Goods | 4 | $87B |
|
||
| Industrial Machinery | 3 | $64B |
|
||
| Healthcare | 2 | $55B |
|
||
| Retail / Pharmacy | 1 | $148B |
|
||
| Agriculture / Food | 1 | $86B |
|
||
Price history
+0.0% since first listed2 events — show timeline
- 2026-05-28 Listed $30,000 MARIS as Distributed by MLS Grid
- 1990-07-12 Sold (Public Records) $30,000 Public Records
Property tax history
-0.7%/yrLatest (2024): $293 · -8.5% YoY. Source: county tax records.
Cash-flow waterfall
monthlySold comps — $/sqft
last 12 mo · ≤1 miLoading sold comps…