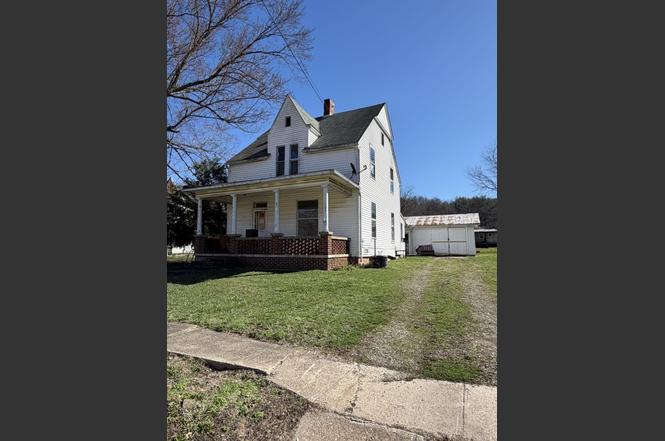
330 Main St · Rutland, OH
Flood risk 8/10 · Major
- FEMA flood zone
- X (unshaded)
- Chance of flooding over 30 yrs
- 0.99%
- Est. flood insurance / yr
- $473 – $860
Fire risk 3/10 · Minor
- Est. fire insurance / yr
- $713 – $1,323
Heat risk 4/10 · Minor
- Hot days now (above 100°F)
- 7 days/yr
- Hot days in 30 yrs
- 19 days/yr
Wind risk 2/10 · Minimal
- Chance of severe wind over 30 yrs
- 1.0%
Air-quality risk 2/10 · Minimal
- Unhealthy air days now
- 1 days/yr
- Unhealthy air days in 30 yrs
- 2 days/yr
Risk factors via First Street. Map © Google.
Why this score? — see what drove the B+ grade
The composite is a weighted blend of 9 inputs, each scored 0–100. Each bar is that input's sub-score; the figure is the points it added to the 100-point composite (weight × sub-score).
- Cash flow +30.0/30.0
- 1% rule +10.0/10.0
- DSCR +10.0/10.0
- Appreciation +8.7/10.0
- ARV discount +7.5/15.0
- Livability +3.0/5.0
- Rent growth +2.5/5.0
- Condition / age +2.5/5.0
- Schools +2.3/10.0
$49,000
🖨 Deal sheet 📄 Offer letter ✓ Due diligence
Listing remarks
This old two-story home with wood floors throughout is awaiting your vision. Bring this home back to life with some renovations and TLC! Property is being surveyed so we do not currently have exact property lines.
Key facts
- 6,970 sq ft lot
- Garage
- Built 1909
Property features AI
Exterior
- Parking: Detached 1-car garage
- Home design: Single-family residence; Two-story
- Construction: Asphalt shingle roof
- Exterior features: Covered porch/patio
Interior
- Kitchen: Refrigerator
- Flooring: Wood flooring
- Bathrooms: One full bathroom
- Heating & cooling: Has heating (type: other); No central cooling
- Interior features: Refrigerator included; Wood flooring throughout; Full unfinished basement
Neighborhood map
What this means for you Summary
Snapshot
- This is a 3-bed/1.0-bath single-family listed at $49k.
Deal economics
- At list price, monthly cash flow is $552 ($7k/yr) — positive.
- The deal already cash-flows at list — no discount required.
- Meets the 1% rule at list price ($1k rent vs $49k).
- Recommended offer: $45k (9.0% below list) — sets the bar for market timing.
Location & tenants
- Location reads 60/100 on livability (#962 in OH) — a middle-class / working-renter tenant base. Strengths: cost of living A+, housing B+; Watch: health & safety C-, employment D+, schools F.
- Meigs Local (rural): math 20% / reading 35% proficiency, ranked #594 of 656 in OH (top 90%) — low school quality limits family demand, transient renter base, plan for 1-2y turnover; 74% free/reduced lunch — lower-income household profile, screen leases tightly.
- Market conditions: 7 active listings in the ZIP; 3 units permitted in Meigs County in 2024 (0 in 5+ unit buildings).
Forward outlook
- In year one you build about $4k of equity ($339 loan paydown + $4k appreciation (7.5% local appreciation)).
- Meigs County population projected at -26% by 2050 — secular population decline; favor cash flow + early exit over multi-decade hold.
- At projected returns (7.5% appreciation + 3.0% rent growth), your $14k cash investment doubles in ~2 years — after that, you're playing with house money.
- By year 8, paydown + projected appreciation supports a ~$32k cash-out refi (75% LTV) — recoverable capital for the next deal without selling this one.
Negotiation context
- It's been on market 102 days — a 9% lower offer ($45k) is reasonable based on typical stale-listing flexibility.
- 2 sale attempts with the ask held roughly flat each time — persistent listings suggest the price (not the market) is what's stuck; bring a comps-based counter.
Risks & watch-outs
- Watch-outs: flood insurance adds $56/mo; built in 1909 — expect roof / HVAC / electrical / plumbing capex.
- Climate carrying-cost: severe flood risk — expect insurance premiums to compound above CPI over the hold.
Questions for the listing agent
- It's been on market 102 days. Have you received any prior offers? Is the seller open to a 9% concession, seller financing, or rate buy-down credit?
- Built in 1909 — when were the roof, HVAC, electrical panel, plumbing, and water heater last replaced?
- What's the actual annual flood-insurance premium (NFIP or private), and is the property in a SFHA with mandatory coverage?
- Why hasn't it sold? Are there any deal-killer items the seller is aware of (foundation, flood, title, zoning, code violations)?
- Is there a deadline driving the sale (1031 exchange, divorce, estate, relocation)? That informs how much negotiation room exists.
- Schools are F-rated, which usually means shorter tenancies and higher turnover. Who's the typical renter profile here, and what's been the actual vacancy rate?
- Crime grade is D in this area — have there been break-ins, vandalism, or insurance claims at this property in the last 3 years? What carrier currently insures it and at what premium?
- What's the average days-on-market for RENTAL listings here right now (not sales)? A rising rental-DOM trend means longer vacancies and softer asking-rent achievability than the comps imply.
- What's the recent tenant-quality profile in this submarket — average credit score on applications, eviction rate, late-payment / NSF rate, and stable-employment percentage? A property-management company in the area should have these aggregated.
- How much new for-sale + rental construction is in the pipeline within 1–3 miles? Heavy new supply typically softens prices + rents 12–24 months out; constrained supply supports both.
Investment metrics
- 1% rule
- 2.41% ✓
- Cap rate
- 21.17%
- Cash-on-cash
- 53.12%
- DSCR
- 3.36
- GRM
- 3.5
CMA / ARV
- ARV (on-the-fly)
- $162,720
- Comps found
- 2
Show comp detail 2 sales within ~0.75 mi
| Address | Dist | Beds/Ba | Sqft | Sold | Price | $/sf | Match |
|---|---|---|---|---|---|---|---|
| 550 Main St St | 0.46mi | 3/1.0 | 1,376 (-4%) | 17mo | $156,000 | $113 | 57 |
| 33164 New Lima Road Rd | 0.53mi | 3/2.0 | 1,299 (-10%) | 11mo | $75,500 | $58 | 46 |
Match score weights: distance 35% · size 25% · config 20% · recency 20%. Top-matched comps best support the ARV.
Projected returns pro-forma
7.45% appreciation · 3.0% rent growth · sell at horizon
- IRR
- 59.0%
- Equity multiple
- 4.91×
- Total profit
- $53,659
- Equity at exit
- $35,401
- IRR
- 54.7%
- Equity multiple
- 10.45×
- Total profit
- $129,661
- Equity at exit
- $68,597
Cash invested: $13,720 (down + closing). Projections, not guarantees.
Landlord ↔ Tenant lean methodology
- Overall (STATE)
- 73 Landlord-Friendly
- State Ohio
- 73 Landlord-Friendly · R+6
- County
- — inherits STATE
- City
- — inherits STATE
ZIP-level market 45775
- Home prices YoY
- 4.6%
- Active inventory
- 7
- Price-to-rent
- 3.5×
Monthly cashflow live
- Estimated rent
- $1,180 medium interval (Pro) →
- Mortgage (P&I)
- −$257
- Tax from tax record
- −$47 /mo · $567/yr
- Insurance
- −$20
- Flood insurance flood zone
- −$56 /mo · $666/yr
- HOA
- −$0
- Vacancy / Maint / Mgmt
- −$248
- Net cashflow
- $552
Break-even live
UW: 25.0% down · 7.5% · 30yr · 1.5% tax · 5.0% vac · 8.0% maint · 8.0% mgmt
Financing live
Cash to close
- Down payment
- $12,250
- Closing costs
- $1,470
- Reserves months
- —
- Total cash needed
- —
Loan-product check · same deal, 3 products live
Conventional
25% down · 7.5% · 30yr
- Down + closing
- —
- Monthly P&I
- —
- Monthly cashflow
- —
- DSCR
- —
- Eligible?
- —
Personal DTI + credit; lowest rate.
DSCR
20% down · 8.5% · 30yr
- Down + closing
- —
- Monthly P&I
- —
- Monthly cashflow
- —
- DSCR
- —
- Eligible?
- —
No personal income docs; deal must DSCR.
Hard money
10% down · 12.0% · 12mo
- Down + closing
- —
- Monthly P&I
- —
- Monthly cashflow
- —
- DSCR
- —
- Eligible?
- —
Short-term bridge; refi at stabilization.
Listing history 19 events
-
2026-06-19days on market $49,000 Active 102 DOM
-
2026-06-18days on market $49,000 Active 101 DOM
-
2026-06-17days on market $49,000 Active 100 DOM
-
2026-06-16days on market $49,000 Active 99 DOM
-
2026-06-15days on market $49,000 Active 98 DOM
-
2026-06-14days on market $49,000 Active 96 DOM
-
2026-06-12days on market $49,000 Active 95 DOM
-
2026-06-09days on market $49,000 Active 92 DOM
-
2026-06-08days on market $49,000 Active 91 DOM
-
2026-06-07days on market $49,000 Active 90 DOM
-
2026-06-05days on market $49,000 Active 87 DOM
-
2026-06-03days on market $49,000 Active 86 DOM
-
2026-06-02days on market $49,000 Active 85 DOM
-
2026-06-01days on market $49,000 Active 84 DOM
-
2026-05-31days on market $49,000 Active 83 DOM
-
2026-05-30days on market $49,000 Active 82 DOM
-
2026-05-19status Active
-
2026-03-26historical Active Under Contract
-
2026-03-10$49,000 Active
ⓘ Source: listings_history table (triggers on properties + properties_extension) + one-shot
backfill from property_details.listing_events for pre-trigger history.
Tax reassessment forecast OH · Partial reset (capped growth)
- Current annual tax
- $567 · $47/mo
- Projected year-2 tax
- $666 · $55/mo
- Expected delta
- +$99/yr (+$8/mo · 17.4%)
ⓘ Screening estimate from a state-policy table — verify with the county assessor before closing.
Climate risk First Street
- Flood 8/10 Severe FEMA zone X (unshaded) · 99% chance over 30 yrs
- Wildfire 3/10 Moderate
- Heat 4/10 Moderate 7 d/yr ≥100°F today · 19 d/yr by 30 yrs out
- Wind 2/10 Low 100% chance of damaging wind over 30 yrs
- Air quality 2/10 Low 1 unhealthy d/yr today · 2 by 30 yrs out
Nearby sold comps map
Loading sold comps map…
Walkable amenities ~0.75 mi
Loading nearby amenities…
Taxation est. · year 1
- Rental income
- $14,157
- − Mortgage interest
- −$2,745
- − Property taxes
- −$567
- − Insurance
- −$912
- − Repairs & maintenance
- −$1,133
- − Management
- −$1,133
- − Depreciation
- −$1,425
- Taxable income
- $6,243
- Est. tax owed @ 24.0%
- −$1,498
- After-tax cash flow
- $5,124/yr
For passive investors: Depreciation is non-cash, so a rental often shows a tax loss while cash-flowing — sheltering income. Rental losses are passive: they offset passive income freely, and up to $25,000/yr can offset ordinary (W-2) income if you actively participate and your MAGI is under $100k (phasing out to $0 by $150k); unused losses carry forward. On sale, claimed depreciation is recaptured at up to 25%, and gains may owe capital-gains tax (a 1031 exchange can defer both). Figures are a year-1 estimate at your 24.0% rate — not tax advice; consult a CPA.
Schools (NCES district)
- District
- Meigs Local
- NCES district ID
- 3904852
- Math proficiency
- 20% ▼ -23.00%
- Reading proficiency
- 35% ▼ -14.00%
- Median HH income
- $34,110
- Composite
- 22.56/100
- National rank
- #8079
- State rank
- #594 of 656 in OH
Livability — Rutland
- Score
- 60/100
- State rank
- #962
- US rank
- #18553
Category grades
Schools grade is shown separately in the Schools card above.
Census & demographics
- Census place
- Rutland, OH
- County
- Meigs · 23,356 people
- Population (ZIP)
- 1,548
- Household income
- $56,159
- Rent vs Own
Population outlook (Meigs County) Hauer SSP2
- Today (2025)
- 21,933 people
- By 2030
- 20,975 · -4.4%
- By 2040
- 18,650 · -15.0%
- By 2050
- 16,243 · -25.9%
- By 2075
- 10,860 · -50.5%
- By 2100
- 6,510 · -70.3%
Race, ethnicity, and origin ACS 2023
- Neighborhood character
- Predominantly White (95%)
- Race & ethnicity
- White 95% Hispanic / Latino 3% Two or more races 2%
- Common ancestry
- Slovak 13% Italian 5%
Political lean MEDSL · Meigs
- 2024 margin
- Solid R (+57.0) · D 21.2% · R 78.1%
- 2008→2024 swing
- -38.4pp toward R · 2008: -18.6pp · 2024: -57.0pp
- All cycles
- 2024: R+57.0 2020: R+53.2 2016: R+50.1 2012: R+18.8 2008: R+18.6
Not yet ingested
- Civics
- —
Market trends
- HPI YoY
- ▲ 7.45%
- Current HPI
- 168.3814
- Rent YoY
- —
- Metro
- —
- State GDP YoY
- ▲ 1.98%
- F500 in state
- 48
Industry mix (Fortune 500 HQ in OH)
| Industry | F500 HQs | Revenue |
|---|---|---|
| Insurance | 3 | $145B |
|
||
| Industrial Machinery | 3 | $49B |
|
||
| Financial Services | 3 | $24B |
|
||
| Consumer Goods | 2 | $93B |
|
||
| Aerospace / Defense | 2 | $47B |
|
||
| Utilities | 2 | $33B |
|
||
Price history
3 events — show timeline
- 2026-05-19 Relisted — ACBOR
- 2026-03-26 Contingent — ACBOR
- 2026-03-10 Listed $49,000 ACBOR
Property tax history
+1.4%/yrLatest (2025): $567 · +7.1% YoY. Source: county tax records.
Cash-flow waterfall
monthlySold comps — $/sqft
last 12 mo · ≤1 miLoading sold comps…