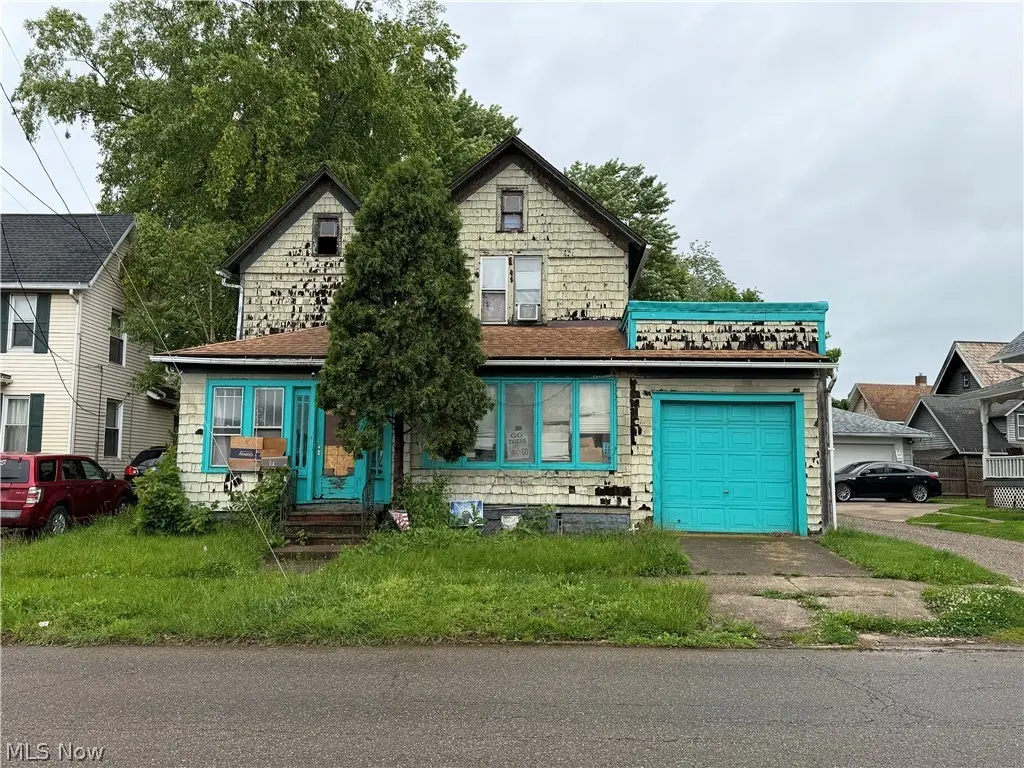
815 Amherst Rd NE · Massillon, OH
Flood risk 1/10 · Minimal
- FEMA flood zone
- X (unshaded)
- Chance of flooding over 30 yrs
- 0.0%
- Est. flood insurance / yr
- $473 – $860
Fire risk 1/10 · Minimal
- Est. fire insurance / yr
- $713 – $1,323
Heat risk 3/10 · Minor
- Hot days now (above 97°F)
- 7 days/yr
- Hot days in 30 yrs
- 17 days/yr
Wind risk 1/10 · Minimal
- Chance of severe wind over 30 yrs
- —
Air-quality risk 2/10 · Minimal
- Unhealthy air days now
- 0 days/yr
- Unhealthy air days in 30 yrs
- 1 days/yr
Risk factors via First Street. Map © Google.
Why this score? — see what drove the B grade
The composite is a weighted blend of 9 inputs, each scored 0–100. Each bar is that input's sub-score; the figure is the points it added to the 100-point composite (weight × sub-score).
- Cash flow +30.0/30.0
- 1% rule +10.0/10.0
- DSCR +10.0/10.0
- ARV discount +7.5/15.0
- Rent growth +4.0/5.0
- Schools +4.0/10.0
- Livability +3.7/5.0
- Condition / age +2.5/5.0
- Appreciation +0.0/10.0
$55,000
🖨 Deal sheet 📄 Offer letter ✓ Due diligence
Listing remarks MLS
Freshly Painted Century Home, spacious open floor plan. Two full baths. All three bedrooms on 2nd floor with a full bath. Roof, furnace, and A/C unit are all replaced about 2005, updated electrical panel.
Key facts
- Alley access
- Deep lot
- Full basement
Tags
Property features AI
Exterior
- Parking: Attached garage; One garage space
- Utilities: Public water; Public sewer
- Home design: Two-story home; Shingle roof; Wood siding construction
- Construction: Built (year source: public records)
- Exterior features: Alley access
Interior
- Bathrooms: Two full bathrooms; One main-level bathroom
- Heating & cooling: Forced air heating; Central air conditioning
- Interior features: Full basement; One fireplace
Neighborhood map
What this means for you Summary
Snapshot
- This is a 3-bed/2.0-bath single-family listed at $55k.
Deal economics
- At list price, monthly cash flow is $565 ($7k/yr) — positive.
- The deal already cash-flows at list — no discount required.
- Meets the 1% rule at list price ($1k rent vs $55k).
- Cap rate 18.6% vs local median 3.9% in Massillon — top-decile yield for the area; either an underpriced asset or a hidden risk that comps aren't pricing in. Stress-test before assuming the spread holds.
Location & tenants
- Location reads 74/100 on livability (#306 in OH, #4,928 nationally) — a middle-class / working-renter tenant base. Strengths: cost of living A+, housing A+, health & safety A-; Watch: employment C-, amenities F, commute F.
- Massillon City (urban): math 43% / reading 52% proficiency, ranked #487 of 656 in OH (top 74%) — families likely to look elsewhere, expect single-tenant / working-renter base with shorter leases; 60% free/reduced lunch — lower-income household profile, screen leases tightly.
- Market conditions: Rents rising fast (+6.0%/yr); 208 active listings in the ZIP; 5 comparable units currently listed for rent nearby; rentals at typical pace (median 14d on market — plan ~3-4 weeks tenant-placement turnaround); 40% of comp listings sitting > 30 days — soft ceiling on asking rent; 528 units permitted in Stark County in 2024 (84 in 5+ unit buildings).
Forward outlook
- Local home prices are declining (-3.0%/yr); year-one equity from $380 of loan paydown is wiped out by about $2k of value loss. Plan a longer hold.
- Stark County population projected to shrink 8% by 2050 — rents likely to lag national; underwrite the cash flow, not the appreciation.
- At projected returns (-3.0% appreciation + 6.0% rent growth), your $15k cash investment doubles in ~3 years — after that, you're playing with house money.
Negotiation context
- Only 9 days on market — expect competitive offers; lowballing is unlikely to land.
- 8 sale attempts since 27y ago; this cycle's ask has dropped $24k (30%) from the opening price — seller is motivated, your offer sets the floor, not the list.
- Current owner paid $27k; list at $55k implies a 104% gain — meaningful room to come down on a strong offer.
Risks & watch-outs
- Watch-outs: built in 1894 — expect roof / HVAC / electrical / plumbing capex.
Questions for the listing agent
- Built in 1894 — when were the roof, HVAC, electrical panel, plumbing, and water heater last replaced?
- Is there a deadline driving the sale (1031 exchange, divorce, estate, relocation)? That informs how much negotiation room exists.
- Schools are B-rated — typically a magnet for longer-tenancy family renters. What's the average tenant stay here, and is there a school-zone premium baked into asking?
- What's the average days-on-market for RENTAL listings here right now (not sales)? A rising rental-DOM trend means longer vacancies and softer asking-rent achievability than the comps imply.
- What's the recent tenant-quality profile in this submarket — average credit score on applications, eviction rate, late-payment / NSF rate, and stable-employment percentage? A property-management company in the area should have these aggregated.
- How much new for-sale + rental construction is in the pipeline within 1–3 miles? Heavy new supply typically softens prices + rents 12–24 months out; constrained supply supports both.
Investment metrics
- 1% rule
- 2.26% ✓
- Cap rate
- 18.63%
- Cash-on-cash
- 44.05%
- DSCR
- 2.96
- GRM
- 3.7
CMA / ARV
- ARV (on-the-fly)
- $165,444
- Comps found
- 12
Show comp detail 12 sales within ~0.75 mi
| Address | Dist | Beds/Ba | Sqft | Sold | Price | $/sf | Match |
|---|---|---|---|---|---|---|---|
| 815 Amherst Rd NE | 0.00mi | 3/2.0 | 1,622 (0%) | 0mo | $45,000 | $28 | 100 |
| 1110 2nd St NE | 0.44mi | 3/2.0 | 1,632 (+1%) | 3mo | $239,900 | $147 | 76 |
| 64 10th St SE | 0.63mi | 3/2.0 | 1,646 (+2%) | 2mo | $75,000 | $46 | 67 |
| 416 3rd St NE | 0.27mi | 4/3.0 (+1) | 1,716 (+6%) | 3mo | $175,000 | $102 | 66 |
| 111 9th St NE | 0.42mi | 3/1.5 | 1,745 (+8%) | 0mo | $162,000 | $93 | 66 |
| 183 Mccadden Ave NE | 0.52mi | 3/2.0 | 1,515 (-7%) | 1mo | $218,000 | $144 | 64 |
| 121 Chestnut Ave NE | 0.40mi | 3/1.0 | 1,456 (-10%) | 1mo | $83,000 | $57 | 60 |
| 23 Willard Ave NE | 0.33mi | 3/1.0 | 1,424 (-12%) | 1mo | $74,200 | $52 | 59 |
| 1432 Keuper Blvd NE | 0.61mi | 3/3.0 | 1,500 (-8%) | 1mo | $240,000 | $160 | 54 |
| 842 Seneca St NE | 0.33mi | 2/2.0 (-1) | 1,378 (-15%) | 0mo | $173,650 | $126 | 54 |
| 1221 North Ave NE | 0.58mi | 3/1.5 | 1,450 (-11%) | 2mo | $115,000 | $79 | 52 |
| 1309 11th St NE | 0.65mi | 3/2.5 | 1,864 (+15%) | 3mo | $370,000 | $198 | 40 |
Match score weights: distance 35% · size 25% · config 20% · recency 20%. Top-matched comps best support the ARV.
Projected returns pro-forma
-3.0% appreciation · 6.04% rent growth · sell at horizon
- IRR
- 44.6%
- Equity multiple
- 3.02×
- Total profit
- $31,053
- Equity at exit
- $8,201
- IRR
- 51.9%
- Equity multiple
- 6.89×
- Total profit
- $90,696
- Equity at exit
- $4,755
Cash invested: $15,400 (down + closing). Projections, not guarantees.
Landlord ↔ Tenant lean methodology
- Overall (STATE)
- 73 Landlord-Friendly
- State Ohio
- 73 Landlord-Friendly · R+6
- County
- — inherits STATE
- City
- — inherits STATE
ZIP-level market 44646
- Rents YoY
- 6.0%
- Active inventory
- 208
- Price-to-rent
- 3.7×
Monthly cashflow live
- Estimated rent
- $1,244 high interval (Pro) →
- Mortgage (P&I)
- −$288
- Tax from tax record
- −$106 /mo · $1,274/yr
- Insurance
- −$23
- HOA
- −$0
- Vacancy / Maint / Mgmt
- −$261
- Net cashflow
- $565
Break-even live
UW: 25.0% down · 7.5% · 30yr · 1.5% tax · 5.0% vac · 8.0% maint · 8.0% mgmt
Financing live
Cash to close
- Down payment
- $13,750
- Closing costs
- $1,650
- Reserves months
- —
- Total cash needed
- —
Loan-product check · same deal, 3 products live
Conventional
25% down · 7.5% · 30yr
- Down + closing
- —
- Monthly P&I
- —
- Monthly cashflow
- —
- DSCR
- —
- Eligible?
- —
Personal DTI + credit; lowest rate.
DSCR
20% down · 8.5% · 30yr
- Down + closing
- —
- Monthly P&I
- —
- Monthly cashflow
- —
- DSCR
- —
- Eligible?
- —
No personal income docs; deal must DSCR.
Hard money
10% down · 12.0% · 12mo
- Down + closing
- —
- Monthly P&I
- —
- Monthly cashflow
- —
- DSCR
- —
- Eligible?
- —
Short-term bridge; refi at stabilization.
Rent comps 5 comps
| Address | Beds | Baths | Sqft | Rent | $/sqft | DOM | Units | Dist |
|---|---|---|---|---|---|---|---|---|
| 311 Gail Ave NE Unit 325 Massillon, OH | 2.0 | 2.0 | 1082 | $1,095 | $1.01 | 14d | 1 | 0.60mi |
| 450 South Ave SE Massillon, OH | 2.0 | 1.5 | 1270 | $1,236 | $0.97 | 14d | 1 | 0.79mi |
| 709 3rd St SE Massillon, OH | 4.0 | 1.5 | 1233 | $1,300 | $1.05 | 44d | 1 | 1.07mi |
| 111 Maple Ave SE Massillon, OH | 3.0 | 1.0 | 1300 | $1,050 | $0.81 | 14d | 1 | 1.24mi |
| 1040 Stuart St NW Massillon, OH | 3.0 | 2.0 | 1870 | $1,595 | $0.85 | 44d | 1 | 1.48mi |
Listing history 26 events
-
2026-06-02status $55,000 Pending 9 DOM
-
2026-06-01days on market $55,000 Active 9 DOM
-
2026-05-31days on market $55,000 Active 8 DOM
-
2026-05-30days on market $55,000 Active 7 DOM
-
2026-05-23$79,000 Active
-
2017-07-12soldstatus $27,000 Sold 204-char remark
Show marketing remark (204 chars)
Freshly Painted Century Home, spacious open floor plan. Two full baths. All three bedrooms on 2nd floor with a full bath. Roof, furnace, and A/C unit are all replaced about 2005, updated electrical panel.
-
2017-06-16status Pending 204-char remark
Show marketing remark (204 chars)
Freshly Painted Century Home, spacious open floor plan. Two full baths. All three bedrooms on 2nd floor with a full bath. Roof, furnace, and A/C unit are all replaced about 2005, updated electrical panel.
-
2017-06-14price $29,500 204-char remark
Show marketing remark (204 chars)
Freshly Painted Century Home, spacious open floor plan. Two full baths. All three bedrooms on 2nd floor with a full bath. Roof, furnace, and A/C unit are all replaced about 2005, updated electrical panel.
-
2017-05-20price $34,000 204-char remark
Show marketing remark (204 chars)
Freshly Painted Century Home, spacious open floor plan. Two full baths. All three bedrooms on 2nd floor with a full bath. Roof, furnace, and A/C unit are all replaced about 2005, updated electrical panel.
-
2017-04-09$39,000 Active 204-char remark
Show marketing remark (204 chars)
Freshly Painted Century Home, spacious open floor plan. Two full baths. All three bedrooms on 2nd floor with a full bath. Roof, furnace, and A/C unit are all replaced about 2005, updated electrical panel.
-
2014-08-24historical
-
2013-04-23$53,500
-
2006-07-28soldstatus $88,100
-
2006-07-27soldstatus $88,000
-
2006-05-03$109,876
-
2005-02-11soldstatus $95,000
-
2004-09-10$124,000
-
2001-11-15soldstatus $80,000
-
2000-10-15historical
-
2000-05-17$74,900
-
2000-05-15historical
-
2000-02-03$74,900
-
2000-02-02historical
-
1999-04-02$74,900
-
1993-08-09soldstatus $50,000
-
1989-08-24soldstatus $26,800
ⓘ Source: listings_history table (triggers on properties + properties_extension) + one-shot
backfill from property_details.listing_events for pre-trigger history.
Tax reassessment forecast OH · Partial reset (capped growth)
- Current annual tax
- $1,274 · $106/mo
- Projected year-2 tax
- $1,274 · $106/mo
- Expected delta
- $0/yr ($0/mo · 0.0%)
ⓘ Screening estimate from a state-policy table — verify with the county assessor before closing.
Climate risk First Street
- Flood 1/10 Low FEMA zone X (unshaded) · 0% chance over 30 yrs
- Wildfire 1/10 Low
- Heat 3/10 Moderate 7 d/yr ≥97°F today · 17 d/yr by 30 yrs out
- Wind 1/10 Low
- Air quality 2/10 Low 0 unhealthy d/yr today · 1 by 30 yrs out
Nearby sold comps map
Loading sold comps map…
Walkable amenities ~0.75 mi
Loading nearby amenities…
Taxation est. · year 1
- Rental income
- $14,928
- − Mortgage interest
- −$3,081
- − Property taxes
- −$1,274
- − Insurance
- −$275
- − Repairs & maintenance
- −$1,194
- − Management
- −$1,194
- − Depreciation
- −$1,600
- Taxable income
- $6,310
- Est. tax owed @ 24.0%
- −$1,514
- After-tax cash flow
- $5,269/yr
For passive investors: Depreciation is non-cash, so a rental often shows a tax loss while cash-flowing — sheltering income. Rental losses are passive: they offset passive income freely, and up to $25,000/yr can offset ordinary (W-2) income if you actively participate and your MAGI is under $100k (phasing out to $0 by $150k); unused losses carry forward. On sale, claimed depreciation is recaptured at up to 25%, and gains may owe capital-gains tax (a 1031 exchange can defer both). Figures are a year-1 estimate at your 24.0% rate — not tax advice; consult a CPA.
Schools (NCES district)
- District
- Massillon City
- NCES district ID
- 3904435
- Math proficiency
- 43% ▼ -14.00%
- Reading proficiency
- 52% ▼ -11.00%
- Median HH income
- $38,094
- Composite
- 39.54/100
- National rank
- #3941
- State rank
- #487 of 656 in OH
Livability — Massillon
- Score
- 74/100
- State rank
- #306
- US rank
- #4928
Category grades
Schools grade is shown separately in the Schools card above.
Census & demographics
- Census place
- Massillon, OH
- County
- Stark County · 272,865 people
- City population
- 65,858
- Metro
- Canton-Massillon, OH
- Population (ZIP)
- 47,741
- Household income
- $69,179
- Rent vs Own
- Severe rent burden
- 1011.0
Population outlook (Stark County) Hauer SSP2
- Today (2025)
- 373,708 people
- By 2030
- 371,245 · -0.7%
- By 2040
- 361,331 · -3.3%
- By 2050
- 345,290 · -7.6%
- By 2075
- 302,669 · -19.0%
- By 2100
- 238,870 · -36.1%
Race, ethnicity, and origin ACS 2023
- Neighborhood character
- Predominantly White (86%)
- Race & ethnicity
- White 86% Black 7% Two or more races 5% Hispanic / Latino 3% Asian 1%
- Common ancestry
- Lithuanian 3% Romanian 2% Scandinavian 2%
- Foreign-born
- 2% · Canada, China
- Languages at home
- 97% English-only · Spanish 1% Other Indo-European 1%
Political lean MEDSL · Stark
- 2024 margin
- Strong R (+21.9) · D 38.6% · R 60.5%
- 2008→2024 swing
- -27.4pp toward R · 2008: 5.5pp · 2024: -21.9pp
- All cycles
- 2024: R+21.9 2020: R+18.5 2016: R+17.4 2012: R+0.4 2008: D+5.5
Not yet ingested
- Civics
- —
Market trends
- HPI YoY
- ▼ -190.31%
- Current HPI
- 217.8955
- Rent YoY
- ▲ 6.04%
- Metro
- Canton-Massillon, OH
- State GDP YoY
- ▲ 1.98%
- F500 in state
- 48
Industry mix (Fortune 500 HQ in OH)
| Industry | F500 HQs | Revenue |
|---|---|---|
| Insurance | 3 | $145B |
|
||
| Industrial Machinery | 3 | $49B |
|
||
| Financial Services | 3 | $24B |
|
||
| Consumer Goods | 2 | $93B |
|
||
| Aerospace / Defense | 2 | $47B |
|
||
| Utilities | 2 | $33B |
|
||
Price history
+194.8% since first listed22 events — show timeline
- 2026-05-23 Listed $79,000 MLSNOW
- 2017-07-12 Sold (MLS) $27,000 MLSNOW
- 2017-06-16 Pending — MLSNOW
- 2017-06-14 Price Changed $29,500 MLSNOW
- 2017-05-20 Price Changed $34,000 MLSNOW
- 2017-04-09 Listed $39,000 MLSNOW
- 2014-08-24 Listing Removed — MLSNOW
- 2013-04-23 Listed $53,500 MLSNOW
- 2006-07-28 Sold (Public Records) $88,100 Public Records
- 2006-07-27 Sold (MLS) $88,000 MLSNOW
- 2006-05-03 Listed $109,876 MLSNOW
- 2005-02-11 Sold (MLS) $95,000 MLSNOW
- 2004-09-10 Listed $124,000 MLSNOW
- 2001-11-15 Sold (Public Records) $80,000 Public Records
- 2000-10-15 Listing Removed — MLSNOW
- 2000-05-17 Listed $74,900 MLSNOW
- 2000-05-15 Listing Removed — MLSNOW
- 2000-02-03 Listed $74,900 MLSNOW
- 2000-02-02 Listing Removed — MLSNOW
- 1999-04-02 Listed $74,900 MLSNOW
- 1993-08-09 Sold (Public Records) $50,000 Public Records
- 1989-08-24 Sold (Public Records) $26,800 Public Records
Property tax history
+0.6%/yrLatest (2024): $1,274 · -7.6% YoY. Source: county tax records.
Cash-flow waterfall
monthlySold comps — $/sqft
last 12 mo · ≤1 miLoading sold comps…