6219 S Highway 51 Unit L275 · Janesville, WI
Flood risk No data
- FEMA flood zone
- —
- Chance of flooding over 30 yrs
- —
- Est. flood insurance / yr
- —
Fire risk No data
- Est. fire insurance / yr
- —
Heat risk No data
- Hot days now (above threshold)
- —
- Hot days in 30 yrs
- —
Wind risk No data
- Chance of severe wind over 30 yrs
- —
Air-quality risk No data
- Unhealthy air days now
- —
- Unhealthy air days in 30 yrs
- —
Risk factors via First Street. Map © Google.
Why this score? — see what drove the D grade
The composite is a weighted blend of 9 inputs, each scored 0–100. Each bar is that input's sub-score; the figure is the points it added to the 100-point composite (weight × sub-score).
- Cash flow +15.0/30.0
- ARV discount +7.5/15.0
- 1% rule +5.0/10.0
- DSCR +5.0/10.0
- Livability +3.9/5.0
- Schools +2.8/10.0
- Condition / age +2.8/5.0
- Rent growth +2.5/5.0
- Appreciation +0.0/10.0
$37,500
🖨 Deal sheet 📄 Offer letter ✓ Due diligence
Listing remarks
Move-in ready and priced to sell! This charming 1983 single-wide in friendly, all-ages Rockvale community has been loved and updated where it counts: NEW metal roof ( 4 yrs), newer windows, updated electrical, fresh flooring, and a brand-new shower with transferable lifetime warranty. Cozy 3-bed, 1.5-bath layout ( 1,036 sq ft), forced-air gas heat, two wall A/C units. Bonus: a wired 220V shed/man cave perfect for projects, hobbies or a workshop! Lot rent INCLUDES water, sewer, trash & taxes - no surprise bills here. Pet-friendly park minutes from downtown Janesville, shopping, dining and I-90 for easy commutes. Whether you're a first-time buyer, downsizing, or want a smart low-mainten
Key facts
- Built 1985
- Listed 7 days
Property features AI
Finance
- Other: Zoned residential; Municipality: Town of Rock; School district: Janesville
Exterior
- Parking: Carport
- Utilities: Municipal water; Municipal sewer; Natural gas
- Home design: Single-family home; One-story; Estimated finished above-grade area in the 1001–1250 sq ft range; Built/owned information provided by owner; Located in Rockvale Mobile Home Community
- Construction: Wood exterior
- Exterior features: Deck; Storage building / shed (described as shed/man cave)
Interior
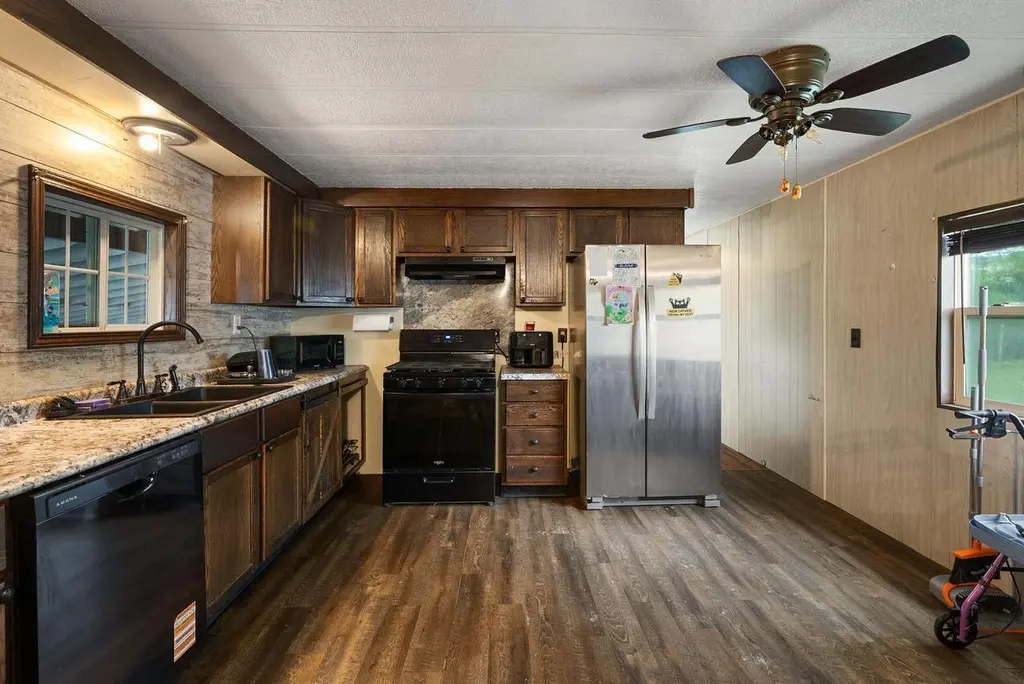
- Kitchen: Range/oven; Refrigerator (replacement provided); Dishwasher; Microwave
- Bedrooms: Master bedroom on main level (13 x 13); Second bedroom on main level (13 x 12); Third bedroom on main level (8 x 11)
- Bathrooms: One full bathroom; One half bathroom; At least one tub; no master bathroom
- Heating & cooling: Forced air heating (natural gas); Wall A/C (two wall units included)
- Interior features: High speed internet
- Laundry & utility: Washer; Dryer (currently on porch; seller may leave a dryer)
Neighborhood map
What this means for you Summary
Snapshot
- This is a 3-bed/1.5-bath single-family listed at $38k. Condition is rated average.
Deal economics
- At list price, monthly cash flow is $1k ($13k/yr) — positive.
- The deal already cash-flows at list — no discount required.
- Meets the 1% rule at list price ($2k rent vs $38k).
- Cap rate 40.8% vs local median 2.7% in Janesville — top-decile yield for the area; either an underpriced asset or a hidden risk that comps aren't pricing in. Stress-test before assuming the spread holds.
Location & tenants
- Location reads 78/100 on livability (#101 in WI, #2,663 nationally) — a middle-class / working-renter tenant base. Strengths: cost of living A+, housing A+, health & safety A+; Watch: amenities D, commute F.
- Janesville School District (urban): math 31% / reading 35% proficiency, ranked #254 of 342 in WI (top 74%) — families likely to look elsewhere, expect single-tenant / working-renter base with shorter leases.
- Market conditions: 49 active listings in the ZIP; solid renter incomes; 629 units permitted in Rock County in 2024 (263 in 5+ unit buildings).
Forward outlook
- Local home prices are declining (-3.0%/yr); year-one equity from $259 of loan paydown is wiped out by about $1k of value loss. Plan a longer hold.
- Rock County population projected to shrink 7% by 2050 — rents likely to lag national; underwrite the cash flow, not the appreciation.
- At projected returns (-3.0% appreciation + 3.0% rent growth), your $10k cash investment doubles in ~1 year — after that, you're playing with house money.
Negotiation context
- Only 8 days on market — expect competitive offers; lowballing is unlikely to land.
Questions for the listing agent
- Is there a deadline driving the sale (1031 exchange, divorce, estate, relocation)? That informs how much negotiation room exists.
- The area grade is low — what's the realistic commute time and amenity access for the typical tenant pool here? Any planned neighborhood developments (good or bad) we should know about?
- What's the average days-on-market for RENTAL listings here right now (not sales)? A rising rental-DOM trend means longer vacancies and softer asking-rent achievability than the comps imply.
- What's the recent tenant-quality profile in this submarket — average credit score on applications, eviction rate, late-payment / NSF rate, and stable-employment percentage? A property-management company in the area should have these aggregated.
- How much new for-sale + rental construction is in the pipeline within 1–3 miles? Heavy new supply typically softens prices + rents 12–24 months out; constrained supply supports both.
Investment metrics
- 1% rule
- 4.51% ✓
- Cap rate
- 40.79%
- Cash-on-cash
- 123.19%
- DSCR
- 6.48
- GRM
- 1.8
CMA / ARV
- ARV (on-the-fly)
- $205,128
- Comps found
- 1
Show comp detail 1 sale within ~0.75 mi
| Address | Dist | Beds/Ba | Sqft | Sold | Price | $/sf | Match |
|---|---|---|---|---|---|---|---|
| 6116 S U.s. Highway 51 | 0.13mi | 2/1.0 (-1) | 1,008 (-3%) | 5mo | $200,000 | $198 | 78 |
Match score weights: distance 35% · size 25% · config 20% · recency 20%. Top-matched comps best support the ARV.
Projected returns pro-forma
-3.0% appreciation · 3.0% rent growth · sell at horizon
- IRR
- —
- Equity multiple
- 6.96×
- Total profit
- $62,601
- Equity at exit
- $5,591
- IRR
- —
- Equity multiple
- 14.62×
- Total profit
- $143,017
- Equity at exit
- $3,242
Cash invested: $10,500 (down + closing). Projections, not guarantees.
Landlord ↔ Tenant lean methodology
- Overall (STATE)
- 73 Landlord-Friendly
- State Wisconsin
- 73 Landlord-Friendly · R+2
- County
- — inherits STATE
- City
- — inherits STATE
ZIP-level market 53546
- Active inventory
- 49
- Price-to-rent
- 1.8×
Monthly cashflow live
- Estimated rent
- $1,692 medium interval (Pro) →
- Mortgage (P&I)
- −$197
- Tax est. 1.5%
- −$47 /mo · $562/yr
- Insurance
- −$16
- HOA
- −$0
- Vacancy / Maint / Mgmt
- −$355
- Net cashflow
- $1,078
Break-even live
UW: 25.0% down · 7.5% · 30yr · 1.5% tax · 5.0% vac · 8.0% maint · 8.0% mgmt
Financing live
Cash to close
- Down payment
- $9,375
- Closing costs
- $1,125
- Reserves months
- —
- Total cash needed
- —
Loan-product check · same deal, 3 products live
Conventional
25% down · 7.5% · 30yr
- Down + closing
- —
- Monthly P&I
- —
- Monthly cashflow
- —
- DSCR
- —
- Eligible?
- —
Personal DTI + credit; lowest rate.
DSCR
20% down · 8.5% · 30yr
- Down + closing
- —
- Monthly P&I
- —
- Monthly cashflow
- —
- DSCR
- —
- Eligible?
- —
No personal income docs; deal must DSCR.
Hard money
10% down · 12.0% · 12mo
- Down + closing
- —
- Monthly P&I
- —
- Monthly cashflow
- —
- DSCR
- —
- Eligible?
- —
Short-term bridge; refi at stabilization.
Listing history 8 events
-
2026-06-19days on market $37,500 Active 8 DOM
-
2026-06-18days on market $37,500 Active 7 DOM
-
2026-06-17days on market $37,500 Active 6 DOM
-
2026-06-16days on market $37,500 Active 5 DOM
-
2026-06-15days on market $37,500 Active 4 DOM
-
2026-06-14days on market $37,500 Active 2 DOM
-
2026-06-13remarks 695-char remark
-
2026-06-13$37,500 Active 1 DOM
ⓘ Source: listings_history table (triggers on properties + properties_extension) + one-shot
backfill from property_details.listing_events for pre-trigger history.
Nearby sold comps map
Loading sold comps map…
Walkable amenities ~0.75 mi
Loading nearby amenities…
Taxation est. · year 1
- Rental income
- $20,310
- − Mortgage interest
- −$2,101
- − Property taxes
- −$562
- − Insurance
- −$188
- − Repairs & maintenance
- −$1,625
- − Management
- −$1,625
- − Depreciation
- −$1,091
- Taxable income
- $13,119
- Est. tax owed @ 24.0%
- −$3,148
- After-tax cash flow
- $9,786/yr
For passive investors: Depreciation is non-cash, so a rental often shows a tax loss while cash-flowing — sheltering income. Rental losses are passive: they offset passive income freely, and up to $25,000/yr can offset ordinary (W-2) income if you actively participate and your MAGI is under $100k (phasing out to $0 by $150k); unused losses carry forward. On sale, claimed depreciation is recaptured at up to 25%, and gains may owe capital-gains tax (a 1031 exchange can defer both). Figures are a year-1 estimate at your 24.0% rate — not tax advice; consult a CPA.
Condition & rehab AI · 13 photos
The home is in average condition with some wear and tear. It requires minor repairs and maintenance, but has good systems and a good roof. Upgrades to the interior walls and landscaping would significantly increase its value.
Repairs flagged
- Minor paint peeling on interior walls — Peeling paint indicates wear and tear
- Moderate landscaping — Some landscaping needs attention
Value-add opportunities
- Both painting interior walls — Fresh paint enhances curb appeal and interior aesthetics
- Both landscaping — Improved landscaping increases curb appeal and property value
Renovation cost estimate screening
| Repair item | Severity | Est. cost |
|---|---|---|
| paint peeling on interior walls · Peeling paint indicates wear and tear | Minor | $500–3,000 |
| landscaping · Some landscaping needs attention | Moderate | $3,000–15,000 |
| Total estimated repair cost · 2 items | $3,500–18,000 |
Value-add ROI direction
- Both painting interior walls — Fresh paint enhances curb appeal and interior aesthetics ↑
- Both landscaping — Improved landscaping increases curb appeal and property value ↑
ⓘ Cost ranges are severity-bucket heuristics (US national rule-of-thumb). Get contractor quotes + a written scope before underwriting a rehab budget.
Schools (NCES district)
- District
- Janesville School District
- NCES district ID
- 5507020
- Math proficiency
- 31% ▼ -3.00%
- Reading proficiency
- 35% ▼ -4.00%
- Median HH income
- $47,805
- Composite
- 28.47/100
- National rank
- #6744
- State rank
- #254 of 342 in WI
Livability — Janesville
- Score
- 78/100
- State rank
- #101
- US rank
- #2663
Category grades
Schools grade is shown separately in the Schools card above.
Census & demographics
- County
- Rock County · 135,428 people
- City population
- 44,619
- Metro
- Janesville-Beloit, WI
- Population (ZIP)
- 29,867
- Household income
- $75,825
- Rent vs Own
- Severe rent burden
- 778.0
Population outlook (Rock County) Hauer SSP2
- Today (2025)
- 163,403 people
- By 2030
- 162,815 · -0.4%
- By 2040
- 158,655 · -2.9%
- By 2050
- 151,235 · -7.4%
- By 2075
- 131,901 · -19.3%
- By 2100
- 108,665 · -33.5%
Race, ethnicity, and origin ACS 2023
- Neighborhood character
- Predominantly White (85%)
- Race & ethnicity
- White 85% Hispanic / Latino 8% Two or more races 6% Asian 1% Black 1%
- Hispanic origin (detail)
- Mexican 7%
- Common ancestry
- Portuguese 11% Romanian 4% Iranian 2%
- Foreign-born
- 3% · Canada, China
- Languages at home
- 92% English-only · Spanish 6% Other Indo-European 1%
Political lean MEDSL · Rock
- 2024 margin
- Lean D (+7.3) · D 52.9% · R 45.6% · Other 1.4%
- 2008→2024 swing
- -22.0pp toward R · 2008: 29.3pp · 2024: 7.3pp
- All cycles
- 2024: D+7.3 2020: D+11.2 2016: D+10.5 2012: D+23.2 2008: D+29.3
Not yet ingested
- Civics
- —
Market trends
- HPI YoY
- ▼ -287.36%
- Current HPI
- 249.6436
- Rent YoY
- —
- Metro
- Janesville-Beloit, WI
- State GDP YoY
- ▲ 2.10%
- F500 in state
- 20
Industry mix (Fortune 500 HQ in WI)
| Industry | F500 HQs | Revenue |
|---|---|---|
| Industrial Machinery | 4 | $23B |
|
||
| Industrial Technology | 2 | $36B |
|
||
| Insurance | 1 | $36B |
|
||
| Professional Services | 1 | $19B |
|
||
| Utilities | 1 | $9B |
|
||
| Consumer Goods | 1 | $3B |
|
||
Price history
1 event — show timeline
- 2026-06-11 Listed $37,500 SCWMLS
Cash-flow waterfall
monthlySold comps — $/sqft
last 12 mo · ≤1 miLoading sold comps…