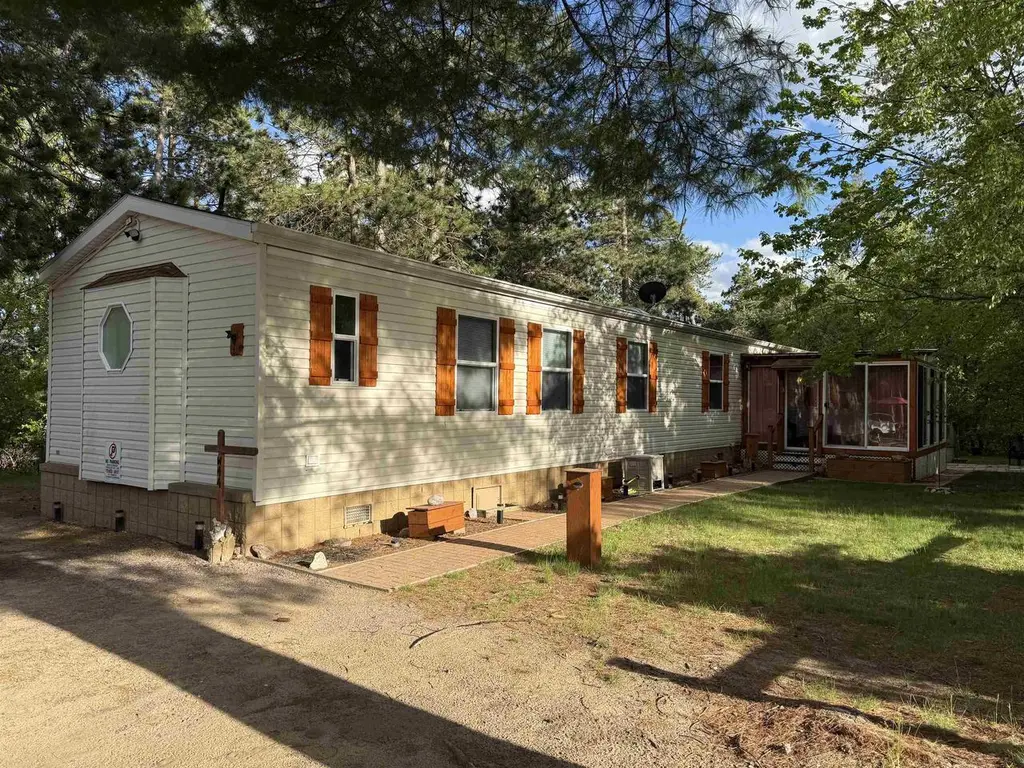
1770 Wisconsin Dells Pkwy Unit L · Lake Delton, WI
Flood risk No data
- FEMA flood zone
- —
- Chance of flooding over 30 yrs
- —
- Est. flood insurance / yr
- —
Fire risk No data
- Est. fire insurance / yr
- —
Heat risk No data
- Hot days now (above threshold)
- —
- Hot days in 30 yrs
- —
Wind risk No data
- Chance of severe wind over 30 yrs
- —
Air-quality risk No data
- Unhealthy air days now
- —
- Unhealthy air days in 30 yrs
- —
Risk factors via First Street. Map © Google.
Why this score? — see what drove the B- grade
The composite is a weighted blend of 9 inputs, each scored 0–100. Each bar is that input's sub-score; the figure is the points it added to the 100-point composite (weight × sub-score).
- Cash flow +30.0/30.0
- 1% rule +10.0/10.0
- DSCR +10.0/10.0
- ARV discount +7.5/15.0
- Livability +3.9/5.0
- Schools +3.6/10.0
- Rent growth +2.5/5.0
- Condition / age +2.2/5.0
- Appreciation +0.0/10.0
$105,000
🖨 Deal sheet 📄 Offer letter ✓ Due diligence
Listing remarks MLS
Motivated Sellers. .. Charming 3 bed, 2 bath single-wide Manufacture Home in Bonanza Campground! Nestled in the heart of Wisconsin Dells across from Mt. Olympus, this fully furnished home features a bright 3-season porch, brick patio, shed, and fresh updates throughout home. Enjoy resort-style amenities including a heated pool, basketball court, playground, and endless outdoor fun. This home can be a full time residency or just a weekend getaway. Lot Rent is $950.00 subject to change.
Key facts
- Brick patio
- Basketball court
- Heated pool
Tags
Property features AI
Finance
- Other: Estimated finished living area approximately 1,501–1,750 sq. ft. (about 1,580 above grade); Includes shed, refrigerator, oven/stove, microwave, and dishwasher
Exterior
- Utilities: Municipal water; Municipal sewer; Electric service
- Home design: Single-family property; One story; Entry level: Main; Zoned residential
- Construction: Built: Other (see remarks)
- Exterior features: Screened porch; Deck; Patio; Storage building (outbuilding); Vinyl exterior
Interior
- Kitchen: Kitchen with breakfast bar, pantry, and island
- Bedrooms: Master bedroom (Main) — 15 x 12; Bedroom 2 (Main) — 11 x 11; Bedroom 3 (Main) — 10 x 9
- Bathrooms: 2 full bathrooms; Master bathroom includes a walk-in shower and tub (master bath/full)
- Heating & cooling: Forced air heating; Central air conditioning; LP gas fuel
- Interior features: Skylights; Cable/satellite available; Screened porch
- Laundry & utility: Washer and dryer included; Freezer included
Neighborhood map
What this means for you Summary
Snapshot
- This is a 3-bed/2.0-bath single-family listed at $105k. Condition is rated fair.
Deal economics
- At list price, monthly cash flow is $658 ($8k/yr) — positive.
- The deal already cash-flows at list — no discount required.
- Meets the 1% rule at list price ($2k rent vs $105k).
- Cap rate 13.8% vs local median 2.1% in Lake Delton — top-decile yield for the area; either an underpriced asset or a hidden risk that comps aren't pricing in. Stress-test before assuming the spread holds.
Location & tenants
- Location reads 77/100 on livability (#120 in WI, #3,121 nationally) — a middle-class / working-renter tenant base. Strengths: crime A+, cost of living A+, housing A+; Watch: health & safety D, commute F.
- Wisconsin Dells School District (town): math 44% / reading 40% proficiency, ranked #135 of 342 in WI (top 40%) — families likely to look elsewhere, expect single-tenant / working-renter base with shorter leases.
- Zoned schools: Wisconsin Dells High (math 17% / reading 27%, grade F, #349 of 483 statewide, top 75%, 603 students, 48% FRL).
- Zoned-school proficiency averages 22% at this address vs 42% district-wide (-20 pts) — the specific schools serving this property underperform the Wisconsin Dells School District average; the district grade overstates school quality for this exact location.
- Market conditions: 195 active listings in the ZIP; 527 units permitted in Sauk County in 2024 (268 in 5+ unit buildings).
- This rent runs 32% of the median local income ($67k/yr) — at the standard rent-burdened threshold; future hikes will face affordability resistance.
Forward outlook
- Local home prices are declining (-3.0%/yr); year-one equity from $726 of loan paydown is wiped out by about $3k of value loss. Plan a longer hold.
- At projected returns (-3.0% appreciation + 3.0% rent growth), your $29k cash investment doubles in ~5 years — after that, you're playing with house money.
Negotiation context
- Only 11 days on market — expect competitive offers; lowballing is unlikely to land.
- 3 sale attempts with the ask held roughly flat each time — persistent listings suggest the price (not the market) is what's stuck; bring a comps-based counter.
Questions for the listing agent
- Have any recent inspections been done? Can we get a copy of the seller's disclosures and any deferred-maintenance estimates?
- Is there a deadline driving the sale (1031 exchange, divorce, estate, relocation)? That informs how much negotiation room exists.
- What's the average days-on-market for RENTAL listings here right now (not sales)? A rising rental-DOM trend means longer vacancies and softer asking-rent achievability than the comps imply.
- What's the recent tenant-quality profile in this submarket — average credit score on applications, eviction rate, late-payment / NSF rate, and stable-employment percentage? A property-management company in the area should have these aggregated.
- How much new for-sale + rental construction is in the pipeline within 1–3 miles? Heavy new supply typically softens prices + rents 12–24 months out; constrained supply supports both.
Investment metrics
- 1% rule
- 1.67% ✓
- Cap rate
- 13.82%
- Cash-on-cash
- 26.87%
- DSCR
- 2.20
- GRM
- 5.0
CMA / ARV
- ARV (on-the-fly)
- $886,380
- Comps found
- 1
Show comp detail 1 sale within ~0.75 mi
| Address | Dist | Beds/Ba | Sqft | Sold | Price | $/sf | Match |
|---|---|---|---|---|---|---|---|
| 786 E Hiawatha Dr | 0.61mi | 3/2.0 | 1,604 (+2%) | 21mo | $900,000 | $561 | 52 |
Match score weights: distance 35% · size 25% · config 20% · recency 20%. Top-matched comps best support the ARV.
Projected returns pro-forma
-3.0% appreciation · 3.0% rent growth · sell at horizon
- IRR
- 20.8%
- Equity multiple
- 1.85×
- Total profit
- $24,939
- Equity at exit
- $15,656
- IRR
- 29.0%
- Equity multiple
- 3.58×
- Total profit
- $75,812
- Equity at exit
- $9,078
Cash invested: $29,400 (down + closing). Projections, not guarantees.
Landlord ↔ Tenant lean methodology
- Overall (STATE)
- 73 Landlord-Friendly
- State Wisconsin
- 73 Landlord-Friendly · R+2
- County
- — inherits STATE
- City
- — inherits STATE
ZIP-level market 53965
- Active inventory
- 195
- Price-to-rent
- 5.0×
Monthly cashflow live
- Estimated rent
- $1,752 medium interval (Pro) →
- Mortgage (P&I)
- −$551
- Tax est. 1.5%
- −$131 /mo · $1,575/yr
- Insurance
- −$44
- HOA
- −$0
- Vacancy / Maint / Mgmt
- −$368
- Net cashflow
- $658
Break-even live
UW: 25.0% down · 7.5% · 30yr · 1.5% tax · 5.0% vac · 8.0% maint · 8.0% mgmt
Financing live
Cash to close
- Down payment
- $26,250
- Closing costs
- $3,150
- Reserves months
- —
- Total cash needed
- —
Loan-product check · same deal, 3 products live
Conventional
25% down · 7.5% · 30yr
- Down + closing
- —
- Monthly P&I
- —
- Monthly cashflow
- —
- DSCR
- —
- Eligible?
- —
Personal DTI + credit; lowest rate.
DSCR
20% down · 8.5% · 30yr
- Down + closing
- —
- Monthly P&I
- —
- Monthly cashflow
- —
- DSCR
- —
- Eligible?
- —
No personal income docs; deal must DSCR.
Hard money
10% down · 12.0% · 12mo
- Down + closing
- —
- Monthly P&I
- —
- Monthly cashflow
- —
- DSCR
- —
- Eligible?
- —
Short-term bridge; refi at stabilization.
Listing history 8 events
-
2026-06-14days on market $105,000 Active 11 DOM
-
2026-06-12days on market $105,000 Active 10 DOM
-
2026-06-09days on market $105,000 Active 7 DOM
-
2026-06-08days on market $105,000 Active 6 DOM
-
2026-06-07days on market $105,000 Active 5 DOM
-
2026-06-05days on market $105,000 Active 2 DOM
-
2026-06-03remarks 467-char remark
-
2026-06-03$105,000 Active 1 DOM
ⓘ Source: listings_history table (triggers on properties + properties_extension) + one-shot
backfill from property_details.listing_events for pre-trigger history.
Nearby sold comps map
Loading sold comps map…
Walkable amenities ~0.75 mi
Loading nearby amenities…
Taxation est. · year 1
- Rental income
- $21,022
- − Mortgage interest
- −$5,882
- − Property taxes
- −$1,575
- − Insurance
- −$525
- − Repairs & maintenance
- −$1,682
- − Management
- −$1,682
- − Depreciation
- −$3,055
- Taxable income
- $6,622
- Est. tax owed @ 24.0%
- −$1,589
- After-tax cash flow
- $6,310/yr
For passive investors: Depreciation is non-cash, so a rental often shows a tax loss while cash-flowing — sheltering income. Rental losses are passive: they offset passive income freely, and up to $25,000/yr can offset ordinary (W-2) income if you actively participate and your MAGI is under $100k (phasing out to $0 by $150k); unused losses carry forward. On sale, claimed depreciation is recaptured at up to 25%, and gains may owe capital-gains tax (a 1031 exchange can defer both). Figures are a year-1 estimate at your 24.0% rate — not tax advice; consult a CPA.
Condition & rehab AI · 12 photos
This single-wide manufactured home requires a moderate level of rehabilitation, primarily focusing on painting and interior wall updates. The home is located in a resort setting with amenities, making it suitable for both full-time residency and weekend getaways.
Repairs flagged
- Major paint — paint appears faded and needs touch-up
- Major interior walls — paint appears faded and needs touch-up
Value-add opportunities
- Resale paint job — Fresh paint can significantly improve the home's curb appeal and value
- Resale interior wall updates — Fresh paint can significantly improve the home's curb appeal and value
- Both landscaping — Landscaping can enhance curb appeal and attract more potential buyers/renters
Renovation cost estimate screening
| Repair item | Severity | Est. cost |
|---|---|---|
| paint · paint appears faded and needs touch-up | Major | $15,000–50,000 |
| interior walls · paint appears faded and needs touch-up | Major | $15,000–50,000 |
| Total estimated repair cost · 2 items | $30,000–100,000 |
Value-add ROI direction
- Resale paint job — Fresh paint can significantly improve the home's curb appeal and value ↑
- Resale interior wall updates — Fresh paint can significantly improve the home's curb appeal and value ↑
- Both landscaping — Landscaping can enhance curb appeal and attract more potential buyers/renters ↑
ⓘ Cost ranges are severity-bucket heuristics (US national rule-of-thumb). Get contractor quotes + a written scope before underwriting a rehab budget.
Schools (NCES district)
- District
- Wisconsin Dells School District
- NCES district ID
- 5517040
- Math proficiency
- 44% ▼ -1.00%
- Reading proficiency
- 40% ▲ 1.00%
- Median HH income
- $47,233
- Composite
- 35.91/100
- National rank
- #4810
- State rank
- #135 of 342 in WI
Livability — Lake Delton
- Score
- 77/100
- State rank
- #120
- US rank
- #3121
Category grades
Schools grade is shown separately in the Schools card above.
Census & demographics
- Census place
- Lake Delton, WI
- County
- Adams County · 10,818 people
- Metro
- Madison, WI
- Population (ZIP)
- 10,818
- Household income
- $66,667
- Rent vs Own
- Severe rent burden
- 220.0
Population outlook (Sauk County) Hauer SSP2
- Today (2025)
- 66,065 people
- By 2030
- 66,755 · +1.0%
- By 2040
- 66,999 · +1.4%
- By 2050
- 65,499 · -0.9%
- By 2075
- 60,000 · -9.2%
- By 2100
- 51,070 · -22.7%
Race, ethnicity, and origin ACS 2023
- Neighborhood character
- Predominantly White (83%)
- Race & ethnicity
- White 83% Hispanic / Latino 9% Two or more races 5% Black 3% Native American 2%
- Hispanic origin (detail)
- Mexican 5%
- Common ancestry
- Portuguese 10% Romanian 5% Lithuanian 2%
- Foreign-born
- 7% · Canada, Jamaica
- Languages at home
- 90% English-only · Spanish 6% Russian/Polish/Slavic 2%
Political lean MEDSL · Sauk
- 2024 margin
- Toss-up / Even · D 48.4% · R 50.0% · Other 1.6%
- 2008→2024 swing
- -23.2pp toward R · 2008: 21.6pp · 2024: -1.7pp
- All cycles
- 2024: R+1.7 2020: D+1.7 2016: R+0.3 2012: D+18.5 2008: D+21.6
Not yet ingested
- Civics
- —
Market trends
- HPI YoY
- ▼ -148.85%
- Current HPI
- 234.2781
- Rent YoY
- —
- Metro
- Madison, WI
- State GDP YoY
- ▲ 2.10%
- F500 in state
- 20
Industry mix (Fortune 500 HQ in WI)
| Industry | F500 HQs | Revenue |
|---|---|---|
| Industrial Machinery | 4 | $23B |
|
||
| Industrial Technology | 2 | $36B |
|
||
| Insurance | 1 | $36B |
|
||
| Professional Services | 1 | $19B |
|
||
| Utilities | 1 | $9B |
|
||
| Consumer Goods | 1 | $3B |
|
||
Price history
-24.5% since first listed10 events — show timeline
- 2026-06-02 Listed $105,000 SCWMLS
- 2025-08-29 Sold (MLS) — SCWMLS
- 2025-07-01 Pending — SCWMLS
- 2025-06-30 Relisted — SCWMLS
- 2025-06-29 Pending — SCWMLS
- 2025-06-26 Price Changed $89,900 SCWMLS
- 2025-06-18 Price Changed $98,900 SCWMLS
- 2025-06-13 Price Changed $99,000 SCWMLS
- 2025-06-04 Price Changed $129,000 SCWMLS
- 2025-05-31 Listed $139,000 SCWMLS
Cash-flow waterfall
monthlySold comps — $/sqft
last 12 mo · ≤1 miLoading sold comps…