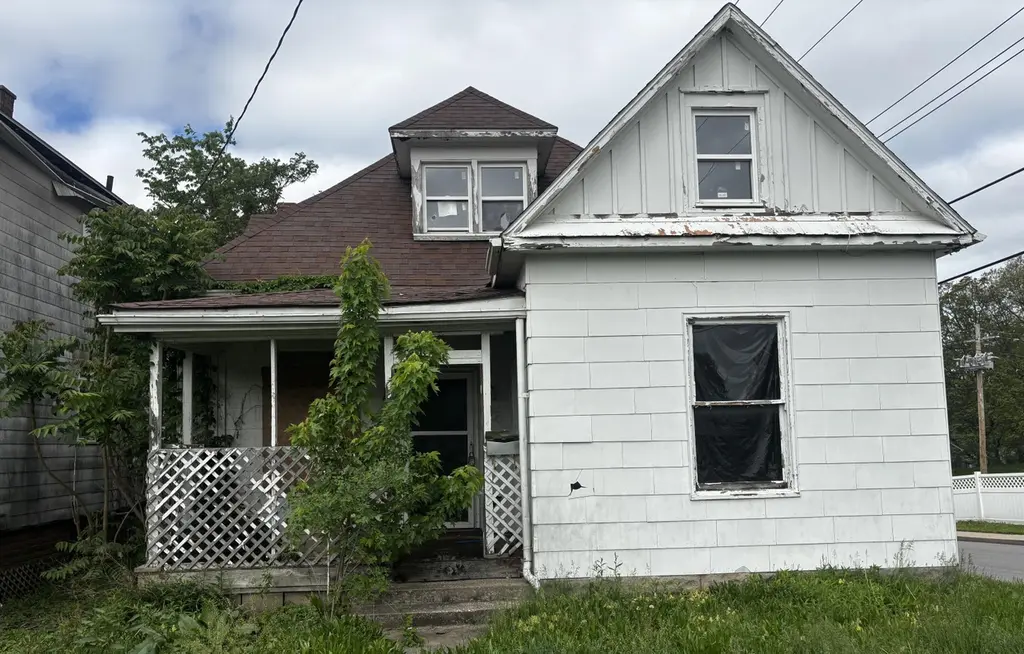
201 Bedford St · Moberly, MO
Flood risk 1/10 · Minimal
- FEMA flood zone
- X (unshaded)
- Chance of flooding over 30 yrs
- 0.0%
- Est. flood insurance / yr
- $507 – $1,088
Fire risk 4/10 · Minor
- Est. fire insurance / yr
- $1,054 – $1,958
Heat risk 3/10 · Minor
- Hot days now (above 106°F)
- 7 days/yr
- Hot days in 30 yrs
- 17 days/yr
Wind risk 2/10 · Minimal
- Chance of severe wind over 30 yrs
- —
Air-quality risk 1/10 · Minimal
- Unhealthy air days now
- 0 days/yr
- Unhealthy air days in 30 yrs
- 0 days/yr
Risk factors via First Street. Map © Google.
Why this score? — see what drove the D grade
The composite is a weighted blend of 9 inputs, each scored 0–100. Each bar is that input's sub-score; the figure is the points it added to the 100-point composite (weight × sub-score).
- Cash flow +15.0/30.0
- ARV discount +7.5/15.0
- 1% rule +5.0/10.0
- DSCR +5.0/10.0
- Livability +3.9/5.0
- Schools +2.7/10.0
- Rent growth +2.5/5.0
- Condition / age +2.5/5.0
- Appreciation +0.0/10.0
$15,000
🖨 Deal sheet 📄 Offer letter ✓ Due diligence
Listing remarks
This 3-bedroom, 2-bath home in Moberly is a true fixer-upper with potential for the right buyer. The property will require extensive repairs and renovations and is best suited for investors, flippers, or buyers looking for a rehab project. Opportunity to reimagine the space and add value. Property is being sold AS-IS, cash only.
Key facts
- 6,450 sq ft lot
- Built 1920
- Listed 41 days
Property features AI
Exterior
- Parking: No garage
- Utilities: Public water
- Home design: Single-family residence; Residential property
- Construction: Block foundation
- Exterior features: Deck; Paved road access; Lot roughly 43 x 150
Interior
- Kitchen: Eat-in kitchen
- Bedrooms: 2 total rooms
- Bathrooms: 2 full bathrooms
- Heating & cooling: Natural gas forced-air heating
- Interior features: Eat-in kitchen; Basement present
Neighborhood map
What this means for you Summary
Snapshot
- This is a 4-bed/1.5-bath single-family listed at $15k.
Deal economics
- At list price, monthly cash flow is $999 ($12k/yr) — positive.
- The deal already cash-flows at list — no discount required.
- Meets the 1% rule at list price ($1k rent vs $15k).
- Recommended offer: $15k (3.0% below list) — sets the bar for market timing.
- Cap rate 86.2% vs local median 4.5% in Moberly — top-decile yield for the area; either an underpriced asset or a hidden risk that comps aren't pricing in. Stress-test before assuming the spread holds.
Location & tenants
- Location reads 77/100 on livability (#32 in MO, #3,045 nationally) — a middle-class / working-renter tenant base. Strengths: cost of living A+, housing A+, health & safety A+; Watch: employment D, amenities F, commute F.
- Moberly (town): math 30% / reading 36% proficiency, ranked #246 of 324 in MO (top 76%) — families likely to look elsewhere, expect single-tenant / working-renter base with shorter leases.
- Zoned schools: South Park Elem. (230 students, 65% FRL); Moberly Middle (math 39% / reading 36%, grade F, #215 of 391 statewide, top 56%, 497 students, 59% FRL); Moberly Sr. High (math 2% / reading 52%, grade F, #417 of 521 statewide, top 80%, 691 students, 47% FRL) — zoned schools at 57% FRL track the district average.
- Market conditions: 134 active listings in the ZIP; 25 units permitted in Randolph County in 2024 (0 in 5+ unit buildings).
Forward outlook
- Local home prices are declining (-3.0%/yr); year-one equity from $104 of loan paydown is wiped out by about $450 of value loss. Plan a longer hold.
- Randolph County population projected at -10% by 2050 — secular population decline; favor cash flow + early exit over multi-decade hold.
- At projected returns (-3.0% appreciation + 3.0% rent growth), your $4k cash investment doubles in ~1 year — after that, you're playing with house money.
Negotiation context
- It's been on market 42 days — a 3% lower offer ($15k) is reasonable based on typical stale-listing flexibility.
- 3 sale attempts; this cycle's ask has dropped $7k (32%) from the opening price — seller is motivated, your offer sets the floor, not the list.
Risks & watch-outs
- Watch-outs: built in 1920 — expect roof / HVAC / electrical / plumbing capex.
Questions for the listing agent
- It's been on market 42 days. Have you received any prior offers? Is the seller open to a 3% concession, seller financing, or rate buy-down credit?
- Built in 1920 — when were the roof, HVAC, electrical panel, plumbing, and water heater last replaced?
- Is there a deadline driving the sale (1031 exchange, divorce, estate, relocation)? That informs how much negotiation room exists.
- Schools are D-rated, which usually means shorter tenancies and higher turnover. Who's the typical renter profile here, and what's been the actual vacancy rate?
- The area grade is low — what's the realistic commute time and amenity access for the typical tenant pool here? Any planned neighborhood developments (good or bad) we should know about?
- What's the average days-on-market for RENTAL listings here right now (not sales)? A rising rental-DOM trend means longer vacancies and softer asking-rent achievability than the comps imply.
- What's the recent tenant-quality profile in this submarket — average credit score on applications, eviction rate, late-payment / NSF rate, and stable-employment percentage? A property-management company in the area should have these aggregated.
- How much new for-sale + rental construction is in the pipeline within 1–3 miles? Heavy new supply typically softens prices + rents 12–24 months out; constrained supply supports both.
Investment metrics
- 1% rule
- 9.38% ✓
- Cap rate
- 86.19%
- Cash-on-cash
- 285.36%
- DSCR
- 13.70
- GRM
- 0.9
CMA / ARV
- ARV (median comp)
- $157,408
- List price
- $15,000
- Delta
- -86.02%
- Verdict
- UNDERPRICED
- Comps
- 20 within 1.0 mi
Show comp detail 12 sales within ~0.75 mi
| Address | Dist | Beds/Ba | Sqft | Sold | Price | $/sf | Match |
|---|---|---|---|---|---|---|---|
| 911 W Reed St | 0.25mi | 3/2.5 (-1) | 1,600 (-1%) | 2mo | $140,000 | $88 | 76 |
| 953 W Rollins St | 0.23mi | 4/2.0 | 1,733 (+7%) | 3mo | $129,900 | $75 | 73 |
| 618 Fort St | 0.34mi | 3/1.5 (-1) | 1,589 (-2%) | 7mo | $172,500 | $109 | 70 |
| 808 W Reed St | 0.21mi | 4/1.0 | 1,768 (+9%) | 6mo | $129,900 | $73 | 68 |
| 621 Gilman St | 0.37mi | 3/1.5 (-1) | 1,754 (+8%) | 3mo | $160,000 | $91 | 62 |
| 1316 Concannon St | 0.64mi | 3/2.0 (-1) | 1,618 (0%) | 3mo | $144,900 | $90 | 60 |
| 641 Park Ave | 0.40mi | 3/2.0 (-1) | 1,703 (+5%) | 6mo | $233,000 | $137 | 60 |
| 430 S 4th St | 0.47mi | 3/1.0 (-1) | 1,518 (-6%) | 1mo | $39,500 | $26 | 60 |
| 529 W Logan St | 0.29mi | 3/1.0 (-1) | 1,450 (-10%) | 7mo | $154,900 | $107 | 56 |
| 700 S 5th St | 0.49mi | 3/1.5 (-1) | 1,734 (+7%) | 8mo | $129,000 | $74 | 54 |
| 501 W Longview St | 0.67mi | 3/3.0 (-1) | 1,738 (+7%) | 0mo | $244,900 | $141 | 45 |
| 602 Gilman St | 0.43mi | 3/1.5 (-1) | 1,378 (-15%) | 7mo | $170,000 | $123 | 44 |
Match score weights: distance 35% · size 25% · config 20% · recency 20%. Top-matched comps best support the ARV.
Projected returns pro-forma
-3.0% appreciation · 3.0% rent growth · sell at horizon
- IRR
- —
- Equity multiple
- 15.57×
- Total profit
- $61,208
- Equity at exit
- $2,237
- IRR
- —
- Equity multiple
- 33.22×
- Total profit
- $135,318
- Equity at exit
- $1,297
Cash invested: $4,200 (down + closing). Projections, not guarantees.
Landlord ↔ Tenant lean methodology
- Overall (STATE)
- 81 Strongly Landlord-Friendly
- State Missouri
- 81 Strongly Landlord-Friendly · R+10
- County
- — inherits STATE
- City
- — inherits STATE
ZIP-level market 65270
- Home prices YoY
- -30.6%
- Active inventory
- 134
- Price-to-rent
- 0.9×
Monthly cashflow live
- Estimated rent
- $1,407 medium interval (Pro) →
- Mortgage (P&I)
- −$79
- Tax from tax record
- −$28 /mo · $331/yr
- Insurance
- −$6
- HOA
- −$0
- Vacancy / Maint / Mgmt
- −$295
- Net cashflow
- $999
Break-even live
UW: 25.0% down · 7.5% · 30yr · 1.5% tax · 5.0% vac · 8.0% maint · 8.0% mgmt
Financing live
Cash to close
- Down payment
- $3,750
- Closing costs
- $450
- Reserves months
- —
- Total cash needed
- —
Loan-product check · same deal, 3 products live
Conventional
25% down · 7.5% · 30yr
- Down + closing
- —
- Monthly P&I
- —
- Monthly cashflow
- —
- DSCR
- —
- Eligible?
- —
Personal DTI + credit; lowest rate.
DSCR
20% down · 8.5% · 30yr
- Down + closing
- —
- Monthly P&I
- —
- Monthly cashflow
- —
- DSCR
- —
- Eligible?
- —
No personal income docs; deal must DSCR.
Hard money
10% down · 12.0% · 12mo
- Down + closing
- —
- Monthly P&I
- —
- Monthly cashflow
- —
- DSCR
- —
- Eligible?
- —
Short-term bridge; refi at stabilization.
Listing history 21 events
-
2026-06-18days on market $15,000 Active 42 DOM
-
2026-06-17pricedays on market $15,000 Active 41 DOM
-
2026-06-16days on market $22,000 Active 40 DOM
-
2026-06-15days on market $22,000 Active 39 DOM
-
2026-06-13days on market $22,000 Active 37 DOM
-
2026-06-12days on market $22,000 Active 36 DOM
-
2026-06-09days on market $22,000 Active 33 DOM
-
2026-06-08days on market $22,000 Active 32 DOM
-
2026-06-07days on market $22,000 Active 31 DOM
-
2026-06-07days on market $22,000 Active 30 DOM
-
2026-06-04days on market $22,000 Active 27 DOM
-
2026-06-02days on market $22,000 Active 26 DOM
-
2026-06-01days on market $22,000 Active 25 DOM
-
2026-05-31days on market $22,000 Active 24 DOM
-
2026-05-07$22,000 Active 330-char remark
-
2025-03-07historical
-
2025-03-03$20,000 Active
-
2025-03-03$20,000 Active
-
2015-04-02soldstatus $18,000
-
2000-04-06soldstatus
-
1981-03-23soldstatus
ⓘ Source: listings_history table (triggers on properties + properties_extension) + one-shot
backfill from property_details.listing_events for pre-trigger history.
Tax reassessment forecast MO · Resets to sale price
- Current annual tax
- $331 · $28/mo
- Projected year-2 tax
- $331 · $28/mo
- Expected delta
- $0/yr ($0/mo · 0.0%)
ⓘ Screening estimate from a state-policy table — verify with the county assessor before closing.
Climate risk First Street
- Flood 1/10 Low FEMA zone X (unshaded) · 0% chance over 30 yrs
- Wildfire 4/10 Moderate
- Heat 3/10 Moderate 7 d/yr ≥106°F today · 17 d/yr by 30 yrs out
- Wind 2/10 Low
- Air quality 1/10 Low 0 unhealthy d/yr today · 0 by 30 yrs out
Nearby sold comps map
Loading sold comps map…
Walkable amenities ~0.75 mi
Loading nearby amenities…
Taxation est. · year 1
- Rental income
- $16,880
- − Mortgage interest
- −$840
- − Property taxes
- −$331
- − Insurance
- −$75
- − Repairs & maintenance
- −$1,350
- − Management
- −$1,350
- − Depreciation
- −$436
- Taxable income
- $12,497
- Est. tax owed @ 24.0%
- −$2,999
- After-tax cash flow
- $8,986/yr
For passive investors: Depreciation is non-cash, so a rental often shows a tax loss while cash-flowing — sheltering income. Rental losses are passive: they offset passive income freely, and up to $25,000/yr can offset ordinary (W-2) income if you actively participate and your MAGI is under $100k (phasing out to $0 by $150k); unused losses carry forward. On sale, claimed depreciation is recaptured at up to 25%, and gains may owe capital-gains tax (a 1031 exchange can defer both). Figures are a year-1 estimate at your 24.0% rate — not tax advice; consult a CPA.
Schools (NCES district)
- District
- Moberly
- NCES district ID
- 2921100
- Math proficiency
- 30% ▼ -1.00%
- Reading proficiency
- 36% ▼ -3.00%
- Median HH income
- $36,160
- Composite
- 27.35/100
- National rank
- #6984
- State rank
- #246 of 324 in MO
Livability — Moberly
- Score
- 77/100
- State rank
- #32
- US rank
- #3045
Category grades
Schools grade is shown separately in the Schools card above.
Census & demographics
- Census place
- Moberly, MO
- Population (ZIP)
- 16,762
Population outlook (Randolph County) Hauer SSP2
- Today (2025)
- 24,596 people
- By 2030
- 24,213 · -1.6%
- By 2040
- 23,184 · -5.7%
- By 2050
- 22,081 · -10.2%
- By 2075
- 18,994 · -22.8%
- By 2100
- 15,070 · -38.7%
Race, ethnicity, and origin ACS 2023
- Neighborhood character
- Predominantly White (84%)
- Race & ethnicity
- White 84% Black 7% Two or more races 6% Hispanic / Latino 3%
- Common ancestry
- Italian 2% Lithuanian 2% Iranian 1%
- Foreign-born
- 1% · Canada
- Languages at home
- 98% English-only · Spanish 1%
Political lean MEDSL · Randolph
- 2024 margin
- Solid R (+52.2) · D 23.3% · R 75.5% · Other 1.2%
- 2008→2024 swing
- -28.9pp toward R · 2008: -23.3pp · 2024: -52.2pp
- All cycles
- 2024: R+52.2 2020: R+51.5 2016: R+50.9 2012: R+36.6 2008: R+23.3
Not yet ingested
- Civics
- —
Market trends
- HPI YoY
- ▼ -88.15%
- Current HPI
- 199.9743
- Rent YoY
- —
- Metro
- —
- State GDP YoY
- ▲ 1.84%
- F500 in state
- 20
Industry mix (Fortune 500 HQ in MO)
| Industry | F500 HQs | Revenue |
|---|---|---|
| Healthcare | 1 | $163B |
|
||
| Insurance | 1 | $21B |
|
||
| Industrial Technology | 1 | $17B |
|
||
| Retail | 1 | $16B |
|
||
| Industrial Distribution | 1 | $10B |
|
||
| Utilities | 1 | $9B |
|
||
Price history
-16.7% since first listed8 events — show timeline
- 2026-06-15 Price Changed $15,000 CBORMLS
- 2026-05-07 Listed $22,000 CBORMLS
- 2025-03-07 Delisted — CBORMLS
- 2025-03-03 Listed $20,000 RCBR
- 2025-03-03 Listed $20,000 CBORMLS
- 2015-04-02 Sold (Public Records) $18,000 Public Records
- 2000-04-06 Sold (Public Records) — Public Records
- 1981-03-23 Sold (Public Records) — Public Records
Property tax history
+5.9%/yrLatest (2025): $331 · +9.9% YoY. Source: county tax records.
Cash-flow waterfall
monthlySold comps — $/sqft
last 12 mo · ≤1 miLoading sold comps…