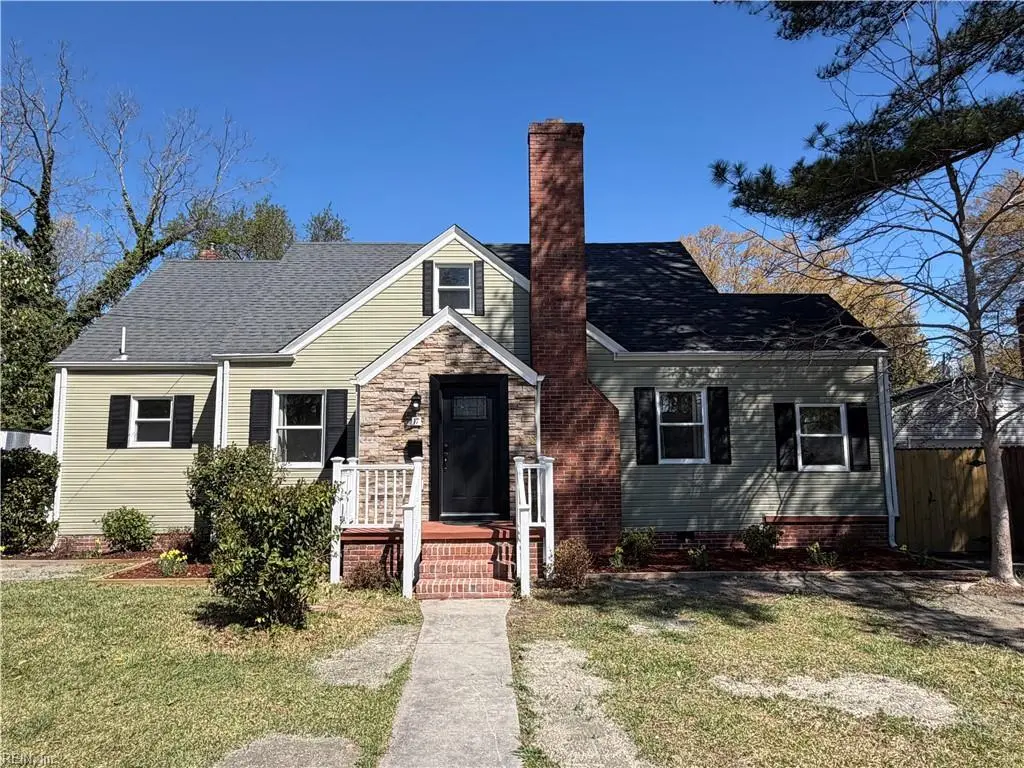
17 Davis St · Portsmouth, VA
Flood risk 3/10 · Minor
- FEMA flood zone
- X (unshaded)
- Chance of flooding over 30 yrs
- 0.12%
- Est. flood insurance / yr
- $507 – $1,088
Fire risk 1/10 · Minimal
- Est. fire insurance / yr
- $666 – $1,236
Heat risk 9/10 · Severe
- Hot days now (above 106°F)
- 7 days/yr
- Hot days in 30 yrs
- 16 days/yr
Wind risk 8/10 · Major
- Chance of severe wind over 30 yrs
- 80.0%
Air-quality risk 5/10 · Moderate
- Unhealthy air days now
- 6 days/yr
- Unhealthy air days in 30 yrs
- 7 days/yr
Risk factors via First Street. Map © Google.
Why this score? — see what drove the D- grade
The composite is a weighted blend of 9 inputs, each scored 0–100. Each bar is that input's sub-score; the figure is the points it added to the 100-point composite (weight × sub-score).
- Appreciation +10.0/10.0
- Cash flow +8.1/30.0
- ARV discount +4.3/15.0
- Schools +3.9/10.0
- Livability +3.7/5.0
- Rent growth +3.5/5.0
- Condition / age +2.5/5.0
- DSCR +2.2/10.0
- 1% rule +1.8/10.0
$359,000
🖨 Deal sheet (PDF) 📄 Offer letter ✓ Due diligence
Listing remarks MLS
INVESTOR SPECIAL! STRICTLY SOLD AS IS, SELLER TO MAKE NO REPAIRS! CASH OR CONVENTIONAL LOANS ONLY! NEWER WINDOWS, ROOF, AND MORE. UTILITIES ARE OFF! LOTS OF POTENTIAL, BRING ALL OFFERS!
Key facts
- Custom kitchen
- Fenced backyard
- 6,098 sq ft lot
Tags
Neighborhood map
What this means for you Summary
Snapshot
- This is a 4-bed/2.0-bath single-family listed at $359k.
Deal economics
- At list price, monthly cash flow is $-345 ($-4k/yr) — negative.
- To cash-flow at today's rent, offer at most $298k (17.0% below list).
- To meet the 1% rule (rent ≥ 1% of price), the offer needs to be $244k (32.0% below list).
- Recommended offer: $244k (32.0% below list) — sets the bar for 1% rule.
Location & tenants
- Location reads 73/100 on livability (#172 in VA) — a middle-class / working-renter tenant base. Strengths: amenities A+, cost of living A+, housing A+; Watch: employment C-, crime F, commute F.
- Portsmouth City Public School District (urban): math 34% / reading 58% proficiency, ranked #107 of 131 in VA (top 82%) — families likely to look elsewhere, expect single-tenant / working-renter base with shorter leases.
- Zoned schools: Cradock Elementary (math 22% / reading 37%, grade F, #1,011 of 1,108 statewide, top 92%, 622 students, 98% FRL); Cradock Middle (math 32% / reading 62%, grade D+, #257 of 342 statewide, top 77%, 533 students, 100% FRL); Manor High (math 48% / reading 75%, grade B-, #240 of 319 statewide, top 75%, 1,236 students, 99% FRL) — zoned schools average 99% FRL vs 60% district-wide (39 pts higher); higher-poverty schools than district average — tighter screening recommended.
- Market conditions: Rents rising (+4.0%/yr); 65 active listings in the ZIP; 12 comparable units currently listed for rent nearby; rentals at typical pace (median 26d on market — plan ~3-4 weeks tenant-placement turnaround); 300 units permitted in Portsmouth city in 2024 (112 in 5+ unit buildings).
- At $2,442/mo this rent would consume 60% of the median local household income ($49k/yr) (locally 534% of renters already pay >50% of income on rent) — very limited rent-growth headroom before tenants either downsize or default.
Forward outlook
- In year one you build about $38k of equity ($2k loan paydown + $36k appreciation (10.0% local appreciation)).
- By year 2, paydown + projected appreciation supports a ~$62k cash-out refi (75% LTV) — recoverable capital for the next deal without selling this one.
Negotiation context
- It's been on market 28 days — a 2% lower offer ($354k) is reasonable based on typical stale-listing flexibility.
- 6 sale attempts since 8y ago with the ask held roughly flat each time — persistent listings suggest the price (not the market) is what's stuck; bring a comps-based counter.
- Current owner paid $186k; list at $359k implies a 93% gain — meaningful room to come down on a strong offer.
Risks & watch-outs
- Watch-outs: built in 1940 — expect roof / HVAC / electrical / plumbing capex.
- Climate carrying-cost: severe wind risk, 80% chance of damaging wind over 30y; extreme-heat days projected 7→16/yr by 2055 (HVAC capex compounding) — expect insurance premiums to compound above CPI over the hold.
Questions for the listing agent
- What do current leases actually rent for vs. the listed asking? Can we see a recent rent roll and the last 12 months of T-12 income?
- Built in 1940 — when were the roof, HVAC, electrical panel, plumbing, and water heater last replaced?
- Is there a deadline driving the sale (1031 exchange, divorce, estate, relocation)? That informs how much negotiation room exists.
- Schools are B-rated — typically a magnet for longer-tenancy family renters. What's the average tenant stay here, and is there a school-zone premium baked into asking?
- Crime grade is F in this area — have there been break-ins, vandalism, or insurance claims at this property in the last 3 years? What carrier currently insures it and at what premium?
- The area grade is low — what's the realistic commute time and amenity access for the typical tenant pool here? Any planned neighborhood developments (good or bad) we should know about?
- What's the average days-on-market for RENTAL listings here right now (not sales)? A rising rental-DOM trend means longer vacancies and softer asking-rent achievability than the comps imply.
- What's the recent tenant-quality profile in this submarket — average credit score on applications, eviction rate, late-payment / NSF rate, and stable-employment percentage? A property-management company in the area should have these aggregated.
- How much new for-sale + rental construction is in the pipeline within 1–3 miles? Heavy new supply typically softens prices + rents 12–24 months out; constrained supply supports both.
Investment metrics
- 1% rule
- 0.68% ✗
- Cap rate
- 5.14%
- Cash-on-cash
- -4.12%
- DSCR
- 0.82
- GRM
- 12.2
CMA / ARV
- ARV (on-the-fly)
- $335,238
- Comps found
- 12
Show comp detail 12 sales within ~0.75 mi
| Address | Dist | Beds/Ba | Sqft | Sold | Price | $/sf | Match |
|---|---|---|---|---|---|---|---|
| 17 Davis St | 0.00mi | 4/2.0 | 1,900 (+0%) | 1mo | $330,000 | $174 | 99 |
| 25 Cushing St | 0.40mi | 4/2.5 | 1,802 (-5%) | 1mo | $310,000 | $172 | 70 |
| 45 Prospect Pkwy | 0.22mi | 4/3.5 | 1,750 (-8%) | 2mo | $302,000 | $173 | 70 |
| 28 Alden Ave | 0.48mi | 5/2.5 (+1) | 1,936 (+2%) | 2mo | $205,000 | $106 | 65 |
| 3906 Deep Creek Blvd | 0.71mi | 4/2.5 | 1,900 (+0%) | 2mo | $288,700 | $152 | 63 |
| 27 Afton Pkwy | 0.28mi | 4/2.0 | 1,631 (-14%) | 1mo | $309,000 | $189 | 63 |
| 83 Channing Ave | 0.39mi | 4/3.0 | 1,721 (-9%) | 1mo | $307,500 | $179 | 62 |
| 1441 Boxwood Dr | 0.53mi | 3/2.0 (-1) | 1,739 (-8%) | 4mo | $355,000 | $204 | 54 |
| 25 Alden Ave | 0.50mi | 3/2.0 (-1) | 1,656 (-13%) | 1mo | $246,500 | $149 | 50 |
| 2629 Greenwood Dr | 0.73mi | 4/2.0 | 1,700 (-10%) | 1mo | $303,000 | $178 | 48 |
| 13 Kennedy Dr | 0.69mi | 4/2.0 | 1,682 (-11%) | 1mo | $298,000 | $177 | 48 |
| 1445 Boxwood Dr | 0.52mi | 3/1.5 (-1) | 1,618 (-15%) | 3mo | $370,009 | $229 | 42 |
Match score weights: distance 35% · size 25% · config 20% · recency 20%. Top-matched comps best support the ARV.
Projected returns pro-forma
10.0% appreciation · 3.97% rent growth · sell at horizon
- IRR
- 21.6%
- Equity multiple
- 2.75×
- Total profit
- $175,851
- Equity at exit
- $323,416
- IRR
- 19.7%
- Equity multiple
- 6.37×
- Total profit
- $540,046
- Equity at exit
- $697,458
Cash invested: $100,520 (down + closing). Projections, not guarantees.
Landlord ↔ Tenant lean methodology
- Overall (STATE)
- 55 Moderately Landlord-Leaning
- State Virginia
- 55 Moderately Landlord-Leaning · D+2
- County
- — inherits STATE
- City
- — inherits STATE
ZIP-level market 23702
- Home prices YoY
- 5.2%
- Rents YoY
- 4.0%
- Active inventory
- 65
- Price-to-rent
- 12.2×
Monthly cashflow live
- Estimated rent
- $2,442 high interval (Pro) →
- Mortgage (P&I)
- −$1,883
- Tax from tax record
- −$243 /mo · $2,910/yr
- Insurance
- −$150
- HOA
- −$0
- Vacancy / Maint / Mgmt
- −$513
- Net cashflow
- $-345
Break-even live
Sensitivity live
| Price | -10% $-142 | -5% $-244 | +0% $-345 | +5% $-447 | +10% $-548 |
|---|---|---|---|---|---|
| Rent | -10% $-538 | -5% $-442 | +0% $-345 | +5% $-249 | +10% $-152 |
| Rate | -1.0pp $-164 | -0.5pp $-254 | base $-345 | +0.5pp $-438 | +1.0pp $-533 |
UW: 25.0% down · 7.5% · 30yr · 1.5% tax · 5.0% vac · 8.0% maint · 8.0% mgmt
Financing live
Cash to close
- Down payment
- $89,750
- Closing costs
- $10,770
- Reserves months
- —
- Total cash needed
- —
Loan-product check · same deal, 3 products live
Conventional
25% down · 7.5% · 30yr
- Down + closing
- —
- Monthly P&I
- —
- Monthly cashflow
- —
- DSCR
- —
- Eligible?
- —
Personal DTI + credit; lowest rate.
DSCR
20% down · 8.5% · 30yr
- Down + closing
- —
- Monthly P&I
- —
- Monthly cashflow
- —
- DSCR
- —
- Eligible?
- —
No personal income docs; deal must DSCR.
Hard money
10% down · 12.0% · 12mo
- Down + closing
- —
- Monthly P&I
- —
- Monthly cashflow
- —
- DSCR
- —
- Eligible?
- —
Short-term bridge; refi at stabilization.
Rent comps 12 comps
| Address | Beds | Baths | Sqft | Rent | $/sqft | DOM | Units | Dist |
|---|---|---|---|---|---|---|---|---|
| 213 Monmouth St Portsmouth, VA | 3.0 | 2.5 | 1800 | $2,450 | $1.36 | 46d | 1 | 0.19mi |
| 10 Parkside Pl Portsmouth, VA | 3.0 | 2.0 | 1800 | $2,095 | $1.16 | 19d | 1 | 0.30mi |
| 134 Monmouth St Portsmouth, VA | 3.0 | 2.5 | 1440 | $2,450 | $1.70 | 45d | 1 | 0.37mi |
| 35 Fairview Cir S Portsmouth, VA | 4.0 | 1.5 | 1462 | $2,100 | $1.44 | 14d | 1 | 0.72mi |
| 2117 Battery Park Rd Chesapeake, VA | 5.0 | 3.0 | 2500 | $3,500 | $1.40 | 25d | 1 | 0.79mi |
| 2509 Smithfield Rd Portsmouth, VA | 3.0 | 2.5 | 1540 | $2,345 | $1.52 | 23d | 1 | 0.87mi |
| 251 Independence St Portsmouth, VA | 3.0 | 2.5 | 1294 | $2,550 | $1.97 | 25d | 1 | 1.00mi |
| 213 Beacon Rd Portsmouth, VA | 3.0 | 2.0 | 1280 | $2,300 | $1.80 | 25d | 1 | 1.13mi |
| 1409 Wilcox Ave Portsmouth, VA | 3.0 | 2.5 | 1800 | $2,500 | $1.39 | 45d | 1 | 1.24mi |
| 1061 Saint Julian Dr Chesapeake, VA | 4.0 | 2.0 | 1611 | $2,550 | $1.58 | 25d | 1 | 1.30mi |
| 528 Normandy St Portsmouth, VA | 3.0 | 2.5 | 2262 | $2,800 | $1.24 | 25d | 1 | 1.41mi |
| 108 Marcy St Portsmouth, VA | 4.0 | 2.5 | 2100 | $2,500 | $1.19 | 45d | 1 | 1.48mi |
Listing history 22 events
-
2026-04-25status Under Contract
-
2026-04-17price $359,000
-
2026-03-28$369,000 Active
-
2025-12-01soldstatus $185,600 Sold 186-char remark
Show marketing remark (186 chars)
INVESTOR SPECIAL! STRICTLY SOLD AS IS, SELLER TO MAKE NO REPAIRS! CASH OR CONVENTIONAL LOANS ONLY! NEWER WINDOWS, ROOF, AND MORE. UTILITIES ARE OFF! LOTS OF POTENTIAL, BRING ALL OFFERS!
-
2025-11-21status Under Contract 186-char remark
Show marketing remark (186 chars)
INVESTOR SPECIAL! STRICTLY SOLD AS IS, SELLER TO MAKE NO REPAIRS! CASH OR CONVENTIONAL LOANS ONLY! NEWER WINDOWS, ROOF, AND MORE. UTILITIES ARE OFF! LOTS OF POTENTIAL, BRING ALL OFFERS!
-
2025-11-17historical Active Under Contract 186-char remark
Show marketing remark (186 chars)
INVESTOR SPECIAL! STRICTLY SOLD AS IS, SELLER TO MAKE NO REPAIRS! CASH OR CONVENTIONAL LOANS ONLY! NEWER WINDOWS, ROOF, AND MORE. UTILITIES ARE OFF! LOTS OF POTENTIAL, BRING ALL OFFERS!
-
2025-11-07$199,900 Active 186-char remark
Show marketing remark (186 chars)
INVESTOR SPECIAL! STRICTLY SOLD AS IS, SELLER TO MAKE NO REPAIRS! CASH OR CONVENTIONAL LOANS ONLY! NEWER WINDOWS, ROOF, AND MORE. UTILITIES ARE OFF! LOTS OF POTENTIAL, BRING ALL OFFERS!
-
2020-06-20historical
-
2020-05-29price $197,900
-
2020-04-28price $200,000
-
2020-04-13price $205,000
-
2020-04-04$210,000 Active
-
2020-03-17soldstatus $100,000
-
2018-10-31historical
-
2018-09-07status Active
-
2018-08-31historical
-
2018-07-17price $110,000
-
2018-07-17status Active
-
2018-07-17status Under Contract
-
2018-06-25historical
-
2018-05-31$115,000 Active
-
2014-06-17soldstatus $94,800
ⓘ Source: listings_history table (triggers on properties + properties_extension) + one-shot
backfill from property_details.listing_events for pre-trigger history.
Tax reassessment forecast VA · Resets to sale price
- Current annual tax
- $2,910 · $243/mo
- Projected year-2 tax
- $2,944 · $245/mo
- Expected delta
- +$34/yr (+$3/mo · 1.2%)
ⓘ Screening estimate from a state-policy table — verify with the county assessor before closing.
Climate risk First Street
- Flood 3/10 Moderate FEMA zone X (unshaded) · 12% chance over 30 yrs
- Wildfire 1/10 Low
- Heat 9/10 Extreme 7 d/yr ≥106°F today · 16 d/yr by 30 yrs out
- Wind 8/10 Severe 80% chance of damaging wind over 30 yrs
- Air quality 5/10 Major 6 unhealthy d/yr today · 7 by 30 yrs out
Nearby sold comps map
Loading sold comps map…
Walkable amenities ~0.75 mi
Loading nearby amenities…
Taxation est. · year 1
- Rental income
- $29,309
- − Mortgage interest
- −$20,110
- − Property taxes
- −$2,910
- − Insurance
- −$1,795
- − Repairs & maintenance
- −$2,345
- − Management
- −$2,345
- − Depreciation
- −$10,444
- Taxable loss
- −$10,639
- Est. tax savings @ 24.0%
- +$2,553
- After-tax cash flow
- $-1,589/yr
For passive investors: Depreciation is non-cash, so a rental often shows a tax loss while cash-flowing — sheltering income. Rental losses are passive: they offset passive income freely, and up to $25,000/yr can offset ordinary (W-2) income if you actively participate and your MAGI is under $100k (phasing out to $0 by $150k); unused losses carry forward. On sale, claimed depreciation is recaptured at up to 25%, and gains may owe capital-gains tax (a 1031 exchange can defer both). Figures are a year-1 estimate at your 24.0% rate — not tax advice; consult a CPA.
Schools (NCES district)
- District
- Portsmouth City Public School District
- NCES district ID
- 5103000
- Math proficiency
- 34% ▼ -40.00%
- Reading proficiency
- 58% ▼ -12.00%
- Median HH income
- $46,152
- Composite
- 39.01/100
- National rank
- #4071
- State rank
- #107 of 131 in VA
Livability — Portsmouth
- Score
- 73/100
- State rank
- #172
- US rank
- #5381
Category grades
Schools grade is shown separately in the Schools card above.
Census & demographics
- Census place
- Portsmouth, VA
- County
- Portsmouth City · 96,366 people
- City population
- 96,366
- Metro
- Virginia Beach-Norfolk-Newport News, VA-NC
- Population (ZIP)
- 12,485
- Household income
- $48,835
- Rent vs Own
- Severe rent burden
- 534.0
Population outlook (Portsmouth County) Hauer SSP2
- Today (2025)
- 96,730 people
- By 2030
- 96,760 · +0.0%
- By 2040
- 96,573 · -0.2%
- By 2050
- 95,606 · -1.2%
- By 2075
- 93,579 · -3.3%
- By 2100
- 83,756 · -13.4%
Race, ethnicity, and origin ACS 2023
- Neighborhood character
- Diverse neighborhood (Simpson 0.62)
- Race & ethnicity
- Black 50% White 35% Two or more races 9% Hispanic / Latino 8%
- Hispanic origin (detail)
- Mexican 2% Puerto Rican 3%
- Common ancestry
- Lithuanian 1% Italian 1% Slovak 1%
- Foreign-born
- 4% · Canada, South Korea
- Languages at home
- 95% English-only · Spanish 4%
Political lean MEDSL · Portsmouth
- 2024 margin
- Solid D (+38.6) · D 68.6% · R 30.0% · Other 1.4%
- 2008→2024 swing
- -0.7pp no change · 2008: 39.3pp · 2024: 38.6pp
- All cycles
- 2024: D+38.6 2020: D+40.8 2016: D+36.5 2012: D+39.6 2008: D+39.3
Not yet ingested
- Civics
- —
Market trends
- HPI YoY
- ▲ 16.70%
- Current HPI
- 340.0817
- Rent YoY
- ▲ 3.97%
- Metro
- Virginia Beach-Norfolk-Newport News, VA-NC
- State GDP YoY
- ▲ 2.40%
- F500 in state
- 50
Industry mix (Fortune 500 HQ in VA)
| Industry | F500 HQs | Revenue |
|---|---|---|
| Aerospace / Defense | 4 | $236B |
|
||
| Technology / Defense | 3 | $32B |
|
||
| Financial Services | 2 | $176B |
|
||
| Utilities | 2 | $27B |
|
||
| Insurance | 2 | $25B |
|
||
| Technology | 2 | $15B |
|
||
Price history
+278.7% since first listed22 events — show timeline
- 2026-04-25 Pending — REINMLS
- 2026-04-17 Price Changed $359,000 REINMLS
- 2026-03-28 Listed $369,000 REINMLS
- 2025-12-01 Sold (MLS) $185,600 REINMLS
- 2025-11-21 Pending — REINMLS
- 2025-11-17 Contingent — REINMLS
- 2025-11-07 Listed $199,900 REINMLS
- 2020-06-20 Listing Removed — REINMLS
- 2020-05-29 Price Changed $197,900 REINMLS
- 2020-04-28 Price Changed $200,000 REINMLS
- 2020-04-13 Price Changed $205,000 REINMLS
- 2020-04-04 Listed $210,000 REINMLS
- 2020-03-17 Sold (Public Records) $100,000 Public Records
- 2018-10-31 Listing Removed — REINMLS
- 2018-09-07 Relisted — REINMLS
- 2018-08-31 Listing Removed — REINMLS
- 2018-07-17 Price Changed $110,000 REINMLS
- 2018-07-17 Relisted — REINMLS
- 2018-07-17 Pending — REINMLS
- 2018-06-25 Listing Removed — REINMLS
- 2018-05-31 Listed $115,000 REINMLS
- 2014-06-17 Sold (Public Records) $94,800 Public Records
Property tax history
-1.9%/yrLatest (2025): $2,910 · +1.3% YoY. Source: county tax records.
Cash-flow waterfall
monthlySold comps — $/sqft
last 12 mo · ≤1 miLoading sold comps…