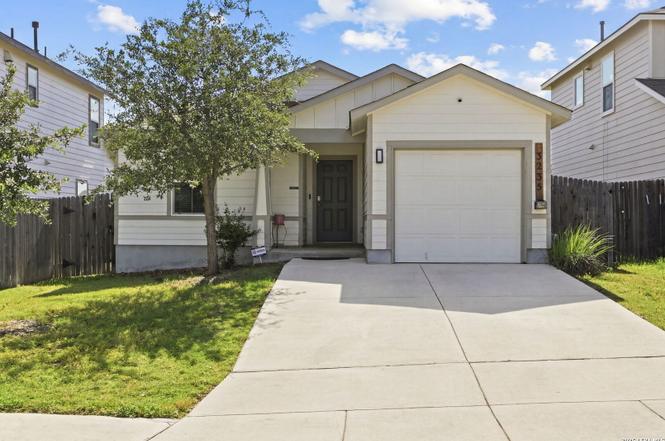
3235 Mission Riv · San Antonio, TX
Flood risk 1/10 · Minimal
- FEMA flood zone
- X (unshaded)
- Chance of flooding over 30 yrs
- 0.0%
- Est. flood insurance / yr
- $507 – $1,088
Fire risk 5/10 · Moderate
- Est. fire insurance / yr
- $1,222 – $2,270
Heat risk 8/10 · Major
- Hot days now (above 109°F)
- 7 days/yr
- Hot days in 30 yrs
- 23 days/yr
Wind risk 8/10 · Major
- Chance of severe wind over 30 yrs
- 80.0%
Air-quality risk 2/10 · Minimal
- Unhealthy air days now
- 1 days/yr
- Unhealthy air days in 30 yrs
- 1 days/yr
Risk factors via First Street. Map © Google.
Why this score? — see what drove the F grade
The composite is a weighted blend of 9 inputs, each scored 0–100. Each bar is that input's sub-score; the figure is the points it added to the 100-point composite (weight × sub-score).
- Cash flow +13.6/30.0
- Schools +4.4/10.0
- DSCR +4.1/10.0
- Livability +4.0/5.0
- 1% rule +3.4/10.0
- Condition / age +2.5/5.0
- Rent growth +1.7/5.0
- ARV discount +0.2/15.0
- Appreciation +0.0/10.0
$205,000
🖨 Deal sheet (PDF) 📄 Offer letter ✓ Due diligence
Listing remarks MLS
The Garland Plan - This Cozy 3 bedroom plan comes with Blinds and sprinkler system front & back yard. Schedule a viewing with one of our agents TODAY!!!
Key facts
- 4,791 sq ft lot
- Garage
- Community pool
Tags
Property features AI
Finance
- HOA & community: Mandatory HOA; HOA fee $120 quarterly; Association transfer fee $250; Subdivision: Stoney Creek
Exterior
- Parking: Attached 1-car garage
- Utilities: Public water system; Garbage service (Metro Garbage)
- Home design: Pre-owned single-family home; Built by DR HORTON; Approximately 6 years old
- Construction: Slab foundation; Composition roof
- Exterior features: Siding exterior; Paved streets with curbs and sidewalks; Streetlights; Pool and park/playground in the community
Interior
- Kitchen: Kitchen (16 x 9); Gas cooking; Stove/Range; Dishwasher
- Bedrooms: Master bedroom on lower level with walk-in closet, ceiling fan, and full bath; Bedroom 2 (12 x 10); Bedroom 3 (12 x 13); Master bedroom dimensions 12 x 13
- Flooring: Laminate flooring
- Bathrooms: Two full bathrooms; Master bath with tub/shower combination and single vanity
- Heating & cooling: Central heating (electric); Central air conditioning
- Interior features: Ground-level living with no steps; One living area; Breakfast bar; Utility room inside; Attic access only; High-speed internet available; All window coverings remain; Smoke alarm; Electric water heater
- Laundry & utility: Washer connection; Dryer connection; Laundry room on main level
Neighborhood map
What this means for you Summary
Snapshot
- This is a 3-bed/2.0-bath single-family listed at $205k.
Deal economics
- At list price, monthly cash flow is $12 ($150/yr) — positive.
- The deal already cash-flows at list — no discount required.
- To meet the 1% rule (rent ≥ 1% of price), the offer needs to be $173k (15.8% below list).
- Recommended offer: $173k (15.8% below list) — sets the bar for 1% rule.
- Cap rate 6.4% vs local median 3.8% in San Antonio — top-decile yield for the area; either an underpriced asset or a hidden risk that comps aren't pricing in. Stress-test before assuming the spread holds.
Location & tenants
- Location reads 80/100 on livability (#31 in TX, #1,616 nationally) — a professional / high-income tenant draw. Strengths: amenities A+, commute A+, cost of living A+; Watch: crime F.
- Medina Valley ISD (rural): math 48% / reading 53% proficiency, ranked #148 of 826 in TX (top 18%) — acceptable for families but not a draw, mixed tenant base, ~2y average lease.
- Zoned schools: Luckey Ranch El (math 47% / reading 50%, grade D, #950 of 4,322 statewide, top 22%, 866 students, 67% FRL); Medina Valley Middle (math 47% / reading 49%, grade C-, #400 of 1,662 statewide, top 24%, 1,029 students, 62% FRL); Medina Valley H S (math 34% / reading 55%, grade F, #652 of 1,632 statewide, top 43%, 2,147 students, 51% FRL).
- Market conditions: Rents falling (-3.0%/yr); 1176 active listings in the ZIP; 18 comparable units currently listed for rent nearby; rentals at typical pace (median 23d on market — plan ~3-4 weeks tenant-placement turnaround); solid renter incomes; 8,308 units permitted in Bexar County in 2024 (2,506 in 5+ unit buildings).
Forward outlook
- Local home prices are declining (-3.0%/yr); year-one equity from $1k of loan paydown is wiped out by about $6k of value loss. Plan a longer hold.
- Bexar County population projected at +50% by 2050 — long-run rental-demand tailwind backs the buy-and-hold thesis.
Negotiation context
- It's been on market 18 days — a 2% lower offer ($202k) is reasonable based on typical stale-listing flexibility.
- 4 sale attempts since 6y ago with the ask held roughly flat each time — persistent listings suggest the price (not the market) is what's stuck; bring a comps-based counter.
Risks & watch-outs
- Climate carrying-cost: severe wind risk, 80% chance of damaging wind over 30y; moderate wildfire risk; extreme-heat days projected 7→23/yr by 2055 (HVAC capex compounding) — expect insurance premiums to compound above CPI over the hold.
Questions for the listing agent
- What does the HOA fee cover, when was the last increase, and are there any pending special assessments or reserve-fund shortfalls?
- Is there a deadline driving the sale (1031 exchange, divorce, estate, relocation)? That informs how much negotiation room exists.
- Crime grade is F in this area — have there been break-ins, vandalism, or insurance claims at this property in the last 3 years? What carrier currently insures it and at what premium?
- The area grade is low — what's the realistic commute time and amenity access for the typical tenant pool here? Any planned neighborhood developments (good or bad) we should know about?
- What's the average days-on-market for RENTAL listings here right now (not sales)? A rising rental-DOM trend means longer vacancies and softer asking-rent achievability than the comps imply.
- What's the recent tenant-quality profile in this submarket — average credit score on applications, eviction rate, late-payment / NSF rate, and stable-employment percentage? A property-management company in the area should have these aggregated.
- How much new for-sale + rental construction is in the pipeline within 1–3 miles? Heavy new supply typically softens prices + rents 12–24 months out; constrained supply supports both.
Investment metrics
- 1% rule
- 0.84% ✗
- Cap rate
- 6.37%
- Cash-on-cash
- 0.26%
- DSCR
- 1.01
- GRM
- 9.9
CMA / ARV
- ARV (on-the-fly)
- $176,368
- Comps found
- 12
Show comp detail 12 sales within ~0.75 mi
| Address | Dist | Beds/Ba | Sqft | Sold | Price | $/sf | Match |
|---|---|---|---|---|---|---|---|
| 11726 Wentwood Vale | 0.23mi | 3/2.0 | 1,156 (-1%) | 5mo | $265,950 | $230 | 83 |
| 11818 Wentwood Vale | 0.16mi | 3/2.0 | 1,280 (+10%) | 6mo | $272,950 | $213 | 72 |
| 3407 Angus Xing | 0.22mi | 3/2.0 | 1,299 (+11%) | 4mo | $215,000 | $166 | 67 |
| 12121 La Cuchilla | 0.69mi | 3/2.5 | 1,189 (+2%) | 1mo | $166,999 | $140 | 62 |
| 12129 La Cuchilla | 0.69mi | 3/2.5 | 1,189 (+2%) | 2mo | $169,999 | $143 | 62 |
| 12149 La Cuchilla | 0.69mi | 3/2.5 | 1,189 (+2%) | 3mo | $187,999 | $158 | 61 |
| 12165 La Cuchilla | 0.69mi | 3/2.5 | 1,189 (+2%) | 3mo | $172,999 | $145 | 60 |
| 12046 La Cuchilla | 0.69mi | 3/2.5 | 1,189 (+2%) | 3mo | $166,999 | $140 | 60 |
| 12026 La Cuchilla | 0.69mi | 3/2.5 | 1,189 (+2%) | 5mo | $187,999 | $158 | 59 |
| 12014 La Cuchilla | 0.69mi | 3/2.5 | 1,189 (+2%) | 6mo | $170,999 | $144 | 58 |
| 12062 La Cuchilla | 0.69mi | 3/2.5 | 1,189 (+2%) | 6mo | $167,999 | $141 | 58 |
| 12144 La Cuchilla | 0.69mi | 2/2.5 (-1) | 1,013 (-13%) | 4mo | $152,999 | $151 | 35 |
Match score weights: distance 35% · size 25% · config 20% · recency 20%. Top-matched comps best support the ARV.
Projected returns pro-forma
-3.0% appreciation · 0.0% rent growth · sell at horizon
- IRR
- -19.2%
- Equity multiple
- 0.35×
- Total profit
- $-37,496
- Equity at exit
- $30,566
- IRR
- -19.2%
- Equity multiple
- 0.11×
- Total profit
- $-51,232
- Equity at exit
- $17,725
Cash invested: $57,400 (down + closing). Projections, not guarantees.
Landlord ↔ Tenant lean methodology
- Overall (STATE)
- 87 Strongly Landlord-Friendly
- State Texas
- 87 Strongly Landlord-Friendly · R+5
- County
- — inherits STATE
- City
- — inherits STATE
ZIP-level market 78245
- Home prices YoY
- -18.5%
- Rents YoY
- -3.0%
- Active inventory
- 1176
- Price-to-rent
- 9.9×
Monthly cashflow live
- Estimated rent
- $1,726 high interval (Pro) →
- Mortgage (P&I)
- −$1,075
- Tax from tax record
- −$150 /mo · $1,805/yr
- Insurance
- −$85
- HOA
- −$40
- Lot rent
- −$0
- Vacancy / Maint / Mgmt
- −$362
- Net cashflow
- $12
Break-even live
Sensitivity live
| Price | -10% $129 | -5% $70 | +0% $12 | +5% $-46 | +10% $-104 |
|---|---|---|---|---|---|
| Rent | -10% $-124 | -5% $-56 | +0% $12 | +5% $81 | +10% $149 |
| Rate | -1.0pp $116 | -0.5pp $65 | base $12 | +0.5pp $-41 | +1.0pp $-95 |
UW: 25.0% down · 7.5% · 30yr · 1.5% tax · 5.0% vac · 8.0% maint · 8.0% mgmt
Financing live
Cash to close
- Down payment
- $51,250
- Closing costs
- $6,150
- Reserves months
- —
- Total cash needed
- —
Loan-product check · same deal, 3 products live
Conventional
25% down · 7.5% · 30yr
- Down + closing
- —
- Monthly P&I
- —
- Monthly cashflow
- —
- DSCR
- —
- Eligible?
- —
Personal DTI + credit; lowest rate.
DSCR
20% down · 8.5% · 30yr
- Down + closing
- —
- Monthly P&I
- —
- Monthly cashflow
- —
- DSCR
- —
- Eligible?
- —
No personal income docs; deal must DSCR.
Hard money
10% down · 12.0% · 12mo
- Down + closing
- —
- Monthly P&I
- —
- Monthly cashflow
- —
- DSCR
- —
- Eligible?
- —
Short-term bridge; refi at stabilization.
Rent comps 18 comps
| Address | Beds | Baths | Sqft | Rent | $/sqft | DOM | Units | Dist |
|---|---|---|---|---|---|---|---|---|
| 3303 Mission Riv San Antonio, TX | 3.0 | 2.0 | 1489 | $1,850 | $1.24 | 46d | 1 | 0.03mi |
| 3232 Onion Crk San Antonio, TX | 3.0 | 2.0 | 1168 | $1,495 | $1.28 | 46d | 1 | 0.04mi |
| 11902 Mulberry Crk San Antonio, TX | 3.0 | 2.0 | 1413 | $1,647 | $1.17 | 46d | 1 | 0.06mi |
| 3203 Onion Crk San Antonio, TX | 3.0 | 2.0 | 1413 | $1,750 | $1.24 | 1d | 1 | 0.10mi |
| 12010 Mulberry Crk Unit NA San Antonio, TX | 3.0 | 2.0 | 1296 | $1,850 | $1.43 | 17d | 1 | 0.11mi |
| 12126 Sampson Crk San Antonio, TX | 3.0 | 2.0 | 1489 | $1,895 | $1.27 | 26d | 1 | 0.29mi |
| 12141 Pease Riv San Antonio, TX | 3.0 | 2.0 | 1396 | $1,595 | $1.14 | 5d | 1 | 0.31mi |
| 14618 Fowler Rdg San Antonio, TX | 3.0 | 2.0 | 1266 | $1,776 | $1.40 | 17d | 1 | 0.72mi |
| 11727 Black Rose San Antonio, TX | 3.0 | 2.0 | 1316 | $1,595 | $1.21 | 1d | 1 | 0.81mi |
| 11752 Red Pheasant San Antonio, TX | 3.0 | 2.0 | 1246 | $1,595 | $1.28 | 26d | 1 | 0.89mi |
| 11806 Red Pheasant San Antonio, TX | 3.0 | 2.0 | 1252 | $1,550 | $1.24 | 6d | 1 | 0.89mi |
| 11735 Midnight Rain San Antonio, TX | 4.0 | 2.0 | 1417 | $1,595 | $1.13 | 22d | 1 | 0.92mi |
| 12510 Galatea San Antonio, TX | 3.0 | 2.0 | 1212 | $1,575 | $1.30 | 20d | 1 | 1.25mi |
| 12515 Antilia San Antonio, TX | 3.0 | 2.0 | 1405 | $1,800 | $1.28 | 13d | 1 | 1.28mi |
| 12627 Corona Borealis San Antonio, TX | 3.0 | 2.0 | 1408 | $1,680 | $1.19 | 46d | 1 | 1.30mi |
| 13078 Cygnus San Antonio, TX | 4.0 | 1.0–3.0 | 1662 | $2,026 | $1.22 | 0d | 6 | 1.40mi |
| 5607 Forest Cyn San Antonio, TX | 3.0 | 2.0 | 1097 | $1,480 | $1.35 | 46d | 1 | 1.46mi |
| 11459 Coral Cyn San Antonio, TX | 3.0 | 2.0 | 1097 | $1,500 | $1.37 | 26d | 1 | 1.47mi |
HOA detail
- Monthly dues
- $40 · $480/yr
Listing history 11 events
-
2026-06-22days on market $205,000 Active 18 DOM
-
2026-06-21days on market $205,000 Active 17 DOM
-
2026-06-18days on market $205,000 Active 14 DOM
-
2026-06-17days on market $205,000 Active 13 DOM
-
2026-06-16days on market $205,000 Active 12 DOM
-
2026-06-15statusdays on market $205,000 Active 11 DOM
-
2026-06-13days on market $205,000 New 9 DOM
-
2026-06-09days on market $205,000 New 5 DOM
-
2026-06-08days on market $205,000 New 4 DOM
-
2026-06-07remarks 468-char remark
-
2026-06-07$205,000 New 3 DOM
ⓘ Source: listings_history table (triggers on properties + properties_extension) + one-shot
backfill from property_details.listing_events for pre-trigger history.
Tax reassessment forecast TX · Resets to sale price
- Current annual tax
- $1,805 · $150/mo
- Projected year-2 tax
- $3,752 · $313/mo
- Expected delta
- +$1,946/yr (+$162/mo · 107.8%)
ⓘ Screening estimate from a state-policy table — verify with the county assessor before closing.
Climate risk First Street
- Flood 1/10 Low FEMA zone X (unshaded) · 0% chance over 30 yrs
- Wildfire 5/10 Major
- Heat 8/10 Severe 7 d/yr ≥109°F today · 23 d/yr by 30 yrs out
- Wind 8/10 Severe 80% chance of damaging wind over 30 yrs
- Air quality 2/10 Low 1 unhealthy d/yr today · 1 by 30 yrs out
Nearby sold comps map
Loading sold comps map…
Walkable amenities ~0.75 mi
Loading nearby amenities…
Taxation est. · year 1
- Rental income
- $20,709
- − Mortgage interest
- −$11,483
- − Property taxes
- −$1,805
- − Insurance
- −$1,025
- − Repairs & maintenance
- −$1,657
- − Management
- −$1,657
- − HOA
- −$480
- − Depreciation
- −$5,964
- Taxable loss
- −$3,361
- Est. tax savings @ 24.0%
- +$807
- After-tax cash flow
- $956/yr
For passive investors: Depreciation is non-cash, so a rental often shows a tax loss while cash-flowing — sheltering income. Rental losses are passive: they offset passive income freely, and up to $25,000/yr can offset ordinary (W-2) income if you actively participate and your MAGI is under $100k (phasing out to $0 by $150k); unused losses carry forward. On sale, claimed depreciation is recaptured at up to 25%, and gains may owe capital-gains tax (a 1031 exchange can defer both). Figures are a year-1 estimate at your 24.0% rate — not tax advice; consult a CPA.
Schools (NCES district)
- District
- Medina Valley ISD
- NCES district ID
- 4830060
- Math proficiency
- 48% ▼ -9.00%
- Reading proficiency
- 53% ▼ -2.00%
- Median HH income
- $60,596
- Composite
- 44.2/100
- National rank
- #2851
- State rank
- #148 of 826 in TX
Livability — San Antonio
- Score
- 80/100
- State rank
- #31
- US rank
- #1616
Category grades
Schools grade is shown separately in the Schools card above.
Census & demographics
- County
- Bexar County · 1,990,555 people
- City population
- 1,806,925
- Metro
- San Antonio-New Braunfels, TX
- Population (ZIP)
- 96,015
- Household income
- $90,029
- Rent vs Own
- Severe rent burden
- 2466.0
Population outlook (Bexar County) Hauer SSP2
- Today (2025)
- 2,336,851 people
- By 2030
- 2,560,728 · +9.6%
- By 2040
- 3,020,569 · +29.3%
- By 2050
- 3,493,522 · +49.5%
- By 2075
- 4,668,459 · +99.8%
- By 2100
- 5,533,242 · +136.8%
Race, ethnicity, and origin ACS 2023
- Neighborhood character
- Majority Hispanic (64%)
- Race & ethnicity
- Hispanic / Latino 64% Two or more races 27% White 20% Black 9% Asian 2%
- Hispanic origin (detail)
- Mexican 53% Puerto Rican 2%
- Common ancestry
- Slovak 1% Lithuanian 1% Romanian 1%
- Foreign-born
- 9% · Canada, Vietnam
- Languages at home
- 66% English-only · Spanish 30% Arabic 1% Tagalog/Filipino 1%
Political lean MEDSL · Bexar
- 2024 margin
- Lean D (+9.8) · D 54.3% · R 44.6% · Other 1.1%
- 2008→2024 swing
- +4.2pp toward D · 2008: 5.6pp · 2024: 9.8pp
- All cycles
- 2024: D+9.8 2020: D+18.2 2016: D+13.5 2012: D+4.6 2008: D+5.6
Not yet ingested
- Civics
- —
Market trends
- HPI YoY
- ▼ -53.31%
- Current HPI
- 234.7931
- Rent YoY
- ▼ -3.02%
- Metro
- San Antonio-New Braunfels, TX
- State GDP YoY
- ▲ 3.95%
- F500 in state
- 110
Industry mix (Fortune 500 HQ in TX)
| Industry | F500 HQs | Revenue |
|---|---|---|
| Energy | 16 | $1,198B |
|
||
| Technology | 5 | $198B |
|
||
| Engineering / Construction | 4 | $72B |
|
||
| Energy Services | 3 | $60B |
|
||
| Utilities | 3 | $41B |
|
||
| Healthcare | 2 | $330B |
|
||
Price history
+10.0% since first listed10 events — show timeline
- 2026-06-04 Listed $205,000 LERA
- 2025-01-31 Listing Removed — LERA
- 2024-09-30 Price Changed $220,000 LERA
- 2024-07-30 Listed $230,000 LERA
- 2020-08-14 Sold (MLS) — LERA
- 2020-07-06 Pending — LERA
- 2020-06-02 Price Changed $188,300 LERA
- 2020-06-02 Relisted — LERA
- 2020-05-01 Pending — LERA
- 2020-01-14 Listed $186,300 LERA
Property tax history
-16.4%/yrLatest (2025): $1,805 · -58.6% YoY. Source: county tax records.
Cash-flow waterfall
monthlySold comps — $/sqft
last 12 mo · ≤1 miLoading sold comps…