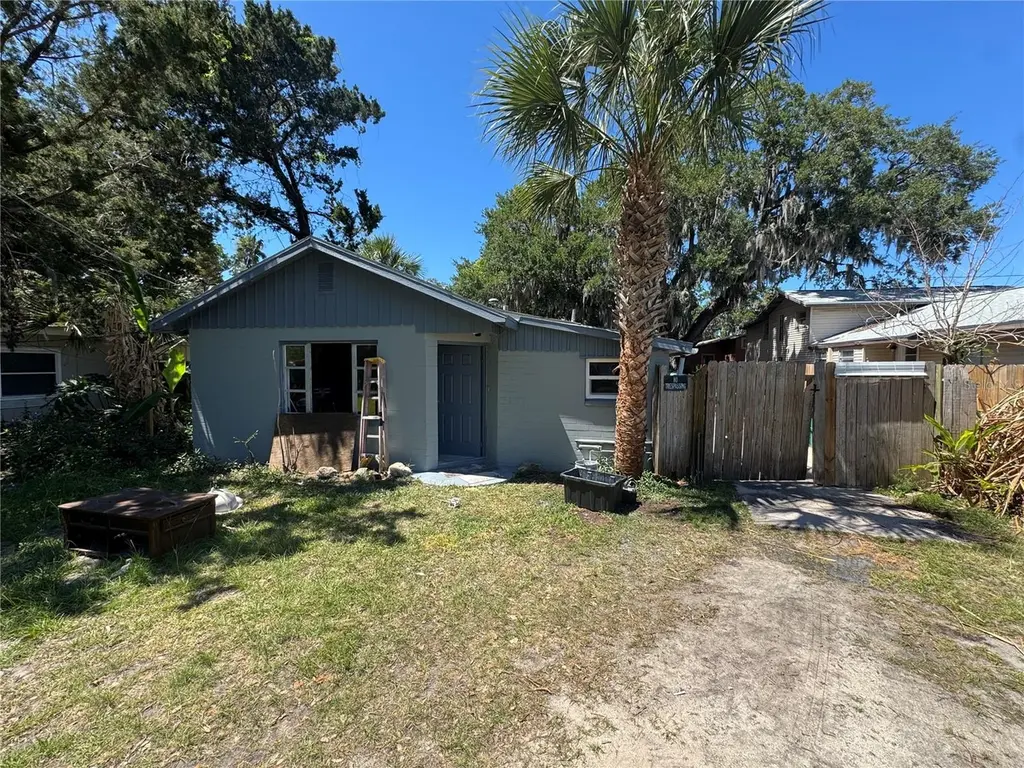
428 8th St · Holly Hill, FL
Flood risk 7/10 · Major
- FEMA flood zone
- AE
- Chance of flooding over 30 yrs
- 0.73%
- Est. flood insurance / yr
- $1,737 – $8,500
Fire risk 1/10 · Minimal
- Est. fire insurance / yr
- $947 – $1,759
Heat risk 10/10 · Severe
- Hot days now (above 104°F)
- 7 days/yr
- Hot days in 30 yrs
- 20 days/yr
Wind risk 10/10 · Severe
- Chance of severe wind over 30 yrs
- 99.0%
Air-quality risk 2/10 · Minimal
- Unhealthy air days now
- 2 days/yr
- Unhealthy air days in 30 yrs
- 2 days/yr
Risk factors via First Street. Map © Google.
Why this score? — see what drove the B- grade
The composite is a weighted blend of 9 inputs, each scored 0–100. Each bar is that input's sub-score; the figure is the points it added to the 100-point composite (weight × sub-score).
- Cash flow +29.0/30.0
- DSCR +10.0/10.0
- 1% rule +8.4/10.0
- ARV discount +7.5/15.0
- Schools +3.9/10.0
- Livability +3.6/5.0
- Rent growth +2.8/5.0
- Condition / age +2.5/5.0
- Appreciation +0.0/10.0
$93,000
🖨 Deal sheet (PDF) 📄 Offer letter ✓ Due diligence
Listing remarks
Investment Opportunity! Calling all investors and homebuyers seeking an affordable property in a great location. This home is conveniently located near everything Holly Hill and Daytona Beach has to provide, including shopping, dining, and major roadways. The property does require renovation but presents strong upside potential. With the right vision and improvements, it can be transformed into a beautiful residence. Additional photos available upon request.
Key facts
- 5,300 sq ft lot
- Built 1953
- Listed 50 days
Property features AI
Finance
- Other: Homestead exempt; No lease restrictions
- Financial info:
- HOA & community: No HOA association reported; Development: Sherville Park
Exterior
- Parking:
- Security:
- Utilities: Public water; Public sewer; Electricity connected; Water connected
- Home design: Single family residence; One story; East-facing
- Construction: Concrete construction; Shingle roof; Slab foundation; Built on 0.12-acre lot (approx. 50 x 106)
- Exterior features: Other exterior features
Interior
- Kitchen: Convection oven; Refrigerator
- Bedrooms: 3 bedrooms
- Flooring: Tile
- Bathrooms: 1 full bathroom
- Heating & cooling: Central heating; Ductless heating; Central air conditioning; Wall/window AC units
- Interior features: Ceiling fans
- Laundry & utility: Dedicated laundry room
Neighborhood map
What this means for you Summary
Snapshot
- This is a 1-bed/1.0-bath single-family listed at $93k.
Deal economics
- At list price, monthly cash flow is $-108 ($-1k/yr) — negative.
- To cash-flow at today's rent, offer at most $74k (20.5% below list).
- Meets the 1% rule at list price ($1k rent vs $93k).
- Recommended offer: $74k (20.5% below list) — sets the bar for cash-flow.
Location & tenants
- Location reads 72/100 on livability (#325 in FL) — a middle-class / working-renter tenant base. Strengths: cost of living A+, housing A+, health & safety A+; Watch: schools F, amenities F, commute F.
- Volusia (suburban): math 44% / reading 49% proficiency, ranked #47 of 73 in FL (top 64%) — families likely to look elsewhere, expect single-tenant / working-renter base with shorter leases.
- Market conditions: Rents rising (+1.0%/yr); 332 active listings in the ZIP; 20 comparable units currently listed for rent nearby; rentals at typical pace (median 24d on market — plan ~3-4 weeks tenant-placement turnaround); 3,402 units permitted in Volusia County in 2024 (681 in 5+ unit buildings).
Forward outlook
- Local home prices are declining (-3.0%/yr); year-one equity from $643 of loan paydown is wiped out by about $3k of value loss. Plan a longer hold.
- Volusia County population projected at +19% by 2050 — long-run rental-demand tailwind backs the buy-and-hold thesis.
Negotiation context
- It's been on market 50 days — a 3% lower offer ($90k) is reasonable based on typical stale-listing flexibility.
- Current owner paid $32k; list at $93k implies a 191% gain — meaningful room to come down on a strong offer.
Risks & watch-outs
- Watch-outs: flood insurance adds $427/mo; built in 1953 — expect roof / HVAC / electrical / plumbing capex.
- Climate carrying-cost: in FEMA flood zone AE (mandatory federal flood insurance); severe wind risk, 99% chance of damaging wind over 30y; extreme-heat days projected 7→20/yr by 2055 (HVAC capex compounding) — expect insurance premiums to compound above CPI over the hold.
Questions for the listing agent
- What do current leases actually rent for vs. the listed asking? Can we see a recent rent roll and the last 12 months of T-12 income?
- It's been on market 50 days. Have you received any prior offers? Is the seller open to a 21% concession, seller financing, or rate buy-down credit?
- Built in 1953 — when were the roof, HVAC, electrical panel, plumbing, and water heater last replaced?
- What's the actual annual flood-insurance premium (NFIP or private), and is the property in a SFHA with mandatory coverage?
- Is there a deadline driving the sale (1031 exchange, divorce, estate, relocation)? That informs how much negotiation room exists.
- Schools are F-rated, which usually means shorter tenancies and higher turnover. Who's the typical renter profile here, and what's been the actual vacancy rate?
- What's the average days-on-market for RENTAL listings here right now (not sales)? A rising rental-DOM trend means longer vacancies and softer asking-rent achievability than the comps imply.
- What's the recent tenant-quality profile in this submarket — average credit score on applications, eviction rate, late-payment / NSF rate, and stable-employment percentage? A property-management company in the area should have these aggregated.
- How much new for-sale + rental construction is in the pipeline within 1–3 miles? Heavy new supply typically softens prices + rents 12–24 months out; constrained supply supports both.
Investment metrics
- 1% rule
- 1.34% ✓
- Cap rate
- 10.40%
- Cash-on-cash
- 14.67%
- DSCR
- 1.65
- GRM
- 6.2
CMA / ARV
No comps found within radius.
Projected returns pro-forma
-3.0% appreciation · 1.01% rent growth · sell at horizon
- IRR
- -28.5%
- Equity multiple
- 0.07×
- Total profit
- $-24,108
- Equity at exit
- $13,867
- IRR
- -48.6%
- Equity multiple
- -0.47×
- Total profit
- $-38,311
- Equity at exit
- $8,041
Cash invested: $26,040 (down + closing). Projections, not guarantees.
Landlord ↔ Tenant lean methodology
- Overall (STATE)
- 87 Strongly Landlord-Friendly
- State Florida
- 87 Strongly Landlord-Friendly · R+3
- County
- — inherits STATE
- City
- — inherits STATE
ZIP-level market 32117
- Home prices YoY
- -8.2%
- Rents YoY
- 1.0%
- Active inventory
- 332
- Price-to-rent
- 6.2×
Monthly cashflow live
- Estimated rent
- $1,247 high interval (Pro) →
- Mortgage (P&I)
- −$488
- Tax from tax record
- −$140 /mo · $1,685/yr
- Insurance
- −$39
- Flood insurance flood zone
- −$427 /mo · $5,118/yr
- HOA
- −$0
- Vacancy / Maint / Mgmt
- −$262
- Net cashflow
- $-108
Break-even live
Sensitivity live
| Price | -10% $-55 | -5% $-82 | +0% $-108 | +5% $-134 | +10% $-161 |
|---|---|---|---|---|---|
| Rent | -10% $-207 | -5% $-157 | +0% $-108 | +5% $-59 | +10% $-10 |
| Rate | -1.0pp $-61 | -0.5pp $-84 | base $-108 | +0.5pp $-132 | +1.0pp $-157 |
UW: 25.0% down · 7.5% · 30yr · 1.5% tax · 5.0% vac · 8.0% maint · 8.0% mgmt
Financing live
Cash to close
- Down payment
- $23,250
- Closing costs
- $2,790
- Reserves months
- —
- Total cash needed
- —
Loan-product check · same deal, 3 products live
Conventional
25% down · 7.5% · 30yr
- Down + closing
- —
- Monthly P&I
- —
- Monthly cashflow
- —
- DSCR
- —
- Eligible?
- —
Personal DTI + credit; lowest rate.
DSCR
20% down · 8.5% · 30yr
- Down + closing
- —
- Monthly P&I
- —
- Monthly cashflow
- —
- DSCR
- —
- Eligible?
- —
No personal income docs; deal must DSCR.
Hard money
10% down · 12.0% · 12mo
- Down + closing
- —
- Monthly P&I
- —
- Monthly cashflow
- —
- DSCR
- —
- Eligible?
- —
Short-term bridge; refi at stabilization.
Rent comps 20 comps
| Address | Beds | Baths | Sqft | Rent | $/sqft | DOM | Units | Dist |
|---|---|---|---|---|---|---|---|---|
| 820 State Ave Unit 2 Daytona Beach, FL | 2.0 | 1.0 | 690 | $1,250 | $1.81 | 24d | 1 | 0.15mi |
| 851 State Ave Daytona Beach, FL | 2.0 | 1.0 | 682 | $1,495 | $2.19 | 24d | 1 | 0.20mi |
| 522 Ridgewood Ave Unit 3 Holly Hill, FL | 1.0 | 1.0 | 400 | $360 | $0.90 | 15d | 1 | 0.40mi |
| 100 Navigator DR Daytona Beach, FL | 1.0–3.0 | 1.0–2.0 | 1029 | $1,108 | $1.08 | 12d | 25 | 0.52mi |
| 1229 Kennedy Rd #43 Daytona Beach, FL | 1.0 | 1.0 | 625 | $900 | $1.44 | 24d | 1 | 0.99mi |
| 1221 Kennedy Rd Unit 43 Daytona Beach, FL | 1.0 | 1.0 | 625 | $775 | $1.24 | 12d | 1 | 1.00mi |
| 119 High St Holly Hill, FL | 1.0 | 1.0 | 456 | $900 | $1.97 | 22d | 1 | 1.03mi |
| 1521 Moravia Ave Daytona Beach, FL | 2.0 | 2.0 | 700 | $2,000 | $2.86 | 20d | 1 | 1.15mi |
| 1540 Espanola Ave Unit 9 Daytona Beach, FL | 1.0 | 1.0 | 600 | $900 | $1.50 | 24d | 1 | 1.18mi |
| 115 Kingston Ave Daytona Beach, FL | 1.0 | 1.0 | 600 | $1,195 | $1.99 | 24d | 1 | 1.24mi |
| 731 Florence St Daytona Beach, FL | 1.0 | 1.0 | 500 | $1,150 | $2.30 | 24d | 1 | 1.25mi |
| 1485 N Peninsula Dr Unit 2 Daytona Beach, FL | 1.0 | 1.0 | 500 | $1,150 | $2.30 | 24d | 1 | 1.30mi |
| 635 Tanglewood St Unit 4 Daytona Beach, FL | 1.0 | 1.0 | 507 | $1,295 | $2.55 | 24d | 1 | 1.34mi |
| 1612 Montgomery Ave Daytona Beach, FL | 1.0 | 1.0 | 480 | $2,000 | $4.17 | 24d | 1 | 1.35mi |
| 901 N Peninsula Dr #227 Daytona Beach, FL | 1.0 | 1.0 | 640 | $1,295 | $2.02 | 24d | 1 | 1.36mi |
| 901 N Peninsula Dr Unit 901 Daytona Beach, FL | 1.0 | 1.0 | 650 | $1,250 | $1.92 | 24d | 1 | 1.36mi |
| 875 Derbyshire Rd Daytona Beach, FL | 3.0 | 1.0–2.0 | 835 | $983 | $1.18 | 12d | 11 | 1.37mi |
| 1290 9th St #106 Daytona Beach, FL | 1.0 | 1.0 | 608 | $1,195 | $1.97 | 15d | 1 | 1.37mi |
| 1290 9th St Daytona Beach, FL | 1.0 | 1.0 | 608 | $1,060 | $1.74 | 24d | 3 | 1.37mi |
| 732 N Halifax Ave Daytona Beach, FL | 1.0–2.0 | 1.0–2.0 | 862 | $1,000 | $1.16 | 24d | 2 | 1.38mi |
Listing history 19 events
-
2026-06-18days on market $93,000 Active 50 DOM
-
2026-06-17days on market $93,000 Active 49 DOM
-
2026-06-16days on market $93,000 Active 48 DOM
-
2026-06-15days on market $93,000 Active 47 DOM
-
2026-06-14days on market $93,000 Active 45 DOM
-
2026-06-10days on market $93,000 Active 42 DOM
-
2026-06-09days on market $93,000 Active 41 DOM
-
2026-06-08days on market $93,000 Active 40 DOM
-
2026-06-07days on market $93,000 Active 39 DOM
-
2026-06-05days on market $93,000 Active 36 DOM
-
2026-06-03days on market $93,000 Active 35 DOM
-
2026-06-03days on market $93,000 Active 34 DOM
-
2026-06-01days on market $93,000 Active 33 DOM
-
2026-05-31days on market $93,000 Active 32 DOM
-
2026-05-31days on market $93,000 Active 31 DOM
-
2026-05-12price $93,000 462-char remark
-
2026-04-29$99,000 Active 462-char remark
-
1988-04-01soldstatus $32,000
-
1988-03-01soldstatus $6,718
ⓘ Source: listings_history table (triggers on properties + properties_extension) + one-shot
backfill from property_details.listing_events for pre-trigger history.
Tax reassessment forecast FL · Resets to sale price
- Current annual tax
- $1,685 · $140/mo
- Projected year-2 tax
- $1,685 · $140/mo
- Expected delta
- $0/yr ($0/mo · 0.0%)
ⓘ Screening estimate from a state-policy table — verify with the county assessor before closing.
Climate risk First Street
- Flood 7/10 Severe FEMA zone AE · 73% chance over 30 yrs
- Wildfire 1/10 Low
- Heat 10/10 Extreme 7 d/yr ≥104°F today · 20 d/yr by 30 yrs out
- Wind 10/10 Extreme 99% chance of damaging wind over 30 yrs
- Air quality 2/10 Low 2 unhealthy d/yr today · 2 by 30 yrs out
Nearby sold comps map
Loading sold comps map…
Walkable amenities ~0.75 mi
Loading nearby amenities…
Taxation est. · year 1
- Rental income
- $14,966
- − Mortgage interest
- −$5,209
- − Property taxes
- −$1,685
- − Insurance
- −$5,584
- − Repairs & maintenance
- −$1,197
- − Management
- −$1,197
- − Depreciation
- −$2,705
- Taxable loss
- −$2,611
- Est. tax savings @ 24.0%
- +$627
- After-tax cash flow
- $-670/yr
For passive investors: Depreciation is non-cash, so a rental often shows a tax loss while cash-flowing — sheltering income. Rental losses are passive: they offset passive income freely, and up to $25,000/yr can offset ordinary (W-2) income if you actively participate and your MAGI is under $100k (phasing out to $0 by $150k); unused losses carry forward. On sale, claimed depreciation is recaptured at up to 25%, and gains may owe capital-gains tax (a 1031 exchange can defer both). Figures are a year-1 estimate at your 24.0% rate — not tax advice; consult a CPA.
Schools (NCES district)
- District
- Volusia
- NCES district ID
- 1201920
- Math proficiency
- 44% ▼ -9.00%
- Reading proficiency
- 49% ▼ -3.00%
- Median HH income
- $42,946
- Composite
- 39.2/100
- National rank
- #4019
- State rank
- #47 of 73 in FL
Livability — Holly Hill
- Score
- 72/100
- State rank
- #325
- US rank
- #5737
Category grades
Schools grade is shown separately in the Schools card above.
Census & demographics
- Census place
- Holly Hill, FL
- County
- Volusia County · 556,871 people
- Metro
- Deltona-Daytona Beach-Ormond Beach, FL
- Population (ZIP)
- 30,955
- Household income
- $56,419
- Rent vs Own
- Severe rent burden
- 1781.0
Population outlook (Volusia County) Hauer SSP2
- Today (2025)
- 572,749 people
- By 2030
- 598,695 · +4.5%
- By 2040
- 644,880 · +12.6%
- By 2050
- 681,451 · +19.0%
- By 2075
- 759,957 · +32.7%
- By 2100
- 778,902 · +36.0%
Race, ethnicity, and origin ACS 2023
- Neighborhood character
- Diverse neighborhood (Simpson 0.63)
- Race & ethnicity
- White 53% Black 27% Hispanic / Latino 10% Two or more races 9% Asian 3%
- Hispanic origin (detail)
- Mexican 2% Puerto Rican 3%
- Common ancestry
- Romanian 2% Lithuanian 2% Slovak 1%
- Foreign-born
- 8% · Canada, Vietnam, Jamaica
- Languages at home
- 86% English-only · Spanish 8% Vietnamese 1% Other Indo-European 1%
Political lean MEDSL · Volusia
- 2024 margin
- Strong R (+21.8) · D 38.7% · R 60.5%
- 2008→2024 swing
- -27.4pp toward R · 2008: 5.7pp · 2024: -21.8pp
- All cycles
- 2024: R+21.8 2020: R+14.1 2016: R+13.1 2012: R+1.2 2008: D+5.7
Not yet ingested
- Civics
- —
Market trends
- HPI YoY
- ▼ -96.62%
- Current HPI
- 1084.54
- Rent YoY
- ▲ 1.01%
- Metro
- Deltona-Daytona Beach-Ormond Beach, FL
- State GDP YoY
- ▲ 3.28%
- F500 in state
- 36
Industry mix (Fortune 500 HQ in FL)
| Industry | F500 HQs | Revenue |
|---|---|---|
| Industrial Technology | 2 | $29B |
|
||
| Insurance | 2 | $17B |
|
||
| Retail | 1 | $60B |
|
||
| Technology Distribution | 1 | $58B |
|
||
| Homebuilding | 1 | $35B |
|
||
| Technology Manufacturing | 1 | $35B |
|
||
Price history
+1284.3% since first listed4 events — show timeline
- 2026-05-12 Price Changed $93,000 Stellar MLS as Distributed by MLS Grid
- 2026-04-29 Listed $99,000 Stellar MLS as Distributed by MLS Grid
- 1988-04-01 Sold (Public Records) $32,000 Public Records
- 1988-03-01 Sold (Public Records) $6,718 Public Records
Property tax history
+5.9%/yrLatest (2025): $1,685 · +1.1% YoY. Source: county tax records.
Cash-flow waterfall
monthlySold comps — $/sqft
last 12 mo · ≤1 miLoading sold comps…