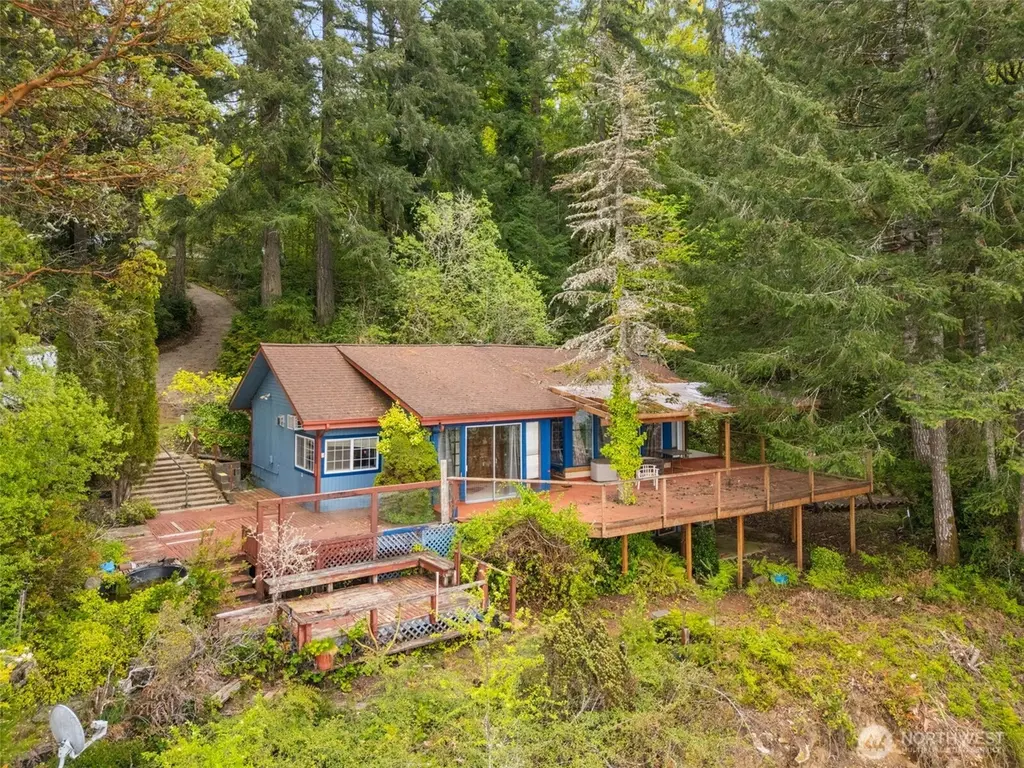
6105 Elizan Dr NW · Olympia, WA
Flood risk 1/10 · Minimal
- FEMA flood zone
- X (unshaded)
- Chance of flooding over 30 yrs
- 0.0%
- Est. flood insurance / yr
- $473 – $860
Fire risk 3/10 · Minor
- Est. fire insurance / yr
- $604 – $1,122
Heat risk 2/10 · Minimal
- Hot days now (above 89°F)
- 7 days/yr
- Hot days in 30 yrs
- 14 days/yr
Wind risk 1/10 · Minimal
- Chance of severe wind over 30 yrs
- —
Air-quality risk 6/10 · Moderate
- Unhealthy air days now
- 7 days/yr
- Unhealthy air days in 30 yrs
- 7 days/yr
Risk factors via First Street. Map © Google.
Why this score? — see what drove the D grade
The composite is a weighted blend of 9 inputs, each scored 0–100. Each bar is that input's sub-score; the figure is the points it added to the 100-point composite (weight × sub-score).
- ARV discount +15.0/15.0
- Appreciation +10.0/10.0
- Schools +5.8/10.0
- Livability +4.2/5.0
- Rent growth +3.3/5.0
- Condition / age +2.5/5.0
- Cash flow +2.1/30.0
- 1% rule +0.0/10.0
- DSCR +0.0/10.0
$495,000
🖨 Deal sheet (PDF) 📄 Offer letter ✓ Due diligence
Listing remarks
TWO WATERFRONT HOMES WITH SWEEPING VIEWS FOR AN INVESTOR OR EXTENDED FAMILY TO GIVE THE PROPERTY SOME TLC! 159' of High Bank Totten Inlet waterfront! This Steamboat Peninsula property features two separate homes on one high-bank parcel at the end of a quiet road. The residences are positioned at a private distance from each other, with one located near Elizan Road and the second situated along the water. Both homes include huge entertaining decks designed to take advantage of the western exposure and sweeping views of Totten Inlet. The layout and privacy between the units provide significant Airbnb potential or a flexible setup for multi-generational living. An unfinished shop with DADU po
Key facts
- Western exposure
- Sweeping views
- Two separate homes
Tags
Property features AI
Finance
- Financial info: Accepts Cash, Conventional, and Rehab loan terms
Exterior
- Parking: 2 covered spaces; 2 uncovered spaces; Detached carport; Driveway; Off-street parking
- Utilities: Individual well water; Septic tank; PSE electric service; Energy sources: electric and propane
- Home design: Single-family residence; Two-story; Entry at main level; West-facing; Has view; Listed as fixer
- Construction: Wood construction; Composition roof; Foundation: pillar/post/pier, poured concrete, and slab; Built on lot
- Exterior features: Wood exterior; Outbuildings on the property; Propane on site; Brush and wooded vegetation; Dead-end street location; Secluded setting; Saltwater and sound waterfront; 121 feet of waterfront
Interior
- Bedrooms: 2 bedrooms on the main level; Potential for a 3rd bedroom
- Bathrooms: 1 full bath; 1 half bath; 1 bathtub; 1 shower
- Heating & cooling: Baseboard heating; Wall unit cooling
- Interior features: Fireplace; Vaulted ceilings
Neighborhood map
What this means for you Summary
Snapshot
- This is a 1-bed/2.0-bath other listed at $495k.
Deal economics
- At list price, monthly cash flow is $-2k ($-22k/yr) — negative.
- To cash-flow at today's rent, offer at most $174k (64.8% below list).
- To meet the 1% rule (rent ≥ 1% of price), the offer needs to be $175k (64.7% below list).
- Recommended offer: $174k (64.8% below list) — sets the bar for cash-flow.
- Cap rate 1.9% vs local median 2.4% in Olympia — below-typical yield; the buyer is paying a premium for something (appreciation thesis, condition, location) that the cap rate doesn't capture.
Location & tenants
- Location reads 83/100 on livability (#58 in WA, #1,036 nationally) — a professional / high-income tenant draw. Strengths: amenities A+, commute A+, health & safety A+; Watch: crime F, cost of living D-.
- Griffin School District (suburban): math 59% / reading 68% proficiency, ranked #28 of 291 in WA (top 10%) — acceptable for families but not a draw, mixed tenant base, ~2y average lease; only 14% free/reduced lunch — higher-income household profile.
- Zoned schools: Griffin School (577 students, 23% FRL).
- Market conditions: Rents rising (+3.2%/yr); 306 active listings in the ZIP; solid renter incomes; 1,222 units permitted in Thurston County in 2024 (508 in 5+ unit buildings).
Forward outlook
- In year one you build about $53k of equity ($3k loan paydown + $50k appreciation (10.0% local appreciation)).
- Thurston County population projected at +27% by 2050 — long-run rental-demand tailwind backs the buy-and-hold thesis.
- By year 2, paydown + projected appreciation supports a ~$85k cash-out refi (75% LTV) — recoverable capital for the next deal without selling this one.
Negotiation context
- It's been on market 47 days — a 3% lower offer ($480k) is reasonable based on typical stale-listing flexibility.
- 4 sale attempts since 15y ago; this cycle's ask has dropped $55k (10%) from the opening price — seller is motivated, your offer sets the floor, not the list.
- Current owner paid $140k; list at $495k implies a 254% gain — meaningful room to come down on a strong offer.
Questions for the listing agent
- What do current leases actually rent for vs. the listed asking? Can we see a recent rent roll and the last 12 months of T-12 income?
- It's been on market 47 days. Have you received any prior offers? Is the seller open to a 65% concession, seller financing, or rate buy-down credit?
- Built in 1974 — when were the roof, HVAC, electrical panel, plumbing, and water heater last replaced?
- Is there a deadline driving the sale (1031 exchange, divorce, estate, relocation)? That informs how much negotiation room exists.
- Schools are A-rated — typically a magnet for longer-tenancy family renters. What's the average tenant stay here, and is there a school-zone premium baked into asking?
- Crime grade is F in this area — have there been break-ins, vandalism, or insurance claims at this property in the last 3 years? What carrier currently insures it and at what premium?
- The area grade is low — what's the realistic commute time and amenity access for the typical tenant pool here? Any planned neighborhood developments (good or bad) we should know about?
- What's the average days-on-market for RENTAL listings here right now (not sales)? A rising rental-DOM trend means longer vacancies and softer asking-rent achievability than the comps imply.
- What's the recent tenant-quality profile in this submarket — average credit score on applications, eviction rate, late-payment / NSF rate, and stable-employment percentage? A property-management company in the area should have these aggregated.
- How much new for-sale + rental construction is in the pipeline within 1–3 miles? Heavy new supply typically softens prices + rents 12–24 months out; constrained supply supports both.
Investment metrics
- 1% rule
- 0.35% ✗
- Cap rate
- 1.89%
- Cash-on-cash
- -15.71%
- DSCR
- 0.30
- GRM
- 23.6
CMA / ARV
- ARV (median comp)
- $852,981
- List price
- $495,000
- Delta
- -41.97%
- Verdict
- UNDERPRICED
- Comps
- 7 within 1.0 mi
Projected returns pro-forma
10.0% appreciation · 3.16% rent growth · sell at horizon
- IRR
- 13.4%
- Equity multiple
- 2.11×
- Total profit
- $154,188
- Equity at exit
- $445,935
- IRR
- 13.6%
- Equity multiple
- 4.93×
- Total profit
- $545,295
- Equity at exit
- $961,676
Cash invested: $138,600 (down + closing). Projections, not guarantees.
Landlord ↔ Tenant lean methodology
- Overall (STATE)
- 28 Tenant-Leaning
- State Washington
- 28 Tenant-Leaning · D+8
- County
- — inherits STATE
- City
- — inherits STATE
ZIP-level market 98502
- Home prices YoY
- 1.8%
- Rents YoY
- 3.2%
- Active inventory
- 306
- Price-to-rent
- 23.6×
Monthly cashflow live
- Estimated rent
- $1,747 medium interval (Pro) →
- Mortgage (P&I)
- −$2,596
- Tax from tax record
- −$392 /mo · $4,709/yr
- Insurance
- −$206
- HOA
- −$0
- Vacancy / Maint / Mgmt
- −$367
- Net cashflow
- $-1,815
Break-even live
Sensitivity live
| Price | -10% $-1,534 | -5% $-1,674 | +0% $-1,815 | +5% $-1,955 | +10% $-2,095 |
|---|---|---|---|---|---|
| Rent | -10% $-1,953 | -5% $-1,884 | +0% $-1,815 | +5% $-1,746 | +10% $-1,677 |
| Rate | -1.0pp $-1,565 | -0.5pp $-1,689 | base $-1,815 | +0.5pp $-1,943 | +1.0pp $-2,073 |
UW: 25.0% down · 7.5% · 30yr · 1.5% tax · 5.0% vac · 8.0% maint · 8.0% mgmt
Financing live
Cash to close
- Down payment
- $123,750
- Closing costs
- $14,850
- Reserves months
- —
- Total cash needed
- —
Loan-product check · same deal, 3 products live
Conventional
25% down · 7.5% · 30yr
- Down + closing
- —
- Monthly P&I
- —
- Monthly cashflow
- —
- DSCR
- —
- Eligible?
- —
Personal DTI + credit; lowest rate.
DSCR
20% down · 8.5% · 30yr
- Down + closing
- —
- Monthly P&I
- —
- Monthly cashflow
- —
- DSCR
- —
- Eligible?
- —
No personal income docs; deal must DSCR.
Hard money
10% down · 12.0% · 12mo
- Down + closing
- —
- Monthly P&I
- —
- Monthly cashflow
- —
- DSCR
- —
- Eligible?
- —
Short-term bridge; refi at stabilization.
Listing history 29 events
-
2026-06-22days on market $495,000 Active 47 DOM
-
2026-06-18days on market $495,000 Active 44 DOM
-
2026-06-17price $495,000 Active 43 DOM
-
2026-06-17days on market $550,000 Active 43 DOM
-
2026-06-16days on market $550,000 Active 42 DOM
-
2026-06-15days on market $550,000 Active 41 DOM
-
2026-06-14days on market $550,000 Active 39 DOM
-
2026-06-13days on market $550,000 Active 38 DOM
-
2026-06-10days on market $550,000 Active 36 DOM
-
2026-06-09days on market $550,000 Active 35 DOM
-
2026-06-08days on market $550,000 Active 34 DOM
-
2026-06-07days on market $550,000 Active 33 DOM
-
2026-06-05days on market $550,000 Active 30 DOM
-
2026-06-02days on market $550,000 Active 28 DOM
-
2026-06-01days on market $550,000 Active 27 DOM
-
2026-05-31days on market $550,000 Active 26 DOM
-
2026-05-30days on market $550,000 Active 25 DOM
-
2026-05-05$550,000 Active
-
2012-11-02soldstatus $140,000 Sold
-
2012-11-02soldstatus $140,000
-
2012-08-21status Pending
-
2012-08-08status Active
-
2012-07-18status Pending
-
2012-06-26price $169,000
-
2011-09-28price $199,900
-
2011-07-31price $249,900
-
2011-07-08status Active
-
2011-07-05status Pending
-
2011-05-20$269,900 Active
ⓘ Source: listings_history table (triggers on properties + properties_extension) + one-shot
backfill from property_details.listing_events for pre-trigger history.
Tax reassessment forecast WA · Resets to sale price
- Current annual tax
- $4,709 · $392/mo
- Projected year-2 tax
- $4,851 · $404/mo
- Expected delta
- +$142/yr (+$12/mo · 3.0%)
ⓘ Screening estimate from a state-policy table — verify with the county assessor before closing.
Climate risk First Street
- Flood 1/10 Low FEMA zone X (unshaded) · 0% chance over 30 yrs
- Wildfire 3/10 Moderate
- Heat 2/10 Low 7 d/yr ≥89°F today · 14 d/yr by 30 yrs out
- Wind 1/10 Low
- Air quality 6/10 Major 7 unhealthy d/yr today · 7 by 30 yrs out
Nearby sold comps map
Loading sold comps map…
Walkable amenities ~0.75 mi
Loading nearby amenities…
Taxation est. · year 1
- Rental income
- $20,961
- − Mortgage interest
- −$27,728
- − Property taxes
- −$4,709
- − Insurance
- −$2,475
- − Repairs & maintenance
- −$1,677
- − Management
- −$1,677
- − Depreciation
- −$14,400
- Taxable loss
- −$31,704
- Est. tax savings @ 24.0%
- +$7,609
- After-tax cash flow
- $-14,166/yr
For passive investors: Depreciation is non-cash, so a rental often shows a tax loss while cash-flowing — sheltering income. Rental losses are passive: they offset passive income freely, and up to $25,000/yr can offset ordinary (W-2) income if you actively participate and your MAGI is under $100k (phasing out to $0 by $150k); unused losses carry forward. On sale, claimed depreciation is recaptured at up to 25%, and gains may owe capital-gains tax (a 1031 exchange can defer both). Figures are a year-1 estimate at your 24.0% rate — not tax advice; consult a CPA.
Schools (NCES district)
- District
- Griffin School District
- NCES district ID
- 5303330
- Math proficiency
- 59% ▼ -2.00%
- Reading proficiency
- 68% ▼ -4.00%
- Median HH income
- $80,706
- Composite
- 58.36/100
- National rank
- #2079
- State rank
- #28 of 291 in WA
Livability — Olympia
- Score
- 83/100
- State rank
- #58
- US rank
- #1036
Category grades
Schools grade is shown separately in the Schools card above.
Census & demographics
- County
- Thurston County · 269,345 people
- City population
- 98,428
- Metro
- Olympia-Lacey-Tumwater, WA
- Population (ZIP)
- 35,398
- Household income
- $92,207
- Rent vs Own
- Severe rent burden
- 1811.0
Population outlook (Thurston County) Hauer SSP2
- Today (2025)
- 308,239 people
- By 2030
- 326,483 · +5.9%
- By 2040
- 359,890 · +16.8%
- By 2050
- 391,800 · +27.1%
- By 2075
- 468,024 · +51.8%
- By 2100
- 519,890 · +68.7%
Race, ethnicity, and origin ACS 2023
- Neighborhood character
- Predominantly White (71%)
- Race & ethnicity
- White 71% Two or more races 13% Hispanic / Latino 11% Asian 6% Black 3% Native American 1%
- Hispanic origin (detail)
- Mexican 3% Puerto Rican 4%
- Common ancestry
- Italian 5% Portuguese 4% Iranian 3%
- Foreign-born
- 8% · Vietnam, Canada, China
- Languages at home
- 90% English-only · Spanish 3% Vietnamese 2% Other Asian/Pacific 1%
Political lean MEDSL · Thurston
- 2024 margin
- Strong D (+20.4) · D 58.5% · R 38.1% · Other 3.5%
- 2008→2024 swing
- -1.3pp toward R · 2008: 21.7pp · 2024: 20.4pp
- All cycles
- 2024: D+20.4 2020: D+18.6 2016: D+15.4 2012: D+19.0 2008: D+21.7
Not yet ingested
- Civics
- —
Market trends
- HPI YoY
- ▲ 18.49%
- Current HPI
- 1056.49
- Rent YoY
- ▲ 3.16%
- Metro
- Olympia-Lacey-Tumwater, WA
- State GDP YoY
- ▲ 4.65%
- F500 in state
- 22
Industry mix (Fortune 500 HQ in WA)
| Industry | F500 HQs | Revenue |
|---|---|---|
| Retail | 2 | $269B |
|
||
| Technology / Retail | 1 | $638B |
|
||
| Technology | 1 | $245B |
|
||
| Telecommunications | 1 | $38B |
|
||
| Food / Beverage | 1 | $36B |
|
||
| Automotive / Trucks | 1 | $34B |
|
||
Price history
+83.4% since first listed13 events — show timeline
- 2026-06-17 Price Changed $495,000 NWMLS as Distributed by MLS Grid
- 2026-05-05 Listed $550,000 NWMLS as Distributed by MLS Grid
- 2012-11-02 Sold (Public Records) $140,000 Public Records
- 2012-11-02 Sold (MLS) $140,000 NWMLS as Distributed by MLS Grid
- 2012-08-21 Pending — NWMLS as Distributed by MLS Grid
- 2012-08-08 Relisted — NWMLS as Distributed by MLS Grid
- 2012-07-18 Pending — NWMLS as Distributed by MLS Grid
- 2012-06-26 Price Changed $169,000 NWMLS as Distributed by MLS Grid
- 2011-09-28 Price Changed $199,900 NWMLS as Distributed by MLS Grid
- 2011-07-31 Price Changed $249,900 NWMLS as Distributed by MLS Grid
- 2011-07-08 Relisted — NWMLS as Distributed by MLS Grid
- 2011-07-05 Pending — NWMLS as Distributed by MLS Grid
- 2011-05-20 Listed $269,900 NWMLS as Distributed by MLS Grid
Property tax history
+10.2%/yrLatest (2026): $4,709 · +1.3% YoY. Source: county tax records.
Cash-flow waterfall
monthlySold comps — $/sqft
last 12 mo · ≤1 miLoading sold comps…