4420 Carter Rd #41 · St. Augustine Shores, FL
Flood risk 1/10 · Minimal
- FEMA flood zone
- X (unshaded)
- Chance of flooding over 30 yrs
- 0.0%
- Est. flood insurance / yr
- $507 – $1,088
Fire risk 6/10 · Moderate
- Est. fire insurance / yr
- $947 – $1,759
Heat risk 9/10 · Severe
- Hot days now (above 106°F)
- 7 days/yr
- Hot days in 30 yrs
- 20 days/yr
Wind risk 9/10 · Severe
- Chance of severe wind over 30 yrs
- 99.0%
Air-quality risk 3/10 · Minor
- Unhealthy air days now
- 3 days/yr
- Unhealthy air days in 30 yrs
- 3 days/yr
Risk factors via First Street. Map © Google.
Why this score? — see what drove the D grade
The composite is a weighted blend of 9 inputs, each scored 0–100. Each bar is that input's sub-score; the figure is the points it added to the 100-point composite (weight × sub-score).
- Cash flow +10.7/30.0
- ARV discount +7.5/15.0
- Schools +6.4/10.0
- 1% rule +4.7/10.0
- DSCR +3.1/10.0
- Rent growth +2.7/5.0
- Livability +2.5/5.0
- Condition / age +2.5/5.0
- Appreciation +0.0/10.0
$175,000
🖨 Deal sheet 📄 Offer letter ✓ Due diligence
Listing remarks
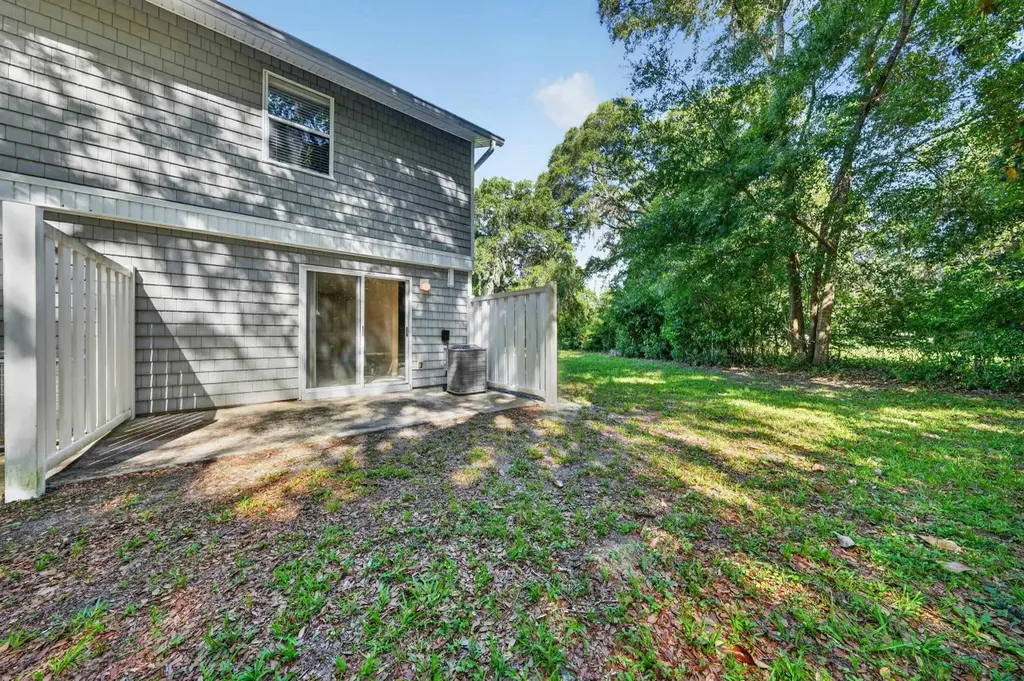
END UNIT! Welcome to this excellent opportunity for both homeowners and investors!! This well-maintained 2 Bed/ 1.5 Bath unit features all new carpet, fresh interior paint, and updated appliances (2025), offering a clean, move-in-ready feel. Enjoy added privacy and natural beauty as the home backs up to a peaceful common area shaded by mature oak trees, creating a relaxing backdrop right outside your door. Conveniently located just minutes from Publix, shopping, dining, and I-95, this property offers easy access for commuting while still providing a quiet setting. With strong rental income potential, this is a great option whether you're looking to expand your investment portfolio or settle
Key facts
- Updated appliances
- Mature oak trees
- New carpet
Tags
Property features AI
Finance
- Financial info: Minimum lease term: 6 months
- HOA & community: HOA fee $317 monthly; HOA covers exterior maintenance, master policy, sewer, termite bond, and trash collection; HOA restrictions apply (see documents)
Exterior
- Parking: Assigned parking
- Utilities: County water; Sewer
- Home design: Ground-level entry; Frame construction
- Construction: Frame construction; Shingle roof; Slab foundation
- Exterior features: HOA-maintained community
Interior
- Kitchen: Range; Microwave; Dishwasher; Refrigerator
- Bedrooms: Master bedroom (2nd level) approximately 14 by 12; Second bedroom approximately 9 by 12
- Flooring: Carpet; Tile
- Bathrooms: One full bathroom with tub/shower combo; One half bathroom
- Heating & cooling: Central electric heating; Central electric air conditioning
- Interior features: Carpet and tile flooring; Ceiling fans; Window treatments
- Laundry & utility: Washer and dryer included
Neighborhood map
What this means for you Summary
Snapshot
- This is a 2-bed/1.5-bath condo listed at $175k.
Deal economics
- At list price, monthly cash flow is $-84 ($-1k/yr) — negative.
- To cash-flow at today's rent, offer at most $160k (8.5% below list).
- To meet the 1% rule (rent ≥ 1% of price), the offer needs to be $170k (3.0% below list).
- Recommended offer: $160k (8.5% below list) — sets the bar for cash-flow.
- Cap rate 5.7% vs local median 3.4% in St. Augustine Shores — top-decile yield for the area; either an underpriced asset or a hidden risk that comps aren't pricing in. Stress-test before assuming the spread holds.
Location & tenants
- Location reads: area grade D — affects rentability + tenant quality, not the cash-flow math above.
- St. Johns (rural): math 75% / reading 73% proficiency, ranked #2 of 73 in FL (top 3%) — strong family-tenant draw, lease renewals of 3-5y typical; only 20% free/reduced lunch — higher-income household profile.
- Zoned schools: Otis A. Mason Elementary School (math 76% / reading 60%, grade B+, #425 of 2,144 statewide, top 20%, 719 students, 45% FRL); Pedro Menendez High School (math 31% / reading 54%, grade F, #264 of 667 statewide, top 41%, 1,519 students, 39% FRL) — zoned schools average 42% FRL vs 20% district-wide (22 pts higher); higher-poverty schools than district average — tighter screening recommended.
- Zoned-school proficiency averages 55% at this address vs 74% district-wide (-19 pts) — the specific schools serving this property underperform the St. Johns average; the district grade overstates school quality for this exact location.
- Market conditions: Rents flat; 400 active listings in the ZIP; 6 comparable units currently listed for rent nearby; rentals at typical pace (median 24d on market — plan ~3-4 weeks tenant-placement turnaround); solid renter incomes; 5,575 units permitted in St. Johns County in 2024 (584 in 5+ unit buildings).
Forward outlook
- Local home prices are declining (-3.0%/yr); year-one equity from $1k of loan paydown is wiped out by about $5k of value loss. Plan a longer hold.
- St. Johns County population projected at +60% by 2050 — long-run rental-demand tailwind backs the buy-and-hold thesis.
Negotiation context
- It's been on market 25 days — a 2% lower offer ($172k) is reasonable based on typical stale-listing flexibility.
- 2 sale attempts with the ask held roughly flat each time — persistent listings suggest the price (not the market) is what's stuck; bring a comps-based counter.
- Current owner paid $89k; list at $175k implies a 97% gain — meaningful room to come down on a strong offer.
Risks & watch-outs
- Climate carrying-cost: severe wind risk, 99% chance of damaging wind over 30y; major wildfire risk; extreme-heat days projected 7→20/yr by 2055 (HVAC capex compounding) — expect insurance premiums to compound above CPI over the hold.
Questions for the listing agent
- What do current leases actually rent for vs. the listed asking? Can we see a recent rent roll and the last 12 months of T-12 income?
- What does the HOA fee cover, when was the last increase, and are there any pending special assessments or reserve-fund shortfalls?
- Any open or pending special assessments — roof, HVAC, plumbing, elevator, façade? What's the per-unit balance and payoff schedule, and is the seller paying it off at close or rolling it to the buyer?
- Is there a deadline driving the sale (1031 exchange, divorce, estate, relocation)? That informs how much negotiation room exists.
- The area grade is low — what's the realistic commute time and amenity access for the typical tenant pool here? Any planned neighborhood developments (good or bad) we should know about?
- What's the average days-on-market for RENTAL listings here right now (not sales)? A rising rental-DOM trend means longer vacancies and softer asking-rent achievability than the comps imply.
- What's the recent tenant-quality profile in this submarket — average credit score on applications, eviction rate, late-payment / NSF rate, and stable-employment percentage? A property-management company in the area should have these aggregated.
- How much new apartment / multifamily construction is in the pipeline within 1–3 miles? Heavy new supply (>2% of stock underway) typically softens rents 12–24 months out; light construction supports rent growth.
Investment metrics
- 1% rule
- 0.97% ✗
- Cap rate
- 5.72%
- Cash-on-cash
- -2.05%
- DSCR
- 0.91
- GRM
- 8.6
CMA / ARV
No comps found within radius.
Projected returns pro-forma
-3.0% appreciation · 0.85% rent growth · sell at horizon
- IRR
- -22.5%
- Equity multiple
- 0.24×
- Total profit
- $-37,138
- Equity at exit
- $26,093
- IRR
- -24.6%
- Equity multiple
- -0.08×
- Total profit
- $-52,706
- Equity at exit
- $15,131
Cash invested: $49,000 (down + closing). Projections, not guarantees.
Landlord ↔ Tenant lean methodology
- Overall (STATE)
- 87 Strongly Landlord-Friendly
- State Florida
- 87 Strongly Landlord-Friendly · R+3
- County
- — inherits STATE
- City
- — inherits STATE
ZIP-level market 32086
- Rents YoY
- 0.8%
- Active inventory
- 400
- Price-to-rent
- 8.6×
Monthly cashflow live
- Estimated rent
- $1,697 high interval (Pro) →
- Mortgage (P&I)
- −$918
- Tax from tax record
- −$117 /mo · $1,407/yr
- Insurance
- −$73
- HOA
- −$317
- Vacancy / Maint / Mgmt
- −$356
- Net cashflow
- $-84
Break-even live
UW: 25.0% down · 7.5% · 30yr · 1.5% tax · 5.0% vac · 8.0% maint · 8.0% mgmt
Financing live
Cash to close
- Down payment
- $43,750
- Closing costs
- $5,250
- Reserves months
- —
- Total cash needed
- —
Loan-product check · same deal, 3 products live
Conventional
25% down · 7.5% · 30yr
- Down + closing
- —
- Monthly P&I
- —
- Monthly cashflow
- —
- DSCR
- —
- Eligible?
- —
Personal DTI + credit; lowest rate.
DSCR
20% down · 8.5% · 30yr
- Down + closing
- —
- Monthly P&I
- —
- Monthly cashflow
- —
- DSCR
- —
- Eligible?
- —
No personal income docs; deal must DSCR.
Hard money
10% down · 12.0% · 12mo
- Down + closing
- —
- Monthly P&I
- —
- Monthly cashflow
- —
- DSCR
- —
- Eligible?
- —
Short-term bridge; refi at stabilization.
Rent comps 6 comps
| Address | Beds | Baths | Sqft | Rent | $/sqft | DOM | Units | Dist |
|---|---|---|---|---|---|---|---|---|
| 4420 Carter Rd #43 Saint Augustine, FL | 2.0 | 1.5 | 870 | $1,450 | $1.67 | 23d | 1 | 0.00mi |
| 3884 Osprey Cir Unit B St. Augustine, FL | 2.0 | 1.0 | 792 | $1,250 | $1.58 | 23d | 1 | 0.87mi |
| 3884 Osprey Cir Unit B St. Augustine, FL | 2.0 | 1.0 | 792 | $1,250 | $1.58 | 17d | 1 | 0.87mi |
| 68 Angelo Ln Saint Augustine, FL | 2.0 | 2.0 | 900 | $1,645 | $1.83 | 13d | 1 | 0.98mi |
| 146 Phoenetia Dr St Augustine, FL | 3.0 | 2.0 | 1042 | $1,900 | $1.82 | 3d | 1 | 1.06mi |
| 250 Brainard Dr Unit A St. Augustine, FL | 2.0 | 1.0 | 960 | $2,400 | $2.50 | 23d | 1 | 1.48mi |
HOA detail condo
- Monthly dues
- $317 · $3,804/yr
- Assessments
- None detected in remarks — confirm with the listing agent.
Listing history 18 events
-
2026-06-18days on market $175,000 Active 25 DOM
-
2026-06-17days on market $175,000 Active 24 DOM
-
2026-06-16days on market $175,000 Active 23 DOM
-
2026-06-15days on market $175,000 Active 22 DOM
-
2026-06-13days on market $175,000 Active 20 DOM
-
2026-06-13days on market $175,000 Active 19 DOM
-
2026-06-10days on market $175,000 Active 16 DOM
-
2026-06-08days on market $175,000 Active 15 DOM
-
2026-06-07days on market $175,000 Active 14 DOM
-
2026-06-03days on market $175,000 Active 10 DOM
-
2026-06-02days on market $175,000 Active 9 DOM
-
2026-06-01days on market $175,000 Active 8 DOM
-
2026-05-31days on market $175,000 Active 7 DOM
-
2026-05-21$175,000 Active
-
2025-08-12historical $1,500
-
2025-06-21$1,500
-
2007-12-07soldstatus $89,000
-
2007-05-18soldstatus $2,861,500
ⓘ Source: listings_history table (triggers on properties + properties_extension) + one-shot
backfill from property_details.listing_events for pre-trigger history.
Tax reassessment forecast FL · Resets to sale price
- Current annual tax
- $1,407 · $117/mo
- Projected year-2 tax
- $1,452 · $121/mo
- Expected delta
- +$46/yr (+$4/mo · 3.2%)
ⓘ Screening estimate from a state-policy table — verify with the county assessor before closing.
Climate risk First Street
- Flood 1/10 Low FEMA zone X (unshaded) · 0% chance over 30 yrs
- Wildfire 6/10 Major
- Heat 9/10 Extreme 7 d/yr ≥106°F today · 20 d/yr by 30 yrs out
- Wind 9/10 Extreme 99% chance of damaging wind over 30 yrs
- Air quality 3/10 Moderate 3 unhealthy d/yr today · 3 by 30 yrs out
Nearby sold comps map
Loading sold comps map…
Walkable amenities ~0.75 mi
Loading nearby amenities…
Taxation est. · year 1
- Rental income
- $20,369
- − Mortgage interest
- −$9,803
- − Property taxes
- −$1,407
- − Insurance
- −$875
- − Repairs & maintenance
- −$1,630
- − Management
- −$1,630
- − HOA
- −$3,804
- − Depreciation
- −$5,091
- Taxable loss
- −$3,869
- Est. tax savings @ 24.0%
- +$929
- After-tax cash flow
- $-78/yr
For passive investors: Depreciation is non-cash, so a rental often shows a tax loss while cash-flowing — sheltering income. Rental losses are passive: they offset passive income freely, and up to $25,000/yr can offset ordinary (W-2) income if you actively participate and your MAGI is under $100k (phasing out to $0 by $150k); unused losses carry forward. On sale, claimed depreciation is recaptured at up to 25%, and gains may owe capital-gains tax (a 1031 exchange can defer both). Figures are a year-1 estimate at your 24.0% rate — not tax advice; consult a CPA.
Schools (NCES district)
- District
- St. Johns
- NCES district ID
- 1201740
- Math proficiency
- 75% ▼ -5.00%
- Reading proficiency
- 73% ▼ -2.00%
- Median HH income
- $66,842
- Composite
- 64.31/100
- National rank
- #556
- State rank
- #2 of 73 in FL
Livability — St. Augustine Shores
No livability data for this city. (Only ~50 U.S. cities are tracked.)
Census & demographics
- County
- Saint Johns County · 301,599 people
- Metro
- Jacksonville, FL
- Population (ZIP)
- 34,855
- Household income
- $76,512
- Rent vs Own
- Severe rent burden
- 634.0
Population outlook (St. Johns County) Hauer SSP2
- Today (2025)
- 303,941 people
- By 2030
- 342,590 · +12.7%
- By 2040
- 417,328 · +37.3%
- By 2050
- 487,011 · +60.2%
- By 2075
- 635,395 · +109.1%
- By 2100
- 717,469 · +136.1%
Race, ethnicity, and origin ACS 2023
- Neighborhood character
- Predominantly White (84%)
- Race & ethnicity
- White 84% Hispanic / Latino 8% Two or more races 5% Black 3% Asian 1%
- Hispanic origin (detail)
- Puerto Rican 2% Dominican 1%
- Common ancestry
- Romanian 3% Lithuanian 3% Italian 2%
- Foreign-born
- 7% · Canada, Jamaica, Guatemala
- Languages at home
- 91% English-only · Spanish 5% German/W. Germanic 1% Other Indo-European 1%
Political lean MEDSL · St. Johns
- 2024 margin
- Solid R (+31.4) · D 33.9% · R 65.2%
- 2008→2024 swing
- +0.2pp no change · 2008: -31.6pp · 2024: -31.4pp
- All cycles
- 2024: R+31.4 2020: R+26.7 2016: R+33.4 2012: R+37.8 2008: R+31.6
Not yet ingested
- Civics
- —
Market trends
- HPI YoY
- ▼ -278.21%
- Current HPI
- 306.2813
- Rent YoY
- ▲ 0.85%
- Metro
- Jacksonville, FL
- State GDP YoY
- ▲ 3.28%
- F500 in state
- 36
Industry mix (Fortune 500 HQ in FL)
| Industry | F500 HQs | Revenue |
|---|---|---|
| Industrial Technology | 2 | $29B |
|
||
| Insurance | 2 | $17B |
|
||
| Retail | 1 | $60B |
|
||
| Technology Distribution | 1 | $58B |
|
||
| Homebuilding | 1 | $35B |
|
||
| Technology Manufacturing | 1 | $35B |
|
||
Price history
-93.9% since first listed5 events — show timeline
- 2026-05-21 Listed $175,000 St. Augustine and St. Johns County Board of REALTORS®
- 2025-08-12 Rental Removed $1,500 SASJC
- 2025-06-21 Listed for Rent $1,500 SASJC
- 2007-12-07 Sold (Public Records) $89,000 Public Records
- 2007-05-18 Sold (Public Records) $2,861,500 Public Records
Property tax history
+8.3%/yrLatest (2025): $1,407 · +11.7% YoY. Source: county tax records.
Cash-flow waterfall
monthlySold comps — $/sqft
last 12 mo · ≤1 miLoading sold comps…