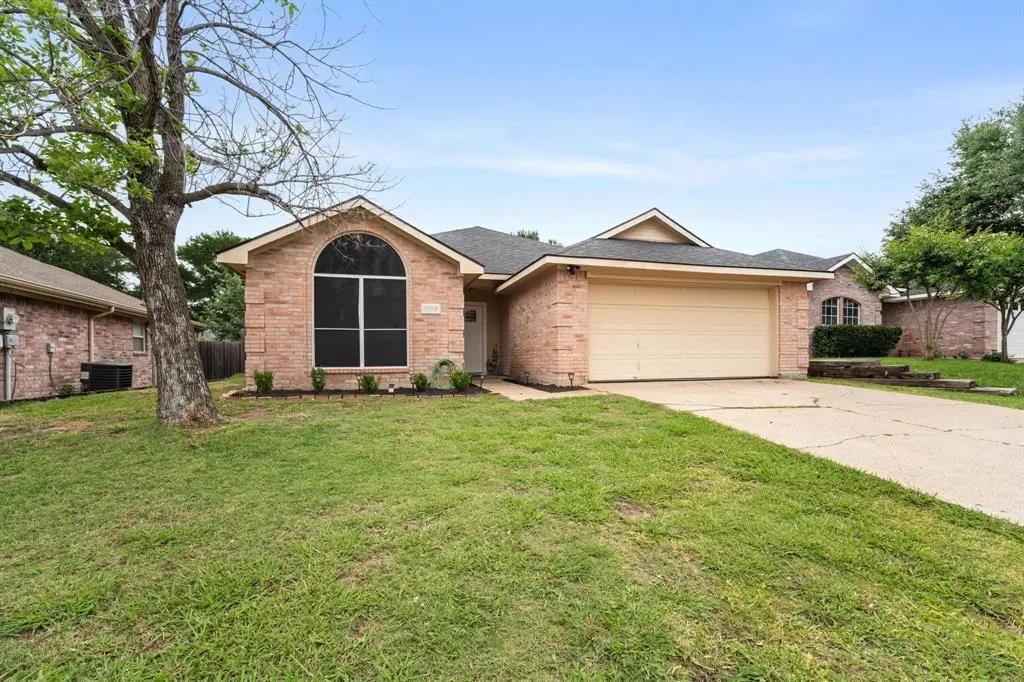
5916 Alcova Ln · Dallas, TX
Flood risk 1/10 · Minimal
- FEMA flood zone
- X (unshaded)
- Chance of flooding over 30 yrs
- 0.0%
- Est. flood insurance / yr
- $507 – $1,088
Fire risk 4/10 · Minor
- Est. fire insurance / yr
- $1,222 – $2,270
Heat risk 7/10 · Major
- Hot days now (above 109°F)
- 7 days/yr
- Hot days in 30 yrs
- 26 days/yr
Wind risk 6/10 · Moderate
- Chance of severe wind over 30 yrs
- 27.0%
Air-quality risk 3/10 · Minor
- Unhealthy air days now
- 2 days/yr
- Unhealthy air days in 30 yrs
- 4 days/yr
Risk factors via First Street. Map © Google.
Why this score? — see what drove the D grade
The composite is a weighted blend of 9 inputs, each scored 0–100. Each bar is that input's sub-score; the figure is the points it added to the 100-point composite (weight × sub-score).
- ARV discount +11.2/15.0
- Cash flow +10.5/30.0
- 1% rule +4.1/10.0
- Livability +4.0/5.0
- DSCR +3.0/10.0
- Rent growth +2.5/5.0
- Condition / age +2.5/5.0
- Schools +2.2/10.0
- Appreciation +0.0/10.0
$265,000
🖨 Deal sheet 📄 Offer letter ✓ Due diligence
Listing remarks MLS
Come see this IMMACULATE home. Home close to I-20 and Cedar Hill Mall. This 3 bedrooms 2 bath home has great wood trims and crown moldings throughout. Ceramic tile on entry, living, kitchen and all bathrooms. Laminate on master bedroom and carpet on the other 2 bedrooms. Stainless steel kitchen appliances. Has beautiful paint colors throughout that makes this home warm and inviting.
Key facts
- 6,534 sq ft lot
- 2 garage spots
- Built 1999
Property features AI
Finance
- Other: Property treated as clear for loan purposes; Listing accepts Cash, Conventional, FHA, and VA financing
- HOA & community: Mandatory HOA (Fox Hollow); HOA management handles management fees; HOA fee $266 annually
Exterior
- Parking: Attached 2-car garage (approx. 20' x 20'); 2 covered parking spaces; Garage with door opener
- Utilities: City water; City sewer; Not in a municipal utility district
- Home design: Single family residence; Residential property; One story; Entry level living; Subdivision: Fox Hollow
- Construction: Built in 1999; Brick construction; Composition roof; Slab foundation
- Exterior features: Covered porch(es); Front porch; Patio; Wood fencing; Few trees; Landscaped yard
Interior
- Kitchen: Dishwasher; Electric cooktop; Electric oven
- Bedrooms: 3 bedrooms, all on the entry level; Primary bedroom on the entry level
- Flooring: Carpet; Ceramic tile; Laminate
- Bathrooms: 2 full bathrooms
- Heating & cooling: Central heating (electric); Central air conditioning (electric)
- Interior features: Eat-in kitchen; High-speed internet available; Window coverings; Fireplace (wood burning); One living area; One dining area; Total of 4 rooms
- Laundry & utility: Full-size washer/dryer area
Neighborhood map
What this means for you Summary
Snapshot
- This is a 3-bed/2.0-bath single-family listed at $265k.
Deal economics
- At list price, monthly cash flow is $-138 ($-2k/yr) — negative.
- To cash-flow at today's rent, offer at most $241k (9.2% below list).
- To meet the 1% rule (rent ≥ 1% of price), the offer needs to be $242k (8.8% below list).
- Recommended offer: $241k (9.2% below list) — sets the bar for cash-flow.
- Cap rate 5.7% vs local median 2.3% in Dallas — top-decile yield for the area; either an underpriced asset or a hidden risk that comps aren't pricing in. Stress-test before assuming the spread holds.
Location & tenants
- Location reads 81/100 on livability (#24 in TX, #1,380 nationally) — a professional / high-income tenant draw. Strengths: amenities A+, commute A+, housing A+; Watch: crime F.
- Duncanville ISD (suburban): math 20% / reading 29% proficiency, ranked #711 of 826 in TX (top 86%) — low school quality limits family demand, transient renter base, plan for 1-2y turnover; 68% free/reduced lunch — lower-income household profile, screen leases tightly.
- Zoned schools: Cj & Anne Hyman El (math 22% / reading 27%, grade F, #3,052 of 4,322 statewide, top 74%, 456 students, 77% FRL).
- Market conditions: 50 active listings in the ZIP; 9 comparable units currently listed for rent nearby; rentals leasing fast (median 7d on market — plan ~1-2 weeks tenant-placement turnaround); 44% of comp listings sitting > 30 days — soft ceiling on asking rent; solid renter incomes; 12,577 units permitted in Dallas County in 2024 (6,829 in 5+ unit buildings).
- This rent runs 34% of the median local income ($86k/yr) — at the standard rent-burdened threshold; future hikes will face affordability resistance.
Forward outlook
- Local home prices are declining (-3.0%/yr); year-one equity from $2k of loan paydown is wiped out by about $8k of value loss. Plan a longer hold.
- Dallas County population projected at +35% by 2050 — long-run rental-demand tailwind backs the buy-and-hold thesis.
Negotiation context
- It's been on market 20 days — a 2% lower offer ($261k) is reasonable based on typical stale-listing flexibility.
- 6 sale attempts since 22y ago with the ask held roughly flat each time — persistent listings suggest the price (not the market) is what's stuck; bring a comps-based counter.
Risks & watch-outs
- Climate carrying-cost: major wind risk, 27% chance of damaging wind over 30y; extreme-heat days projected 7→26/yr by 2055 (HVAC capex compounding) — expect insurance premiums to compound above CPI over the hold.
Questions for the listing agent
- What do current leases actually rent for vs. the listed asking? Can we see a recent rent roll and the last 12 months of T-12 income?
- What does the HOA fee cover, when was the last increase, and are there any pending special assessments or reserve-fund shortfalls?
- Is there a deadline driving the sale (1031 exchange, divorce, estate, relocation)? That informs how much negotiation room exists.
- Crime grade is F in this area — have there been break-ins, vandalism, or insurance claims at this property in the last 3 years? What carrier currently insures it and at what premium?
- The area grade is low — what's the realistic commute time and amenity access for the typical tenant pool here? Any planned neighborhood developments (good or bad) we should know about?
- What's the average days-on-market for RENTAL listings here right now (not sales)? A rising rental-DOM trend means longer vacancies and softer asking-rent achievability than the comps imply.
- What's the recent tenant-quality profile in this submarket — average credit score on applications, eviction rate, late-payment / NSF rate, and stable-employment percentage? A property-management company in the area should have these aggregated.
- How much new for-sale + rental construction is in the pipeline within 1–3 miles? Heavy new supply typically softens prices + rents 12–24 months out; constrained supply supports both.
Investment metrics
- 1% rule
- 0.91% ✗
- Cap rate
- 5.67%
- Cash-on-cash
- -2.23%
- DSCR
- 0.90
- GRM
- 9.1
CMA / ARV
- ARV (median comp)
- $288,884
- List price
- $265,000
- Delta
- -8.27%
- Verdict
- FAIR
- Comps
- 20 within 1.0 mi
Show comp detail 12 sales within ~0.75 mi
| Address | Dist | Beds/Ba | Sqft | Sold | Price | $/sf | Match |
|---|---|---|---|---|---|---|---|
| 5916 Alcova Ln | 0.00mi | 3/2.0 | 1,419 (0%) | 0mo | $265,000 | $187 | 100 |
| 5589 Hunters Bend Ln | 0.31mi | 3/2.0 | 1,465 (+3%) | 3mo | $216,900 | $148 | 78 |
| 6527 Portside Ridge Ln | 0.40mi | 3/2.0 | 1,493 (+5%) | 0mo | $318,000 | $213 | 72 |
| 5715 Wisdom Creek Dr | 0.32mi | 3/2.0 | 1,581 (+11%) | 6mo | $285,000 | $180 | 61 |
| 5714 Firethorn Dr | 0.36mi | 3/2.0 | 1,260 (-11%) | 6mo | $269,900 | $214 | 60 |
| 5743 Wisdom Creek Dr | 0.28mi | 3/2.0 | 1,605 (+13%) | 12mo | $299,000 | $186 | 55 |
| 5539 Mandarin Way | 0.37mi | 3/2.0 | 1,611 (+14%) | 9mo | $284,299 | $176 | 53 |
| 5763 Wisdom Creek Dr | 0.26mi | 3/2.0 | 1,590 (+12%) | 18mo | $299,995 | $189 | 53 |
| 5545 Hunters Bend Ln | 0.40mi | 3/2.0 | 1,575 (+11%) | 13mo | $300,000 | $190 | 52 |
| 5612 High Creek Dr | 0.54mi | 3/2.5 | 1,520 (+7%) | 14mo | $339,000 | $223 | 49 |
| 5648 Centeridge Dr | 0.64mi | 4/2.0 (+1) | 1,590 (+12%) | 5mo | $300,000 | $189 | 41 |
| 6305 Pool View Dr | 0.62mi | 3/2.0 | 1,631 (+15%) | 8mo | $300,000 | $184 | 39 |
Match score weights: distance 35% · size 25% · config 20% · recency 20%. Top-matched comps best support the ARV.
Projected returns pro-forma
-3.0% appreciation · 3.0% rent growth · sell at horizon
- IRR
- -19.9%
- Equity multiple
- 0.31×
- Total profit
- $-51,558
- Equity at exit
- $39,512
- IRR
- -12.7%
- Equity multiple
- 0.25×
- Total profit
- $-55,520
- Equity at exit
- $22,912
Cash invested: $74,200 (down + closing). Projections, not guarantees.
Landlord ↔ Tenant lean methodology
- Overall (STATE)
- 87 Strongly Landlord-Friendly
- State Texas
- 87 Strongly Landlord-Friendly · R+5
- County
- — inherits STATE
- City
- — inherits STATE
ZIP-level market 75249
- Home prices YoY
- -6.3%
- Active inventory
- 50
- Price-to-rent
- 9.1×
Monthly cashflow live
- Estimated rent
- $2,417 high interval (Pro) →
- Mortgage (P&I)
- −$1,390
- Tax from tax record
- −$526 /mo · $6,308/yr
- Insurance
- −$110
- HOA
- −$22
- Vacancy / Maint / Mgmt
- −$508
- Net cashflow
- $-138
Break-even live
UW: 25.0% down · 7.5% · 30yr · 1.5% tax · 5.0% vac · 8.0% maint · 8.0% mgmt
Financing live
Cash to close
- Down payment
- $66,250
- Closing costs
- $7,950
- Reserves months
- —
- Total cash needed
- —
Loan-product check · same deal, 3 products live
Conventional
25% down · 7.5% · 30yr
- Down + closing
- —
- Monthly P&I
- —
- Monthly cashflow
- —
- DSCR
- —
- Eligible?
- —
Personal DTI + credit; lowest rate.
DSCR
20% down · 8.5% · 30yr
- Down + closing
- —
- Monthly P&I
- —
- Monthly cashflow
- —
- DSCR
- —
- Eligible?
- —
No personal income docs; deal must DSCR.
Hard money
10% down · 12.0% · 12mo
- Down + closing
- —
- Monthly P&I
- —
- Monthly cashflow
- —
- DSCR
- —
- Eligible?
- —
Short-term bridge; refi at stabilization.
Rent comps 9 comps
| Address | Beds | Baths | Sqft | Rent | $/sqft | DOM | Units | Dist |
|---|---|---|---|---|---|---|---|---|
| 5904 Alcova Ln Dallas, TX | 3.0 | 2.0 | 1647 | $2,200 | $1.34 | 7d | 1 | 0.04mi |
| 8413 Canvasback Ln Dallas, TX | 3.0 | 2.0 | 1631 | $2,200 | $1.35 | 2d | 1 | 0.43mi |
| 8423 Creekbluff Dr Dallas, TX | 4.0 | 2.0 | 1746 | $2,550 | $1.46 | 43d | 1 | 0.77mi |
| 8015 W Camp Wisdom Rd Dallas, TX | 1.0–3.0 | 1.0–2.0 | 1129 | $2,183 | $1.93 | 2d | 19 | 0.84mi |
| 7525 Ashcrest Ln Dallas, TX | 4.0 | 2.0 | 1625 | $2,949 | $1.81 | 1d | 1 | 1.11mi |
| 7521 Ashcrest Ln Dallas, TX | 3.0 | 2.0 | 1772 | $2,111 | $1.19 | 43d | 1 | 1.13mi |
| 6623 Mountain Trl Dallas, TX | 3.0 | 2.5 | 1536 | $2,400 | $1.56 | 43d | 1 | 1.22mi |
| 7455 W Camp Wisdom Rd Dallas, TX | 1.0–2.0 | 1.0–2.0 | 806 | $2,327 | $2.89 | 3d | 11 | 1.39mi |
| 9504 Cutleaf Ct Dallas, TX | 4.0 | 2.0 | 1830 | $2,316 | $1.27 | 43d | 1 | 1.45mi |
HOA detail
- Monthly dues
- $22 · $264/yr
Listing history 19 events
-
2026-05-12historical Active Option Contract 721-char remark
-
2026-05-07$265,000 Active 721-char remark
-
2017-07-05soldstatus
-
2017-06-29soldstatus Sold 385-char remark
Show marketing remark (385 chars)
Come see this IMMACULATE home. Home close to I-20 and Cedar Hill Mall. This 3 bedrooms 2 bath home has great wood trims and crown moldings throughout. Ceramic tile on entry, living, kitchen and all bathrooms. Laminate on master bedroom and carpet on the other 2 bedrooms. Stainless steel kitchen appliances. Has beautiful paint colors throughout that makes this home warm and inviting.
-
2017-05-26status Pending 385-char remark
Show marketing remark (385 chars)
Come see this IMMACULATE home. Home close to I-20 and Cedar Hill Mall. This 3 bedrooms 2 bath home has great wood trims and crown moldings throughout. Ceramic tile on entry, living, kitchen and all bathrooms. Laminate on master bedroom and carpet on the other 2 bedrooms. Stainless steel kitchen appliances. Has beautiful paint colors throughout that makes this home warm and inviting.
-
2017-05-18historical Active Option Contract 385-char remark
Show marketing remark (385 chars)
Come see this IMMACULATE home. Home close to I-20 and Cedar Hill Mall. This 3 bedrooms 2 bath home has great wood trims and crown moldings throughout. Ceramic tile on entry, living, kitchen and all bathrooms. Laminate on master bedroom and carpet on the other 2 bedrooms. Stainless steel kitchen appliances. Has beautiful paint colors throughout that makes this home warm and inviting.
-
2017-05-15$155,000 Active 385-char remark
Show marketing remark (385 chars)
Come see this IMMACULATE home. Home close to I-20 and Cedar Hill Mall. This 3 bedrooms 2 bath home has great wood trims and crown moldings throughout. Ceramic tile on entry, living, kitchen and all bathrooms. Laminate on master bedroom and carpet on the other 2 bedrooms. Stainless steel kitchen appliances. Has beautiful paint colors throughout that makes this home warm and inviting.
-
2016-08-31historical
-
2016-08-26$150,000 Active
-
2011-04-03historical
-
2010-10-02$125,900 Active
-
2005-12-16soldstatus
-
2005-12-08soldstatus
-
2005-11-09historical
-
2005-09-13$124,900
-
2004-03-01soldstatus
-
2004-02-25soldstatus
-
2004-02-07historical
-
2004-01-22$114,900
ⓘ Source: listings_history table (triggers on properties + properties_extension) + one-shot
backfill from property_details.listing_events for pre-trigger history.
Tax reassessment forecast TX · Resets to sale price
- Current annual tax
- $6,308 · $526/mo
- Projected year-2 tax
- $6,308 · $526/mo
- Expected delta
- $0/yr ($0/mo · 0.0%)
ⓘ Screening estimate from a state-policy table — verify with the county assessor before closing.
Climate risk First Street
- Flood 1/10 Low FEMA zone X (unshaded) · 0% chance over 30 yrs
- Wildfire 4/10 Moderate
- Heat 7/10 Severe 7 d/yr ≥109°F today · 26 d/yr by 30 yrs out
- Wind 6/10 Major 27% chance of damaging wind over 30 yrs
- Air quality 3/10 Moderate 2 unhealthy d/yr today · 4 by 30 yrs out
Nearby sold comps map
Loading sold comps map…
Walkable amenities ~0.75 mi
Loading nearby amenities…
Taxation est. · year 1
- Rental income
- $29,010
- − Mortgage interest
- −$14,844
- − Property taxes
- −$6,308
- − Insurance
- −$1,325
- − Repairs & maintenance
- −$2,321
- − Management
- −$2,321
- − HOA
- −$264
- − Depreciation
- −$7,709
- Taxable loss
- −$6,082
- Est. tax savings @ 24.0%
- +$1,460
- After-tax cash flow
- $-196/yr
For passive investors: Depreciation is non-cash, so a rental often shows a tax loss while cash-flowing — sheltering income. Rental losses are passive: they offset passive income freely, and up to $25,000/yr can offset ordinary (W-2) income if you actively participate and your MAGI is under $100k (phasing out to $0 by $150k); unused losses carry forward. On sale, claimed depreciation is recaptured at up to 25%, and gains may owe capital-gains tax (a 1031 exchange can defer both). Figures are a year-1 estimate at your 24.0% rate — not tax advice; consult a CPA.
Schools (NCES district)
- District
- Duncanville ISD
- NCES district ID
- 4817640
- Math proficiency
- 20% ▼ -19.00%
- Reading proficiency
- 29% ▼ -7.00%
- Median HH income
- $50,979
- Composite
- 21.71/100
- National rank
- #8270
- State rank
- #711 of 826 in TX
Livability — Dallas
- Score
- 81/100
- State rank
- #24
- US rank
- #1380
Category grades
Schools grade is shown separately in the Schools card above.
Census & demographics
- Census place
- Dallas, TX
- County
- Dallas County · 2,612,404 people
- City population
- 1,168,437
- Metro
- Dallas-Fort Worth-Arlington, TX
- Population (ZIP)
- 16,447
- Household income
- $85,500
- Rent vs Own
- Severe rent burden
- 363.0
Population outlook (Dallas County) Hauer SSP2
- Today (2025)
- 2,979,839 people
- By 2030
- 3,191,823 · +7.1%
- By 2040
- 3,619,611 · +21.5%
- By 2050
- 4,026,915 · +35.1%
- By 2075
- 4,957,073 · +66.4%
- By 2100
- 5,508,725 · +84.9%
Race, ethnicity, and origin ACS 2023
- Neighborhood character
- Diverse neighborhood (Simpson 0.61)
- Race & ethnicity
- Black 51% Hispanic / Latino 35% Two or more races 14% White 7% Asian 4%
- Hispanic origin (detail)
- Mexican 31%
- Common ancestry
- Lithuanian 1% Swedish 1%
- Foreign-born
- 13% · Canada, Vietnam, Jamaica
- Languages at home
- 72% English-only · Spanish 22% Tagalog/Filipino 2% Vietnamese 1%
Political lean MEDSL · Dallas
- 2024 margin
- Strong D (+22.2) · D 60.2% · R 38.0% · Other 1.8%
- 2008→2024 swing
- +6.9pp toward D · 2008: 15.3pp · 2024: 22.2pp
- All cycles
- 2024: D+22.2 2020: D+31.6 2016: D+26.2 2012: D+15.4 2008: D+15.3
Not yet ingested
- Civics
- —
Market trends
- HPI YoY
- ▼ -19.84%
- Current HPI
- 295.4071
- Rent YoY
- —
- Metro
- Dallas-Fort Worth-Arlington, TX
- State GDP YoY
- ▲ 3.95%
- F500 in state
- 110
Industry mix (Fortune 500 HQ in TX)
| Industry | F500 HQs | Revenue |
|---|---|---|
| Energy | 16 | $1,198B |
|
||
| Technology | 5 | $198B |
|
||
| Engineering / Construction | 4 | $72B |
|
||
| Energy Services | 3 | $60B |
|
||
| Utilities | 3 | $41B |
|
||
| Healthcare | 2 | $330B |
|
||
Price history
+130.6% since first listed21 events — show timeline
- 2026-06-05 Sold (MLS) — NTREIS
- 2026-05-27 Pending — NTREIS
- 2026-05-12 Contingent — NTREIS
- 2026-05-07 Listed $265,000 NTREIS
- 2017-07-05 Sold (Public Records) — Public Records
- 2017-06-29 Sold (MLS) — NTREIS
- 2017-05-26 Pending — NTREIS
- 2017-05-18 Contingent — NTREIS
- 2017-05-15 Listed $155,000 NTREIS
- 2016-08-31 Listing Removed — NTREIS
- 2016-08-26 Listed $150,000 NTREIS
- 2011-04-03 Listing Removed — NTREIS
- 2010-10-02 Listed $125,900 NTREIS
- 2005-12-16 Sold (Public Records) — Public Records
- 2005-12-08 Sold (MLS) — NTREIS
- 2005-11-09 Listing Removed — NTREIS
- 2005-09-13 Listed $124,900 NTREIS
- 2004-03-01 Sold (Public Records) — Public Records
- 2004-02-25 Sold (MLS) — NTREIS
- 2004-02-07 Listing Removed — NTREIS
- 2004-01-22 Listed $114,900 NTREIS
Property tax history
+5.2%/yrLatest (2025): $6,308 · -0.2% YoY. Source: county tax records.
Cash-flow waterfall
monthlySold comps — $/sqft
last 12 mo · ≤1 miLoading sold comps…