5 Thornton Dr · Dannemora, NY
Flood risk No data
- FEMA flood zone
- —
- Chance of flooding over 30 yrs
- —
- Est. flood insurance / yr
- —
Fire risk No data
- Est. fire insurance / yr
- —
Heat risk No data
- Hot days now (above threshold)
- —
- Hot days in 30 yrs
- —
Wind risk No data
- Chance of severe wind over 30 yrs
- —
Air-quality risk No data
- Unhealthy air days now
- —
- Unhealthy air days in 30 yrs
- —
Risk factors via First Street. Map © Google.
Why this score? — see what drove the B- grade
The composite is a weighted blend of 9 inputs, each scored 0–100. Each bar is that input's sub-score; the figure is the points it added to the 100-point composite (weight × sub-score).
- Cash flow +30.0/30.0
- 1% rule +10.0/10.0
- DSCR +10.0/10.0
- ARV discount +7.5/15.0
- Schools +4.3/10.0
- Livability +2.9/5.0
- Rent growth +2.5/5.0
- Appreciation +1.3/10.0
- Condition / age +1.0/5.0
$59,900
🖨 Deal sheet (PDF) 📄 Offer letter ✓ Due diligence
Listing remarks MLS
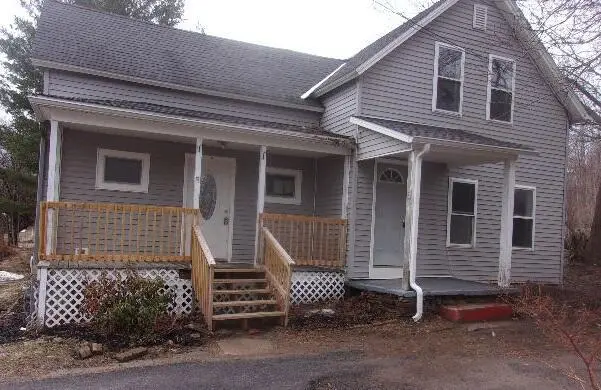
Old style home on dead end street in village of Dannemora close to stores and dining. There are three bedrooms, one down and two upstairs and a large eat in kitchen with cooktop on the main level. Bathroom is located on the second floor. A laundry area, living room and dining room are loacted on the main level. There is a large covered front porch and nice sized backyard to enjoy the outdoors. There is a one car garag and shed for added storage.
Key facts
- Large eat in kitchen
- Added storage
- Nice sized backyard
Tags
Neighborhood map
What this means for you Summary
Snapshot
- This is a 3-bed/1.0-bath single-family listed at $60k. Condition is rated poor.
Deal economics
- At list price, monthly cash flow is $577 ($7k/yr) — positive.
- The deal already cash-flows at list — no discount required.
- Meets the 1% rule at list price ($1k rent vs $60k).
- Recommended offer: $56k (6.0% below list) — sets the bar for market timing.
Location & tenants
- Location reads 57/100 on livability (#1,079 in NY) — a working-class tenant base; expect higher turnover. Strengths: cost of living A+, housing A; Watch: crime D+, amenities F, commute F.
- Saranac Central School District (rural): math 43% / reading 56% proficiency, ranked #374 of 590 in NY (top 63%) — families likely to look elsewhere, expect single-tenant / working-renter base with shorter leases.
- Zoned schools: Morrisonville Elementary School (math 27% / reading 52%, grade F, #1,444 of 2,108 statewide, top 71%, 358 students, 33% FRL); Saranac Middle School (math 31% / reading 57%, grade D, #363 of 729 statewide, top 50%, 371 students, 38% FRL); Saranac High School (math 98% / reading 70%, grade A, #409 of 1,100 statewide, top 39%, 414 students, 36% FRL).
- Market conditions: 10 active listings in the ZIP; 192 units permitted in Clinton County in 2024 (64 in 5+ unit buildings).
Forward outlook
- Local home prices are declining (-3.0%/yr); year-one equity from $414 of loan paydown is wiped out by about $2k of value loss. Plan a longer hold.
- Clinton County population projected at -16% by 2050 — secular population decline; favor cash flow + early exit over multi-decade hold.
- At projected returns (-3.0% appreciation + 3.0% rent growth), your $17k cash investment doubles in ~3 years — after that, you're playing with house money.
Negotiation context
- It's been on market 73 days — a 6% lower offer ($56k) is reasonable based on typical stale-listing flexibility.
- 2 sale attempts since 11y ago; this cycle's ask is 25% above the opening price — seller raised mid-cycle; expect resistance to lowballs.
Risks & watch-outs
- Watch-outs: built in 1895 — expect roof / HVAC / electrical / plumbing capex.
Questions for the listing agent
- It's been on market 73 days. Have you received any prior offers? Is the seller open to a 6% concession, seller financing, or rate buy-down credit?
- Have any recent inspections been done? Can we get a copy of the seller's disclosures and any deferred-maintenance estimates?
- Built in 1895 — when were the roof, HVAC, electrical panel, plumbing, and water heater last replaced?
- Why hasn't it sold? Are there any deal-killer items the seller is aware of (foundation, flood, title, zoning, code violations)?
- Is there a deadline driving the sale (1031 exchange, divorce, estate, relocation)? That informs how much negotiation room exists.
- Schools are F-rated, which usually means shorter tenancies and higher turnover. Who's the typical renter profile here, and what's been the actual vacancy rate?
- Crime grade is D in this area — have there been break-ins, vandalism, or insurance claims at this property in the last 3 years? What carrier currently insures it and at what premium?
- What's the average days-on-market for RENTAL listings here right now (not sales)? A rising rental-DOM trend means longer vacancies and softer asking-rent achievability than the comps imply.
- What's the recent tenant-quality profile in this submarket — average credit score on applications, eviction rate, late-payment / NSF rate, and stable-employment percentage? A property-management company in the area should have these aggregated.
- How much new for-sale + rental construction is in the pipeline within 1–3 miles? Heavy new supply typically softens prices + rents 12–24 months out; constrained supply supports both.
Investment metrics
- 1% rule
- 2.09% ✓
- Cap rate
- 17.85%
- Cash-on-cash
- 41.26%
- DSCR
- 2.84
- GRM
- 4.0
CMA / ARV
- ARV (median comp)
- $169,997
- List price
- $59,900
- Delta
- -64.76%
- Verdict
- UNDERPRICED
- Comps
- 20 within 1.0 mi
Show comp detail 12 sales within ~0.75 mi
| Address | Dist | Beds/Ba | Sqft | Sold | Price | $/sf | Match |
|---|---|---|---|---|---|---|---|
| 1209 Cook St | 0.21mi | 3/1.5 | 1,404 (+3%) | 6mo | $40,500 | $29 | 78 |
| 29 Bouck St | 0.20mi | 4/2.0 (+1) | 1,380 (+1%) | 4mo | $89,900 | $65 | 76 |
| 201 Smith St | 0.05mi | 3/1.5 | 1,248 (-8%) | 7mo | $99,200 | $79 | 76 |
| 3 Bouck St | 0.31mi | 3/1.0 | 1,380 (+1%) | 12mo | $155,000 | $112 | 73 |
| 35 Bouck St | 0.17mi | 4/1.0 (+1) | 1,255 (-8%) | 3mo | $157,978 | $126 | 72 |
| 1182 Cook Street St | 0.16mi | 3/1.0 | 1,163 (-14%) | 6mo | $162,000 | $139 | 64 |
| 216 Smith St | 0.08mi | 4/1.5 (+1) | 1,431 (+5%) | 22mo | $204,900 | $143 | 62 |
| 217 Smith St St | 0.12mi | 3/2.0 | 1,160 (-15%) | 7mo | $55,888 | $48 | 60 |
| 31 Mountain View Rd | 0.29mi | 3/1.5 | 1,528 (+12%) | 9mo | $219,000 | $143 | 57 |
| 17 Hammond St | 0.33mi | 4/1.0 (+1) | 1,536 (+13%) | 3mo | $165,000 | $107 | 56 |
| 1031 Cook St | 0.62mi | 3/2.0 | 1,350 (-1%) | 22mo | $165,000 | $122 | 47 |
| 52 Smith St | 0.66mi | 3/1.5 | 1,194 (-12%) | 21mo | $264,000 | $221 | 29 |
Match score weights: distance 35% · size 25% · config 20% · recency 20%. Top-matched comps best support the ARV.
Projected returns pro-forma
-3.0% appreciation · 3.0% rent growth · sell at horizon
- IRR
- 37.8%
- Equity multiple
- 2.61×
- Total profit
- $27,043
- Equity at exit
- $8,931
- IRR
- 44.4%
- Equity multiple
- 5.23×
- Total profit
- $70,922
- Equity at exit
- $5,179
Cash invested: $16,772 (down + closing). Projections, not guarantees.
Landlord ↔ Tenant lean methodology
- Overall (STATE)
- 15 Strongly Tenant-Friendly
- State New York
- 15 Strongly Tenant-Friendly · D+10
- County
- — inherits STATE
- City
- — inherits STATE
ZIP-level market 12929
- Home prices YoY
- -2.8%
- Active inventory
- 10
- Price-to-rent
- 4.0×
Monthly cashflow live
- Estimated rent
- $1,254 medium interval (Pro) →
- Mortgage (P&I)
- −$314
- Tax est. 1.5%
- −$75 /mo · $898/yr
- Insurance
- −$25
- HOA
- −$0
- Vacancy / Maint / Mgmt
- −$263
- Net cashflow
- $577
Break-even live
Sensitivity live
| Price | -10% $618 | -5% $597 | +0% $577 | +5% $556 | +10% $535 |
|---|---|---|---|---|---|
| Rent | -10% $478 | -5% $527 | +0% $577 | +5% $626 | +10% $676 |
| Rate | -1.0pp $607 | -0.5pp $592 | base $577 | +0.5pp $561 | +1.0pp $545 |
UW: 25.0% down · 7.5% · 30yr · 1.5% tax · 5.0% vac · 8.0% maint · 8.0% mgmt
Financing live
Cash to close
- Down payment
- $14,975
- Closing costs
- $1,797
- Reserves months
- —
- Total cash needed
- —
Loan-product check · same deal, 3 products live
Conventional
25% down · 7.5% · 30yr
- Down + closing
- —
- Monthly P&I
- —
- Monthly cashflow
- —
- DSCR
- —
- Eligible?
- —
Personal DTI + credit; lowest rate.
DSCR
20% down · 8.5% · 30yr
- Down + closing
- —
- Monthly P&I
- —
- Monthly cashflow
- —
- DSCR
- —
- Eligible?
- —
No personal income docs; deal must DSCR.
Hard money
10% down · 12.0% · 12mo
- Down + closing
- —
- Monthly P&I
- —
- Monthly cashflow
- —
- DSCR
- —
- Eligible?
- —
Short-term bridge; refi at stabilization.
Listing history 13 events
-
2026-06-09statusdays on market $59,900 Pending 73 DOM
-
2026-06-08days on market $59,900 Active 72 DOM
-
2026-06-07days on market $59,900 Active 71 DOM
-
2026-06-07days on market $59,900 Active 70 DOM
-
2026-06-04days on market $59,900 Active 67 DOM
-
2026-06-02days on market $59,900 Active 66 DOM
-
2026-06-01days on market $59,900 Active 65 DOM
-
2026-05-31days on market $59,900 Active 64 DOM
-
2026-05-14price $59,900 449-char remark
Show marketing remark (449 chars)
Old style home on dead end street in village of Dannemora close to stores and dining. There are three bedrooms, one down and two upstairs and a large eat in kitchen with cooktop on the main level. Bathroom is located on the second floor. A laundry area, living room and dining room are loacted on the main level. There is a large covered front porch and nice sized backyard to enjoy the outdoors. There is a one car garag and shed for added storage.
-
2026-03-28price $74,900 449-char remark
Show marketing remark (449 chars)
Old style home on dead end street in village of Dannemora close to stores and dining. There are three bedrooms, one down and two upstairs and a large eat in kitchen with cooktop on the main level. Bathroom is located on the second floor. A laundry area, living room and dining room are loacted on the main level. There is a large covered front porch and nice sized backyard to enjoy the outdoors. There is a one car garag and shed for added storage.
-
2026-03-27$47,900 Active 449-char remark
Show marketing remark (449 chars)
Old style home on dead end street in village of Dannemora close to stores and dining. There are three bedrooms, one down and two upstairs and a large eat in kitchen with cooktop on the main level. Bathroom is located on the second floor. A laundry area, living room and dining room are loacted on the main level. There is a large covered front porch and nice sized backyard to enjoy the outdoors. There is a one car garag and shed for added storage.
-
2016-08-31soldstatus $76,000 156-char remark
Show marketing remark (156 chars)
It would be hard to find a better value than this. 3 Bedrooms with one on the main floor. Well maintained with newer roof and vinyl siding. Large back yard.
-
2015-09-21$79,000 156-char remark
Show marketing remark (156 chars)
It would be hard to find a better value than this. 3 Bedrooms with one on the main floor. Well maintained with newer roof and vinyl siding. Large back yard.
ⓘ Source: listings_history table (triggers on properties + properties_extension) + one-shot
backfill from property_details.listing_events for pre-trigger history.
Nearby sold comps map
Loading sold comps map…
Walkable amenities ~0.75 mi
Loading nearby amenities…
Taxation est. · year 1
- Rental income
- $15,048
- − Mortgage interest
- −$3,355
- − Property taxes
- −$898
- − Insurance
- −$300
- − Repairs & maintenance
- −$1,204
- − Management
- −$1,204
- − Depreciation
- −$1,743
- Taxable income
- $6,344
- Est. tax owed @ 24.0%
- −$1,523
- After-tax cash flow
- $5,398/yr
For passive investors: Depreciation is non-cash, so a rental often shows a tax loss while cash-flowing — sheltering income. Rental losses are passive: they offset passive income freely, and up to $25,000/yr can offset ordinary (W-2) income if you actively participate and your MAGI is under $100k (phasing out to $0 by $150k); unused losses carry forward. On sale, claimed depreciation is recaptured at up to 25%, and gains may owe capital-gains tax (a 1031 exchange can defer both). Figures are a year-1 estimate at your 24.0% rate — not tax advice; consult a CPA.
Condition & rehab AI · 12 photos
This property requires extensive repairs and renovations to bring it up to a livable condition. Significant work is needed on the exterior, roof, flooring, interior walls, bathrooms, kitchen, HVAC system, and landscaping.
Repairs flagged
- Major Exterior siding — Significant damage and wear
- Major Roof — Missing shingles and visible damage
- Major Flooring — Worn-out and in need of replacement
- Major Interior walls — Painted walls with visible wear
- Major Bathrooms — Exposed framing, missing fixtures
- Major Kitchen — Worn-out countertops, outdated cabinets
- Major HVAC/mechanicals — No visible systems, likely outdated
- Major Landscaping — Overgrown yard, unkempt appearance
Value-add opportunities
- Resale New exterior siding — Enhances curb appeal and property value
- Resale New roof — Improves structural integrity and longevity
- Resale New flooring — Enhances living space and property value
- Resale Paint interior walls — Freshens up the interior and improves property value
- Resale Renovate bathrooms — Modernizes the space and improves property value
- Resale Update kitchen — Modernizes the space and improves property value
- Resale Install HVAC system — Improves comfort and energy efficiency
- Resale Landscaping and curb appeal — Enhances curb appeal and property value
Renovation cost estimate screening
| Repair item | Severity | Est. cost |
|---|---|---|
| Exterior siding · Significant damage and wear | Major | $15,000–50,000 |
| Roof · Missing shingles and visible damage | Major | $15,000–50,000 |
| Flooring · Worn-out and in need of replacement | Major | $15,000–50,000 |
| Interior walls · Painted walls with visible wear | Major | $15,000–50,000 |
| Bathrooms · Exposed framing, missing fixtures | Major | $15,000–50,000 |
| Kitchen · Worn-out countertops, outdated cabinets | Major | $15,000–50,000 |
| HVAC/mechanicals · No visible systems, likely outdated | Major | $15,000–50,000 |
| Landscaping · Overgrown yard, unkempt appearance | Major | $15,000–50,000 |
| Total estimated repair cost · 8 items | $120,000–400,000 |
Value-add ROI direction
- Resale New exterior siding — Enhances curb appeal and property value ↑
- Resale New roof — Improves structural integrity and longevity ↑
- Resale New flooring — Enhances living space and property value ↑
- Resale Paint interior walls — Freshens up the interior and improves property value ↑
- Resale Renovate bathrooms — Modernizes the space and improves property value ↑
- Resale Update kitchen — Modernizes the space and improves property value ↑
- Resale Install HVAC system — Improves comfort and energy efficiency ↑
- Resale Landscaping and curb appeal — Enhances curb appeal and property value ↑
ⓘ Cost ranges are severity-bucket heuristics (US national rule-of-thumb). Get contractor quotes + a written scope before underwriting a rehab budget.
Schools (NCES district)
- District
- Saranac Central School District
- NCES district ID
- 3600009
- Math proficiency
- 43% ▼ -9.00%
- Reading proficiency
- 56% ▲ 8.00%
- Median HH income
- $59,066
- Composite
- 43.19/100
- National rank
- #3065
- State rank
- #374 of 590 in NY
Livability — Dannemora
- Score
- 57/100
- State rank
- #1079
- US rank
- #21686
Category grades
Schools grade is shown separately in the Schools card above.
Census & demographics
- Census place
- Dannemora, NY
- City population
- 2,882
- Population (ZIP)
- 2,882
Population outlook (Clinton County) Hauer SSP2
- Today (2025)
- 78,791 people
- By 2030
- 76,848 · -2.5%
- By 2040
- 71,579 · -9.2%
- By 2050
- 66,471 · -15.6%
- By 2075
- 57,361 · -27.2%
- By 2100
- 47,232 · -40.1%
Race, ethnicity, and origin ACS 2023
- Neighborhood character
- Diverse neighborhood (Simpson 0.61)
- Race & ethnicity
- White 50% Black 34% Hispanic / Latino 13% Two or more races 2%
- Hispanic origin (detail)
- Puerto Rican 3% Dominican 1%
- Common ancestry
- Lithuanian 4% Slovak 2% German 1%
- Foreign-born
- 13% · Canada
- Languages at home
- 91% English-only · Spanish 8%
Political lean MEDSL · Clinton
- 2024 margin
- Toss-up / Even · D 48.9% · R 51.1%
- 2008→2024 swing
- -25.1pp toward R · 2008: 22.9pp · 2024: -2.2pp
- All cycles
- 2024: R+2.2 2020: D+5.2 2016: D+0.9 2012: D+25.6 2008: D+22.9
Not yet ingested
- Civics
- —
Market trends
- HPI YoY
- ▼ -7.37%
- Current HPI
- 259.4451
- Rent YoY
- —
- Metro
- —
- State GDP YoY
- ▲ 2.60%
- F500 in state
- 92
Industry mix (Fortune 500 HQ in NY)
| Industry | F500 HQs | Revenue |
|---|---|---|
| Financial Services | 10 | $950B |
|
||
| Consumer Goods | 9 | $162B |
|
||
| Insurance | 4 | $225B |
|
||
| Telecommunications | 2 | $144B |
|
||
| Pharmaceuticals | 2 | $112B |
|
||
| Media / Entertainment | 2 | $69B |
|
||
Price history
-24.2% since first listed5 events — show timeline
- 2026-05-14 Price Changed $59,900 ACVMLS
- 2026-03-28 Price Changed $74,900 ACVMLS
- 2026-03-27 Listed $47,900 ACVMLS
- 2016-08-31 Sold (MLS) $76,000 ACVMLS
- 2015-09-21 Listed $79,000 ACVMLS
Cash-flow waterfall
monthlySold comps — $/sqft
last 12 mo · ≤1 miLoading sold comps…