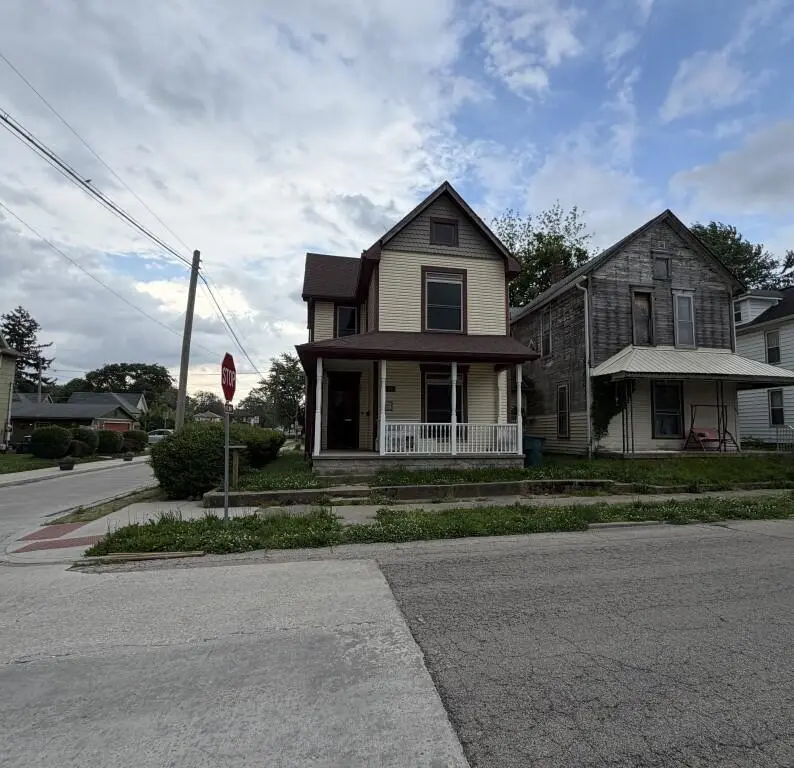
236 N Vine St · Muncie, IN
Flood risk 6/10 · Moderate
- FEMA flood zone
- X (shaded)
- Chance of flooding over 30 yrs
- 0.71%
- Est. flood insurance / yr
- $473 – $860
Fire risk 1/10 · Minimal
- Est. fire insurance / yr
- $717 – $1,331
Heat risk 3/10 · Minor
- Hot days now (above 100°F)
- 7 days/yr
- Hot days in 30 yrs
- 18 days/yr
Wind risk 2/10 · Minimal
- Chance of severe wind over 30 yrs
- 0.0%
Air-quality risk 3/10 · Minor
- Unhealthy air days now
- 2 days/yr
- Unhealthy air days in 30 yrs
- 3 days/yr
Risk factors via First Street. Map © Google.
Why this score? — see what drove the B+ grade
The composite is a weighted blend of 9 inputs, each scored 0–100. Each bar is that input's sub-score; the figure is the points it added to the 100-point composite (weight × sub-score).
- Cash flow +27.0/30.0
- ARV discount +14.8/15.0
- DSCR +9.3/10.0
- 1% rule +8.1/10.0
- Appreciation +7.6/10.0
- Livability +4.0/5.0
- Rent growth +3.3/5.0
- Condition / age +2.5/5.0
- Schools +1.7/10.0
$99,900
🖨 Deal sheet 📄 Offer letter ✓ Due diligence
Listing remarks
Fantastic opportunity at 236 N Vine St, Muncie! This spacious home offers 2,131 sq ft of potential. The property features a central cooling system with baseboard heating, a partial unfinished basement, and public water/sewer connections. Bring your design ideas to customize the kitchen and wall finishes exactly to your taste, as no appliances or cabinets are currently installed. Ideal for anyone looking to create a personalized dream space or investment. Selling as-is.
Key facts
- Customize kitchen
- Baseboard heating
- 4,000 sq ft lot
Tags
Property features AI
Finance
- Other: Property is vacant
Exterior
- Parking: On-street parking
- Utilities: Public water; Public sewer
- Home design: Two-story home; Built in 1890; Fixer condition
- Construction: Has unfinished basement
- Exterior features: Neighborhood view; Assessor-listed lot size
Interior
- Kitchen: No appliances listed
- Bedrooms: Primary bedroom; Bedroom 2; Bedroom 3; Bedroom 4; Total of 7 rooms
- Bathrooms: 1 full bathroom; 1 half bathroom
- Heating & cooling: Forced air heating; Ceiling fans and other cooling
- Interior features: No special interior features listed; Unfinished basement
- Laundry & utility: No laundry or utility appliances listed
Neighborhood map
What this means for you Summary
Snapshot
- This is a 4-bed/1.5-bath single-family listed at $100k.
Deal economics
- At list price, monthly cash flow is $280 ($3k/yr) — positive.
- The deal already cash-flows at list — no discount required.
- Meets the 1% rule at list price ($1k rent vs $100k).
- Recommended offer: $98k (1.5% below list) — sets the bar for market timing.
- Cap rate 9.7% vs local median 6.0% in Muncie — top-decile yield for the area; either an underpriced asset or a hidden risk that comps aren't pricing in. Stress-test before assuming the spread holds.
Location & tenants
- Location reads 80/100 on livability (#18 in IN, #1,654 nationally) — a professional / high-income tenant draw. Strengths: amenities A+, commute A+, cost of living A+; Watch: schools D+, crime F, employment F.
- Muncie Community Schools (urban): math 18% / reading 25% proficiency, ranked #275 of 301 in IN (top 91%) — low school quality limits family demand, transient renter base, plan for 1-2y turnover; 68% free/reduced lunch — lower-income household profile, screen leases tightly.
- Market conditions: Rents rising (+3.3%/yr); 26 active listings in the ZIP; 5 comparable units currently listed for rent nearby; rentals lingering (median 44d on market — plan ~5-8 weeks vacancy on turnover, expect pricing pressure); 100% of comp listings sitting > 30 days — soft ceiling on asking rent; lower-income renter base — watch delinquency; 171 units permitted in Delaware County in 2024 (57 in 5+ unit buildings).
- This rent runs 43% of the median local income ($36k/yr) — at the standard rent-burdened threshold; future hikes will face affordability resistance.
Forward outlook
- In year one you build about $6k of equity ($691 loan paydown + $5k appreciation (5.3% local appreciation)).
- Delaware County population projected at -11% by 2050 — secular population decline; favor cash flow + early exit over multi-decade hold.
- At projected returns (5.3% appreciation + 3.3% rent growth), your $28k cash investment doubles in ~3 years — after that, you're playing with house money.
- By year 6, paydown + projected appreciation supports a ~$32k cash-out refi (75% LTV) — recoverable capital for the next deal without selling this one.
Negotiation context
- It's been on market 29 days — a 2% lower offer ($98k) is reasonable based on typical stale-listing flexibility.
Risks & watch-outs
- Watch-outs: built in 1890 — expect roof / HVAC / electrical / plumbing capex.
- Climate carrying-cost: major flood risk — expect insurance premiums to compound above CPI over the hold.
Questions for the listing agent
- Built in 1890 — when were the roof, HVAC, electrical panel, plumbing, and water heater last replaced?
- Is there a deadline driving the sale (1031 exchange, divorce, estate, relocation)? That informs how much negotiation room exists.
- Schools are D-rated, which usually means shorter tenancies and higher turnover. Who's the typical renter profile here, and what's been the actual vacancy rate?
- Crime grade is F in this area — have there been break-ins, vandalism, or insurance claims at this property in the last 3 years? What carrier currently insures it and at what premium?
- What's the average days-on-market for RENTAL listings here right now (not sales)? A rising rental-DOM trend means longer vacancies and softer asking-rent achievability than the comps imply.
- What's the recent tenant-quality profile in this submarket — average credit score on applications, eviction rate, late-payment / NSF rate, and stable-employment percentage? A property-management company in the area should have these aggregated.
- How much new for-sale + rental construction is in the pipeline within 1–3 miles? Heavy new supply typically softens prices + rents 12–24 months out; constrained supply supports both.
Investment metrics
- 1% rule
- 1.31% ✓
- Cap rate
- 9.66%
- Cash-on-cash
- 12.02%
- DSCR
- 1.53
- GRM
- 6.3
CMA / ARV
- ARV (on-the-fly)
- $119,336
- Comps found
- 12
Show comp detail 12 sales within ~0.75 mi
| Address | Dist | Beds/Ba | Sqft | Sold | Price | $/sf | Match |
|---|---|---|---|---|---|---|---|
| 310 N Monroe St | 0.07mi | 4/2.0 | 2,140 (+0%) | 14mo | $150,000 | $70 | 83 |
| 807 N Elm St | 0.46mi | 4/1.0 | 2,064 (-3%) | 8mo | $50,000 | $24 | 64 |
| 725 E Jackson St | 0.21mi | 3/1.5 (-1) | 2,374 (+11%) | 10mo | $220,000 | $93 | 58 |
| 907 E Main St | 0.21mi | 3/1.5 (-1) | 1,992 (-6%) | 21mo | $40,000 | $20 | 57 |
| 923 E Main St | 0.22mi | 4/1.5 | 1,940 (-9%) | 22mo | $108,300 | $56 | 57 |
| 623 E Willard St | 0.70mi | 5/2.0 (+1) | 2,065 (-3%) | 4mo | $195,000 | $94 | 52 |
| 324 S Beacon St | 0.39mi | 4/2.0 | 1,848 (-13%) | 10mo | $21,150 | $11 | 49 |
| 411 - 413 W Adams St | 0.64mi | 3/3.5 (-1) | 2,208 (+4%) | 6mo | $105,000 | $48 | 46 |
| 229 N Hackley St | 0.09mi | 3/2.5 (-1) | 1,822 (-14%) | 20mo | $165,500 | $91 | 46 |
| 1405 E Washington St | 0.48mi | 4/2.0 | 1,958 (-8%) | 19mo | $87,500 | $45 | 46 |
| 917 S Grant St | 0.70mi | 3/2.0 (-1) | 2,304 (+8%) | 12mo | $130,000 | $56 | 37 |
| 609 N Alameda Dr | 0.75mi | 4/2.0 | 2,262 (+6%) | 20mo | $138,500 | $61 | 36 |
Match score weights: distance 35% · size 25% · config 20% · recency 20%. Top-matched comps best support the ARV.
Projected returns pro-forma
5.27% appreciation · 3.27% rent growth · sell at horizon
- IRR
- 24.0%
- Equity multiple
- 2.53×
- Total profit
- $42,858
- Equity at exit
- $58,285
- IRR
- 23.3%
- Equity multiple
- 5.08×
- Total profit
- $114,264
- Equity at exit
- $102,003
Cash invested: $27,972 (down + closing). Projections, not guarantees.
Landlord ↔ Tenant lean methodology
- Overall (STATE)
- 90 Strongly Landlord-Friendly
- State Indiana
- 90 Strongly Landlord-Friendly · R+11
- County
- — inherits STATE
- City
- — inherits STATE
ZIP-level market 47305
- Home prices YoY
- 2.0%
- Rents YoY
- 3.3%
- Active inventory
- 26
- Price-to-rent
- 6.3×
Monthly cashflow live
- Estimated rent
- $1,313 high interval (Pro) →
- Mortgage (P&I)
- −$524
- Tax from tax record
- −$192 /mo · $2,300/yr
- Insurance
- −$42
- HOA
- −$0
- Vacancy / Maint / Mgmt
- −$276
- Net cashflow
- $280
Break-even live
UW: 25.0% down · 7.5% · 30yr · 1.5% tax · 5.0% vac · 8.0% maint · 8.0% mgmt
Financing live
Cash to close
- Down payment
- $24,975
- Closing costs
- $2,997
- Reserves months
- —
- Total cash needed
- —
Loan-product check · same deal, 3 products live
Conventional
25% down · 7.5% · 30yr
- Down + closing
- —
- Monthly P&I
- —
- Monthly cashflow
- —
- DSCR
- —
- Eligible?
- —
Personal DTI + credit; lowest rate.
DSCR
20% down · 8.5% · 30yr
- Down + closing
- —
- Monthly P&I
- —
- Monthly cashflow
- —
- DSCR
- —
- Eligible?
- —
No personal income docs; deal must DSCR.
Hard money
10% down · 12.0% · 12mo
- Down + closing
- —
- Monthly P&I
- —
- Monthly cashflow
- —
- DSCR
- —
- Eligible?
- —
Short-term bridge; refi at stabilization.
Rent comps 5 comps
| Address | Beds | Baths | Sqft | Rent | $/sqft | DOM | Units | Dist |
|---|---|---|---|---|---|---|---|---|
| 816 N New York Ave Muncie, IN | 3.0–4.0 | 1.0 | 1200 | $1,450 | $1.21 | 43d | 10 | 1.18mi |
| 623 W 9th St Muncie, IN | 3.0 | 1.0 | 1574 | $1,499 | $0.95 | 43d | 1 | 1.27mi |
| 605 W 10th St Muncie, IN | 3.0 | 1.0 | 1688 | $1,150 | $0.68 | 43d | 1 | 1.31mi |
| 312 S Calvert St Muncie, IN | 3.0 | 1.0 | 1813 | $1,500 | $0.83 | 43d | 1 | 1.48mi |
| 3001 N Westwood Rd Muncie, IN | 3.0 | 1.0 | 1837 | $1,200 | $0.65 | 43d | 1 | 1.49mi |
Listing history 19 events
-
2026-06-19days on market $99,900 Active 29 DOM
-
2026-06-18days on market $99,900 Active 28 DOM
-
2026-06-17days on market $99,900 Active 27 DOM
-
2026-06-16days on market $99,900 Active 26 DOM
-
2026-06-15days on market $99,900 Active 25 DOM
-
2026-06-14days on market $99,900 Active 23 DOM
-
2026-06-13days on market $99,900 Active 22 DOM
-
2026-06-10days on market $99,900 Active 20 DOM
-
2026-06-09days on market $99,900 Active 19 DOM
-
2026-06-09price $99,900 Active 18 DOM
-
2026-06-08days on market $114,900 Active 18 DOM
-
2026-06-07days on market $114,900 Active 17 DOM
-
2026-06-05days on market $114,900 Active 14 DOM
-
2026-06-03days on market $114,900 Active 13 DOM
-
2026-06-02days on market $114,900 Active 12 DOM
-
2026-06-01days on market $114,900 Active 11 DOM
-
2026-05-31days on market $114,900 Active 10 DOM
-
2026-05-30days on market $114,900 Active 9 DOM
-
2026-05-21$114,900 Active
ⓘ Source: listings_history table (triggers on properties + properties_extension) + one-shot
backfill from property_details.listing_events for pre-trigger history.
Tax reassessment forecast IN · Partial reset (capped growth)
- Current annual tax
- $2,300 · $192/mo
- Projected year-2 tax
- $2,300 · $192/mo
- Expected delta
- $0/yr ($0/mo · 0.0%)
ⓘ Screening estimate from a state-policy table — verify with the county assessor before closing.
Climate risk First Street
- Flood 6/10 Major FEMA zone X (shaded) · 71% chance over 30 yrs
- Wildfire 1/10 Low
- Heat 3/10 Moderate 7 d/yr ≥100°F today · 18 d/yr by 30 yrs out
- Wind 2/10 Low 0% chance of damaging wind over 30 yrs
- Air quality 3/10 Moderate 2 unhealthy d/yr today · 3 by 30 yrs out
Nearby sold comps map
Loading sold comps map…
Walkable amenities ~0.75 mi
Loading nearby amenities…
Taxation est. · year 1
- Rental income
- $15,756
- − Mortgage interest
- −$5,596
- − Property taxes
- −$2,300
- − Insurance
- −$500
- − Repairs & maintenance
- −$1,261
- − Management
- −$1,261
- − Depreciation
- −$2,906
- Taxable income
- $1,934
- Est. tax owed @ 24.0%
- −$464
- After-tax cash flow
- $2,897/yr
For passive investors: Depreciation is non-cash, so a rental often shows a tax loss while cash-flowing — sheltering income. Rental losses are passive: they offset passive income freely, and up to $25,000/yr can offset ordinary (W-2) income if you actively participate and your MAGI is under $100k (phasing out to $0 by $150k); unused losses carry forward. On sale, claimed depreciation is recaptured at up to 25%, and gains may owe capital-gains tax (a 1031 exchange can defer both). Figures are a year-1 estimate at your 24.0% rate — not tax advice; consult a CPA.
Schools (NCES district)
- District
- Muncie Community Schools
- NCES district ID
- 1807320
- Math proficiency
- 18% ▼ -9.00%
- Reading proficiency
- 25% ▼ -4.00%
- Median HH income
- $30,052
- Composite
- 17.22/100
- National rank
- #9099
- State rank
- #275 of 301 in IN
Livability — Muncie
- Score
- 80/100
- State rank
- #18
- US rank
- #1654
Category grades
Schools grade is shown separately in the Schools card above.
Census & demographics
- Census place
- Muncie, IN
- County
- Delaware County · 84,658 people
- City population
- 84,658
- Metro
- Muncie, IN
- Population (ZIP)
- 3,556
- Household income
- $36,389
- Rent vs Own
- Severe rent burden
- 336.0
Population outlook (Delaware County) Hauer SSP2
- Today (2025)
- 113,036 people
- By 2030
- 111,313 · -1.5%
- By 2040
- 106,432 · -5.8%
- By 2050
- 100,747 · -10.9%
- By 2075
- 91,000 · -19.5%
- By 2100
- 80,687 · -28.6%
Race, ethnicity, and origin ACS 2023
- Neighborhood character
- Diverse neighborhood (Simpson 0.60)
- Race & ethnicity
- White 62% Two or more races 24% Black 8% Hispanic / Latino 7%
- Hispanic origin (detail)
- Mexican 6%
- Common ancestry
- Italian 4% Iranian 1% Lithuanian 1%
- Foreign-born
- 1%
- Languages at home
- 96% English-only · Spanish 2% Arabic 1% Other Asian/Pacific 1%
Political lean MEDSL · Delaware
- 2024 margin
- R (+15.8) · D 41.2% · R 57.0% · Other 1.8%
- 2008→2024 swing
- -30.8pp toward R · 2008: 15.0pp · 2024: -15.8pp
- All cycles
- 2024: R+15.8 2020: R+13.2 2016: R+13.7 2012: D+3.1 2008: D+15.0
Not yet ingested
- Civics
- —
Market trends
- HPI YoY
- ▲ 5.27%
- Current HPI
- 269.888
- Rent YoY
- ▲ 3.27%
- Metro
- Muncie, IN
- State GDP YoY
- ▲ 2.90%
- F500 in state
- 18
Industry mix (Fortune 500 HQ in IN)
| Industry | F500 HQs | Revenue |
|---|---|---|
| Industrial Machinery | 2 | $37B |
|
||
| Healthcare | 1 | $177B |
|
||
| Pharmaceuticals | 1 | $45B |
|
||
| Metals / Steel | 1 | $18B |
|
||
| Agriculture | 1 | $17B |
|
||
| Packaging | 1 | $12B |
|
||
Price history
1 event — show timeline
- 2026-05-21 Listed $114,900 NIRA MLS as Distributed by MLS Grid
Property tax history
+18.0%/yrLatest (2024): $2,300 · +168.1% YoY. Source: county tax records.
Cash-flow waterfall
monthlySold comps — $/sqft
last 12 mo · ≤1 miLoading sold comps…