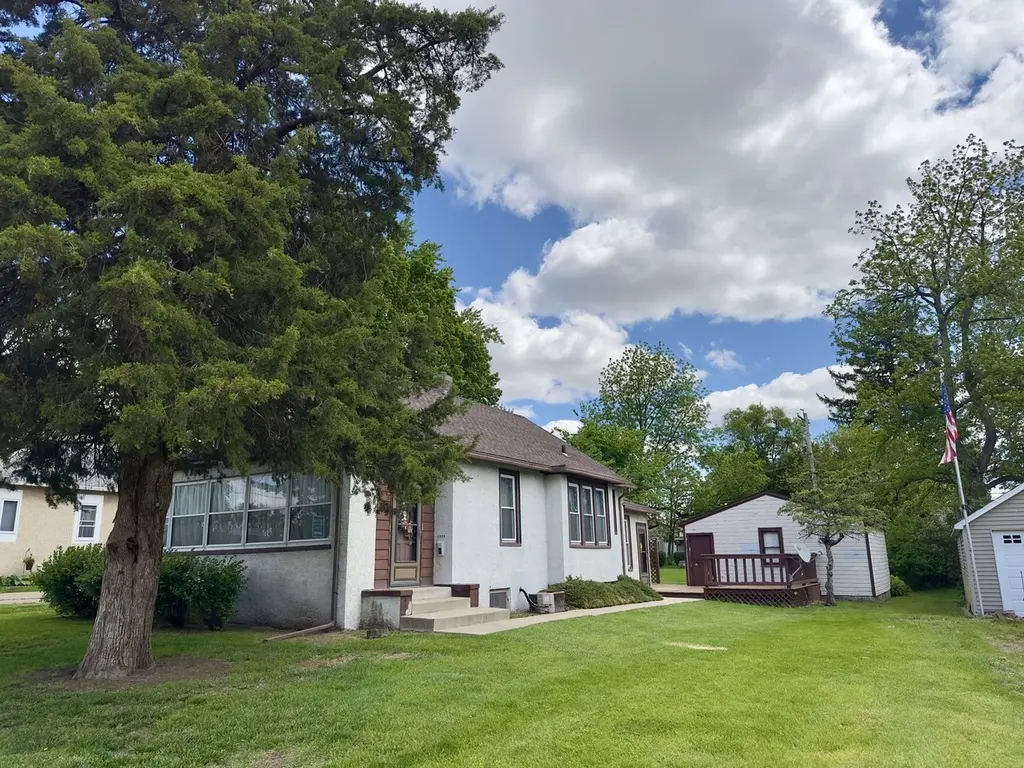
1332 Chartres St · LaSalle, IL
Flood risk 1/10 · Minimal
- FEMA flood zone
- X (unshaded)
- Chance of flooding over 30 yrs
- 0.0%
- Est. flood insurance / yr
- $473 – $860
Fire risk 1/10 · Minimal
- Est. fire insurance / yr
- $804 – $1,492
Heat risk 3/10 · Minor
- Hot days now (above 104°F)
- 7 days/yr
- Hot days in 30 yrs
- 16 days/yr
Wind risk 2/10 · Minimal
- Chance of severe wind over 30 yrs
- 1.0%
Air-quality risk 2/10 · Minimal
- Unhealthy air days now
- 1 days/yr
- Unhealthy air days in 30 yrs
- 1 days/yr
Risk factors via First Street. Map © Google.
Why this score? — see what drove the C+ grade
The composite is a weighted blend of 9 inputs, each scored 0–100. Each bar is that input's sub-score; the figure is the points it added to the 100-point composite (weight × sub-score).
- Cash flow +23.6/30.0
- ARV discount +15.0/15.0
- 1% rule +7.7/10.0
- DSCR +7.6/10.0
- Livability +3.2/5.0
- Rent growth +2.5/5.0
- Condition / age +2.5/5.0
- Schools +1.7/10.0
- Appreciation +0.0/10.0
$89,500
🖨 Deal sheet 📄 Offer letter ✓ Due diligence
Listing remarks
Full of character and opportunity, this affordable 3-bedroom home is ready for new owners to make it their own! The original front porch ceiling remains untouched and adds a nice vintage touch. Inside you'll find a spacious eat-in kitchen, replacement windows, and appliances that will stay! The large deck, 2-car garage, and roomy yard offer plenty of outdoor space to enjoy. Two bedrooms are joined by an interior doorway while still having separate entrances. Home is being sold AS IS and the price reflects the work needed. Conventional financing only. Great potential for buyers looking to add value with their own updates and improvements! Baker Lake is a very short stroll across the street!
Key facts
- Front porch ceiling
- Large deck
- Roomy yard
Tags
Property features AI
Finance
- Other: Fee simple ownership; Not currently leased; Located in LaSalle with easy interstate access
- HOA & community: No master association fee required; Community amenities nearby: park, pool, tennis courts, lake
Exterior
- Parking: Detached garage with garage door opener (garage owned); Gravel driveway; Total of 3 parking spaces, including 2 garage spaces
- Utilities: Public water; Public sewer; Electric service with fuses
- Home design: Detached single-family home; One-story
- Construction: Stucco exterior; Asphalt roof; Concrete perimeter and stone foundation; Built before 1978 (approximately 71–80 years old)
- Exterior features: Deck; Street paved with curbs and street lights; Access to nearby park, pool, tennis courts and lake; School bus service
Interior
- Kitchen: Range; Refrigerator; Eating area / table space
- Bedrooms: Three bedrooms (all on the main level); Master bedroom on the main level
- Flooring: Hardwood in some bedrooms; Carpet in living areas and some bedrooms; Vinyl in kitchen
- Bathrooms: One full bathroom
- Heating & cooling: Natural gas heat; Central air conditioning
- Interior features: First-floor bedroom; First-floor full bathroom; Unfinished partial basement; Six total rooms
- Laundry & utility: Dedicated laundry room; Dryer
Neighborhood map
What this means for you Summary
Snapshot
- This is a 3-bed/1.0-bath single-family listed at $90k.
Deal economics
- At list price, monthly cash flow is $169 ($2k/yr) — positive.
- The deal already cash-flows at list — no discount required.
- Meets the 1% rule at list price ($1k rent vs $90k).
- Recommended offer: $88k (1.5% below list) — sets the bar for market timing.
- Cap rate 8.6% vs local median 5.6% in LaSalle — top-decile yield for the area; either an underpriced asset or a hidden risk that comps aren't pricing in. Stress-test before assuming the spread holds.
Location & tenants
- Location reads 64/100 on livability (#718 in IL) — a middle-class / working-renter tenant base. Strengths: crime A+, cost of living A+, housing A+; Watch: health & safety C-, employment D+, amenities F.
- La Salle-Peru Twp Hsd 120 (town): math 15% / reading 26% proficiency, ranked #427 of 620 in IL (top 69%) — low school quality limits family demand, transient renter base, plan for 1-2y turnover.
- Zoned schools: La Salle-Peru Twp High School (math 15% / reading 26%, grade F, #350 of 693 statewide, top 51%, 1,198 students, 0% FRL).
- Market conditions: 68 active listings in the ZIP; 82 units permitted in LaSalle County in 2024 (0 in 5+ unit buildings).
Forward outlook
- Local home prices are declining (-3.0%/yr); year-one equity from $619 of loan paydown is wiped out by about $3k of value loss. Plan a longer hold.
- LaSalle County population projected at -16% by 2050 — secular population decline; favor cash flow + early exit over multi-decade hold.
Negotiation context
- It's been on market 22 days — a 2% lower offer ($88k) is reasonable based on typical stale-listing flexibility.
Risks & watch-outs
- Watch-outs: property tax is 2.9% of price; built in 1950 — expect roof / HVAC / electrical / plumbing capex.
Questions for the listing agent
- Built in 1950 — when were the roof, HVAC, electrical panel, plumbing, and water heater last replaced?
- Property tax is high relative to price — has the assessment been appealed recently, and will the sale trigger a re-assessment?
- Is there a deadline driving the sale (1031 exchange, divorce, estate, relocation)? That informs how much negotiation room exists.
- Schools are F-rated, which usually means shorter tenancies and higher turnover. Who's the typical renter profile here, and what's been the actual vacancy rate?
- What's the average days-on-market for RENTAL listings here right now (not sales)? A rising rental-DOM trend means longer vacancies and softer asking-rent achievability than the comps imply.
- What's the recent tenant-quality profile in this submarket — average credit score on applications, eviction rate, late-payment / NSF rate, and stable-employment percentage? A property-management company in the area should have these aggregated.
- How much new for-sale + rental construction is in the pipeline within 1–3 miles? Heavy new supply typically softens prices + rents 12–24 months out; constrained supply supports both.
Investment metrics
- 1% rule
- 1.27% ✓
- Cap rate
- 8.56%
- Cash-on-cash
- 8.08%
- DSCR
- 1.36
- GRM
- 6.6
CMA / ARV
- ARV (on-the-fly)
- $130,424
- Comps found
- 12
Show comp detail 12 sales within ~0.75 mi
| Address | Dist | Beds/Ba | Sqft | Sold | Price | $/sf | Match |
|---|---|---|---|---|---|---|---|
| 432 Roosevelt Rd | 0.32mi | 2/1.0 (-1) | 1,088 (-1%) | 3mo | $132,500 | $122 | 76 |
| 1419 Linden Ave | 0.11mi | 2/1.0 (-1) | 1,004 (-8%) | 1mo | $133,000 | $132 | 75 |
| 401 Garfield Ave | 0.54mi | 3/2.0 | 1,092 (-0%) | 4mo | $154,500 | $141 | 67 |
| 1532 Illinois St | 0.45mi | 3/1.0 | 1,180 (+8%) | 0mo | $162,000 | $137 | 66 |
| 1038 Wright St | 0.39mi | 2/1.0 (-1) | 1,005 (-8%) | 3mo | $95,000 | $95 | 60 |
| 1038 Wright St | 0.39mi | 2/1.0 (-1) | 1,005 (-8%) | 3mo | $95,000 | $95 | 60 |
| 43 Westclox Ave | 0.47mi | 2/1.0 (-1) | 1,164 (+6%) | 4mo | $33,000 | $28 | 60 |
| 748 7th St | 0.72mi | 3/1.0 | 1,146 (+5%) | 1mo | $135,900 | $119 | 58 |
| 422 Chartres St | 0.73mi | 2/1.0 (-1) | 1,096 (0%) | 4mo | $120,000 | $109 | 58 |
| 719 12th St | 0.66mi | 3/2.5 | 1,180 (+8%) | 2mo | $140,000 | $119 | 48 |
| 508 7th St | 0.62mi | 2/2.0 (-1) | 1,183 (+8%) | 3mo | $121,000 | $102 | 46 |
| 618 10th St | 0.71mi | 2/1.0 (-1) | 987 (-10%) | 1mo | $90,500 | $92 | 44 |
Match score weights: distance 35% · size 25% · config 20% · recency 20%. Top-matched comps best support the ARV.
Projected returns pro-forma
-3.0% appreciation · 3.0% rent growth · sell at horizon
- IRR
- -3.9%
- Equity multiple
- 0.85×
- Total profit
- $-3,671
- Equity at exit
- $13,345
- IRR
- 5.9%
- Equity multiple
- 1.44×
- Total profit
- $10,982
- Equity at exit
- $7,738
Cash invested: $25,060 (down + closing). Projections, not guarantees.
Landlord ↔ Tenant lean methodology
- Overall (STATE)
- 43 Moderately Tenant-Leaning
- State Illinois
- 43 Moderately Tenant-Leaning · D+7
- County
- — inherits STATE
- City
- — inherits STATE
ZIP-level market 61301
- Home prices YoY
- -24.3%
- Active inventory
- 68
- Price-to-rent
- 6.6×
Monthly cashflow live
- Estimated rent
- $1,133 medium interval (Pro) →
- Mortgage (P&I)
- −$469
- Tax from tax record
- −$220 /mo · $2,636/yr
- Insurance
- −$37
- HOA
- −$0
- Vacancy / Maint / Mgmt
- −$238
- Net cashflow
- $169
Break-even live
UW: 25.0% down · 7.5% · 30yr · 1.5% tax · 5.0% vac · 8.0% maint · 8.0% mgmt
Financing live
Cash to close
- Down payment
- $22,375
- Closing costs
- $2,685
- Reserves months
- —
- Total cash needed
- —
Loan-product check · same deal, 3 products live
Conventional
25% down · 7.5% · 30yr
- Down + closing
- —
- Monthly P&I
- —
- Monthly cashflow
- —
- DSCR
- —
- Eligible?
- —
Personal DTI + credit; lowest rate.
DSCR
20% down · 8.5% · 30yr
- Down + closing
- —
- Monthly P&I
- —
- Monthly cashflow
- —
- DSCR
- —
- Eligible?
- —
No personal income docs; deal must DSCR.
Hard money
10% down · 12.0% · 12mo
- Down + closing
- —
- Monthly P&I
- —
- Monthly cashflow
- —
- DSCR
- —
- Eligible?
- —
Short-term bridge; refi at stabilization.
Listing history 6 events
-
2026-06-07statusdays on market $89,500 Pending 22 DOM
-
2026-06-02days on market $89,500 Contingent - Continue to Show 19 DOM
-
2026-06-01days on market $89,500 Contingent - Continue to Show 18 DOM
-
2026-05-31days on market $89,500 Contingent - Continue to Show 17 DOM
-
2026-05-30days on market $89,500 Contingent - Continue to Show 16 DOM
-
2026-05-13$89,500 Active
ⓘ Source: listings_history table (triggers on properties + properties_extension) + one-shot
backfill from property_details.listing_events for pre-trigger history.
Tax reassessment forecast IL · Partial reset (capped growth)
- Current annual tax
- $2,636 · $220/mo
- Projected year-2 tax
- $2,636 · $220/mo
- Expected delta
- $0/yr ($0/mo · 0.0%)
ⓘ Screening estimate from a state-policy table — verify with the county assessor before closing.
Climate risk First Street
- Flood 1/10 Low FEMA zone X (unshaded) · 0% chance over 30 yrs
- Wildfire 1/10 Low
- Heat 3/10 Moderate 7 d/yr ≥104°F today · 16 d/yr by 30 yrs out
- Wind 2/10 Low 100% chance of damaging wind over 30 yrs
- Air quality 2/10 Low 1 unhealthy d/yr today · 1 by 30 yrs out
Nearby sold comps map
Loading sold comps map…
Walkable amenities ~0.75 mi
Loading nearby amenities…
Taxation est. · year 1
- Rental income
- $13,596
- − Mortgage interest
- −$5,013
- − Property taxes
- −$2,636
- − Insurance
- −$448
- − Repairs & maintenance
- −$1,088
- − Management
- −$1,088
- − Depreciation
- −$2,604
- Taxable income
- $720
- Est. tax owed @ 24.0%
- −$173
- After-tax cash flow
- $1,852/yr
For passive investors: Depreciation is non-cash, so a rental often shows a tax loss while cash-flowing — sheltering income. Rental losses are passive: they offset passive income freely, and up to $25,000/yr can offset ordinary (W-2) income if you actively participate and your MAGI is under $100k (phasing out to $0 by $150k); unused losses carry forward. On sale, claimed depreciation is recaptured at up to 25%, and gains may owe capital-gains tax (a 1031 exchange can defer both). Figures are a year-1 estimate at your 24.0% rate — not tax advice; consult a CPA.
Schools (NCES district)
- District
- La Salle-Peru Twp Hsd 120
- NCES district ID
- 1722110
- Math proficiency
- 15% ▼ -11.00%
- Reading proficiency
- 26% ▼ -11.00%
- Median HH income
- $40,449
- Composite
- 17.37/100
- National rank
- #9070
- State rank
- #427 of 620 in IL
Livability — LaSalle
- Score
- 64/100
- State rank
- #718
- US rank
- #14579
Category grades
Schools grade is shown separately in the Schools card above.
Census & demographics
- Census place
- LaSalle, IL
- Population (ZIP)
- 10,312
Population outlook (LaSalle County) Hauer SSP2
- Today (2025)
- 107,080 people
- By 2030
- 104,196 · -2.7%
- By 2040
- 97,413 · -9.0%
- By 2050
- 90,294 · -15.7%
- By 2075
- 76,252 · -28.8%
- By 2100
- 61,339 · -42.7%
Race, ethnicity, and origin ACS 2023
- Neighborhood character
- Predominantly White (74%)
- Race & ethnicity
- White 74% Hispanic / Latino 18% Two or more races 8% Black 5%
- Hispanic origin (detail)
- Mexican 18%
- Common ancestry
- Romanian 9% Lithuanian 3% Scotch-Irish 1%
- Foreign-born
- 6% · Canada
- Languages at home
- 87% English-only · Spanish 10% German/W. Germanic 1% Other Indo-European 1%
Political lean MEDSL · LaSalle
- 2024 margin
- R (+18.5) · D 40.1% · R 58.6% · Other 1.3%
- 2008→2024 swing
- -29.6pp toward R · 2008: 11.1pp · 2024: -18.5pp
- All cycles
- 2024: R+18.5 2020: R+14.3 2016: R+14.4 2012: R+0.4 2008: D+11.1
Not yet ingested
- Civics
- —
Market trends
- HPI YoY
- ▼ -52.46%
- Current HPI
- 163.091
- Rent YoY
- —
- Metro
- —
- State GDP YoY
- ▲ 1.59%
- F500 in state
- 60
Industry mix (Fortune 500 HQ in IL)
| Industry | F500 HQs | Revenue |
|---|---|---|
| Insurance | 4 | $201B |
|
||
| Consumer Goods | 4 | $87B |
|
||
| Industrial Machinery | 3 | $64B |
|
||
| Healthcare | 2 | $55B |
|
||
| Retail / Pharmacy | 1 | $148B |
|
||
| Agriculture / Food | 1 | $86B |
|
||
Price history
1 event — show timeline
- 2026-05-13 Listed $89,500 MRED as Distributed by MLS Grid
Property tax history
+7.0%/yrLatest (2024): $2,636 · +6.1% YoY. Source: county tax records.
Cash-flow waterfall
monthlySold comps — $/sqft
last 12 mo · ≤1 miLoading sold comps…