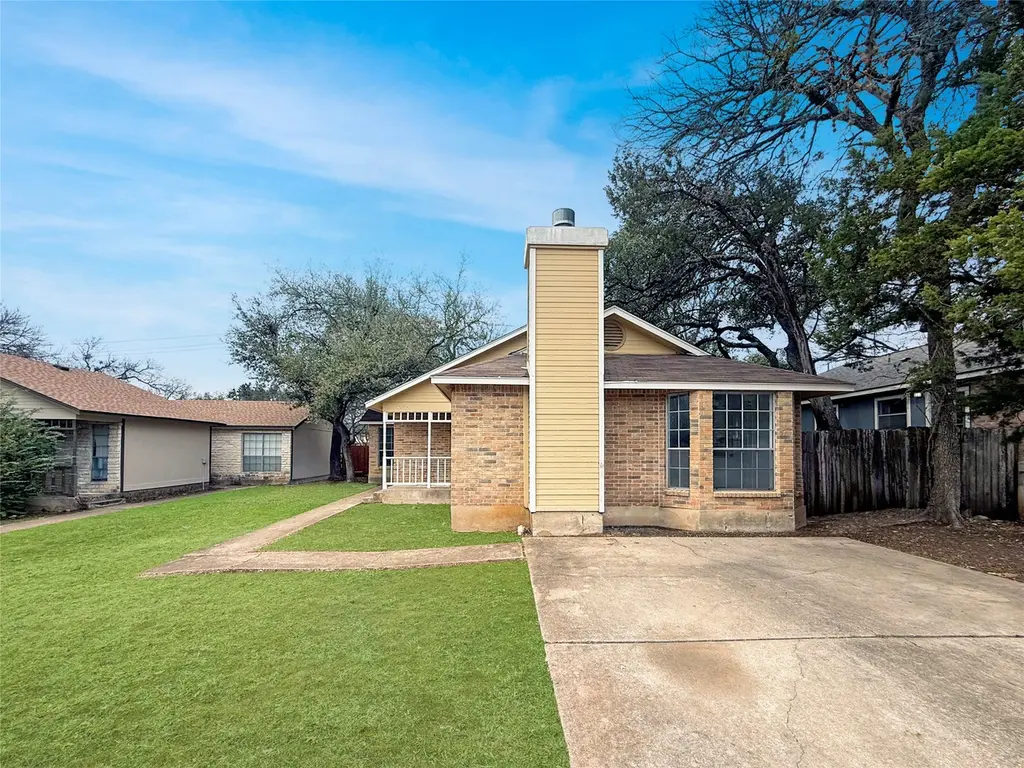
9622 Sugar Hill Dr Unit A · Austin, TX
Flood risk 1/10 · Minimal
- FEMA flood zone
- X (unshaded)
- Chance of flooding over 30 yrs
- 0.0%
- Est. flood insurance / yr
- $507 – $1,088
Fire risk 4/10 · Minor
- Est. fire insurance / yr
- $1,222 – $2,270
Heat risk 8/10 · Major
- Hot days now (above 108°F)
- 7 days/yr
- Hot days in 30 yrs
- 22 days/yr
Wind risk 8/10 · Major
- Chance of severe wind over 30 yrs
- 80.0%
Air-quality risk 2/10 · Minimal
- Unhealthy air days now
- 1 days/yr
- Unhealthy air days in 30 yrs
- 1 days/yr
Risk factors via First Street. Map © Google.
Why this score? — see what drove the D+ grade
The composite is a weighted blend of 9 inputs, each scored 0–100. Each bar is that input's sub-score; the figure is the points it added to the 100-point composite (weight × sub-score).
- Cash flow +18.6/30.0
- ARV discount +7.5/15.0
- DSCR +5.8/10.0
- 1% rule +5.0/10.0
- Livability +4.1/5.0
- Schools +3.4/10.0
- Condition / age +2.5/5.0
- Rent growth +1.8/5.0
- Appreciation +0.0/10.0
$174,999
🖨 Deal sheet 📄 Offer letter ✓ Due diligence
Listing remarks
Great investment opportunity with this duplex ideally located close to shopping, dining, and everyday conveniences. The property offers strong income potential and is well suited for investors or owner-occupants looking to offset living expenses. Easy commute to downtown with convenient access to major roads and local amenities. This price is for both units. To help visualize this homes floor plan and to highlight its potential virtual furnishings may have been added to photos found in this listing.
Key facts
- Parking
- Built 1985
- Listed 6 days
Property features AI
Finance
- Financial info: Pets not allowed
Exterior
- Parking: Driveway
- Utilities: Electricity available and connected; Public water; Public sewer (connected)
- Home design: Single-story building; Faces northwest; Resale condition; Two-unit multi-family property
- Construction: Built (year per public records); Brick and frame construction; Composition roof; Slab foundation
- Exterior features: Back yard fencing; No additional exterior features listed
Interior
- Kitchen: Electric oven
- Bedrooms: Primary bedroom; Two 2-bedroom units (Unit 1 and Unit 2)
- Flooring: Carpet
- Bathrooms: Each unit has 1 full bathroom
- Heating & cooling: Central heating; Central air conditioning
- Interior features: Ceiling fan(s); Carpet flooring
- Laundry & utility: Laundry closet
Neighborhood map
What this means for you Summary
Snapshot
- This is a 2-bed/3.0-bath townhouse listed at $175k.
Deal economics
- At list price, monthly cash flow is $170 ($2k/yr) — positive.
- The deal already cash-flows at list — no discount required.
- To meet the 1% rule (rent ≥ 1% of price), the offer needs to be $175k (0.2% below list).
- Recommended offer: $175k (0.2% below list) — sets the bar for 1% rule.
- Cap rate 7.5% vs local median 1.8% in Austin — top-decile yield for the area; either an underpriced asset or a hidden risk that comps aren't pricing in. Stress-test before assuming the spread holds.
Location & tenants
- Location reads 82/100 on livability (#16 in TX, #1,208 nationally) — a professional / high-income tenant draw. Strengths: amenities A+, commute A+, employment A+; Watch: cost of living D, crime F.
- Austin ISD (urban): math 33% / reading 44% proficiency, ranked #431 of 826 in TX (top 52%) — families likely to look elsewhere, expect single-tenant / working-renter base with shorter leases.
- Market conditions: Rents soft (-2.7%/yr); 268 active listings in the ZIP; 40 comparable units currently listed for rent nearby; rentals at typical pace (median 21d on market — plan ~3-4 weeks tenant-placement turnaround); high-income renter base; 17,121 units permitted in Travis County in 2024 (11,963 in 5+ unit buildings).
Forward outlook
- Local home prices are declining (-3.0%/yr); year-one equity from $1k of loan paydown is wiped out by about $5k of value loss. Plan a longer hold.
- Travis County population projected at +60% by 2050 — long-run rental-demand tailwind backs the buy-and-hold thesis.
Negotiation context
- Only 6 days on market — expect competitive offers; lowballing is unlikely to land.
- 3 sale attempts since 2y ago; this cycle's ask has dropped $175k (50%) from the opening price — seller is motivated, your offer sets the floor, not the list.
- Current owner paid $120k; 46% above their basis — modest negotiation headroom, anchor on the comps not their cost.
Risks & watch-outs
- Climate carrying-cost: severe wind risk, 80% chance of damaging wind over 30y; extreme-heat days projected 7→22/yr by 2055 (HVAC capex compounding) — expect insurance premiums to compound above CPI over the hold.
Questions for the listing agent
- Is there a deadline driving the sale (1031 exchange, divorce, estate, relocation)? That informs how much negotiation room exists.
- Crime grade is F in this area — have there been break-ins, vandalism, or insurance claims at this property in the last 3 years? What carrier currently insures it and at what premium?
- The area grade is low — what's the realistic commute time and amenity access for the typical tenant pool here? Any planned neighborhood developments (good or bad) we should know about?
- What's the average days-on-market for RENTAL listings here right now (not sales)? A rising rental-DOM trend means longer vacancies and softer asking-rent achievability than the comps imply.
- What's the recent tenant-quality profile in this submarket — average credit score on applications, eviction rate, late-payment / NSF rate, and stable-employment percentage? A property-management company in the area should have these aggregated.
- How much new for-sale + rental construction is in the pipeline within 1–3 miles? Heavy new supply typically softens prices + rents 12–24 months out; constrained supply supports both.
Investment metrics
- 1% rule
- 1.00% ✗
- Cap rate
- 7.46%
- Cash-on-cash
- 4.16%
- DSCR
- 1.18
- GRM
- 8.4
CMA / ARV
- ARV (on-the-fly)
- $394,706
- Comps found
- 2
Show comp detail 2 sales within ~0.75 mi
| Address | Dist | Beds/Ba | Sqft | Sold | Price | $/sf | Match |
|---|---|---|---|---|---|---|---|
| 8945 Parker Ranch Cir Unit A | 0.58mi | 3/2.5 (+1) | 1,741 (-2%) | 1mo | $339,000 | $195 | 61 |
| 8945 Parker Ranch Cir Unit B | 0.58mi | 3/2.5 (+1) | 1,741 (-2%) | 8mo | $385,000 | $221 | 55 |
Match score weights: distance 35% · size 25% · config 20% · recency 20%. Top-matched comps best support the ARV.
Projected returns pro-forma
-3.0% appreciation · 0.0% rent growth · sell at horizon
- IRR
- -13.2%
- Equity multiple
- 0.54×
- Total profit
- $-22,640
- Equity at exit
- $26,093
- IRR
- -9.8%
- Equity multiple
- 0.48×
- Total profit
- $-25,463
- Equity at exit
- $15,131
Cash invested: $49,000 (down + closing). Projections, not guarantees.
Landlord ↔ Tenant lean methodology
- Overall (STATE)
- 87 Strongly Landlord-Friendly
- State Texas
- 87 Strongly Landlord-Friendly · R+5
- County
- — inherits STATE
- City
- — inherits STATE
ZIP-level market 78748
- Rents YoY
- -2.7%
- Active inventory
- 268
- Price-to-rent
- 8.4×
Monthly cashflow live
- Estimated rent
- $1,746 high interval (Pro) →
- Mortgage (P&I)
- −$918
- Tax est. 1.5%
- −$219 /mo · $2,625/yr
- Insurance
- −$73
- HOA
- −$0
- Vacancy / Maint / Mgmt
- −$367
- Net cashflow
- $170
Break-even live
UW: 25.0% down · 7.5% · 30yr · 1.5% tax · 5.0% vac · 8.0% maint · 8.0% mgmt
Financing live
Cash to close
- Down payment
- $43,750
- Closing costs
- $5,250
- Reserves months
- —
- Total cash needed
- —
Loan-product check · same deal, 3 products live
Conventional
25% down · 7.5% · 30yr
- Down + closing
- —
- Monthly P&I
- —
- Monthly cashflow
- —
- DSCR
- —
- Eligible?
- —
Personal DTI + credit; lowest rate.
DSCR
20% down · 8.5% · 30yr
- Down + closing
- —
- Monthly P&I
- —
- Monthly cashflow
- —
- DSCR
- —
- Eligible?
- —
No personal income docs; deal must DSCR.
Hard money
10% down · 12.0% · 12mo
- Down + closing
- —
- Monthly P&I
- —
- Monthly cashflow
- —
- DSCR
- —
- Eligible?
- —
Short-term bridge; refi at stabilization.
Rent comps 40 comps
| Address | Beds | Baths | Sqft | Rent | $/sqft | DOM | Units | Dist |
|---|---|---|---|---|---|---|---|---|
| 9627 Sugar Hill Dr Unit B Austin, TX | 2.0 | 2.5 | 2618 | $1,595 | $0.61 | 24d | 1 | 0.02mi |
| 9620 Sugar Hill Dr Unit A Austin, TX | 2.0 | 1.0 | 1786 | $1,350 | $0.76 | 24d | 1 | 0.04mi |
| 9703 Nightjar Dr Unit A Austin, TX | 3.0 | 2.5 | 1309 | $1,750 | $1.34 | 11d | 1 | 0.05mi |
| 9603 Nightjar Dr Unit A Austin, TX | 2.0 | 1.5 | 1823 | $1,495 | $0.82 | 43d | 1 | 0.07mi |
| 2811 Crownspoint Dr Austin, TX | 3.0 | 2.0 | 1361 | $2,350 | $1.73 | 4d | 1 | 0.11mi |
| 2807 Firecrest Dr Austin, TX | 3.0 | 2.0 | 1301 | $2,000 | $1.54 | 24d | 1 | 0.22mi |
| 9805 Briar Ridge Dr Austin, TX | 3.0 | 2.0 | 1511 | $2,150 | $1.42 | 24d | 1 | 0.28mi |
| 2608 Piping Rock Trl Austin, TX | 3.0 | 2.0 | 1517 | $2,300 | $1.52 | 12d | 1 | 0.29mi |
| 9307 Marsh Dr Austin, TX | 3.0 | 2.0 | 1271 | $1,998 | $1.57 | 43d | 1 | 0.29mi |
| 2827 Wilcrest Dr Austin, TX | 3.0 | 2.0 | 1380 | $1,995 | $1.45 | 4d | 1 | 0.36mi |
| 9904 Briar Ridge Dr Austin, TX | 3.0 | 2.0 | 1660 | $2,395 | $1.44 | 15d | 1 | 0.42mi |
| 2511 Howellwood Way Unit A Austin, TX | 2.0 | 2.0 | 2088 | $1,650 | $0.79 | 43d | 1 | 0.45mi |
| 2612 Alcott Ln Austin, TX | 2.0 | 3.0 | 2280 | $1,600 | $0.70 | 43d | 1 | 0.54mi |
| 2630 Alcott Ln Austin, TX | 3.0 | 3.0 | 1400 | $1,820 | $1.30 | 43d | 1 | 0.56mi |
| 2405 Allred Dr Unit A Austin, TX | 2.0 | 2.5 | 1363 | $1,845 | $1.35 | 15d | 1 | 0.63mi |
| 9201 Brodie Ln Austin, TX | 2.0 | 2.0 | 1413 | $1,825 | $1.29 | 12d | 2 | 0.70mi |
| 9201 Brodie Ln Austin, TX | 2.0 | 2.0–2.5 | 1413 | $1,855 | $1.31 | 24d | 2 | 0.70mi |
| 9201 Brodie Ln Austin, TX | 2.0 | 1.5–2.0 | 1280 | $1,825 | $1.43 | 12d | 3 | 0.70mi |
| 8800 Peppergrass Cv Austin, TX | 3.0 | 2.5 | 1564 | $2,349 | $1.50 | 2d | 1 | 0.79mi |
| 8508 Apple Carrie Cv Unit B Austin, TX | 3.0 | 2.5 | 1275 | $1,750 | $1.37 | 24d | 1 | 0.82mi |
| 9111 Japonica Ct Unit A Austin, TX | 2.0 | 2.0 | 1812 | $1,395 | $0.77 | 43d | 1 | 0.91mi |
| 9111 Japonica Ct Austin, TX | 2.0 | 2.0 | 1812 | $1,495 | $0.83 | 43d | 1 | 0.91mi |
| 9323 Menchaca Rd Austin, TX | 1.0–4.0 | 1.0–2.0 | 1080 | $1,137 | $1.05 | 2d | 24 | 0.97mi |
| 2210 Lynnbrook Dr Austin, TX | 3.0 | 1.0–3.0 | 958 | $2,411 | $2.52 | 3d | 33 | 1.08mi |
| 8202 W Gate Blvd Unit A Austin, TX | 2.0 | 2.0 | 1820 | $1,495 | $0.82 | 20d | 1 | 1.09mi |
| 8202 W Gate Blvd Unit A Austin, TX | 2.0 | 2.0 | 1820 | $1,495 | $0.82 | 22d | 1 | 1.09mi |
| 8400 Seminary Ridge Dr Austin, TX | 3.0 | 2.0 | 1378 | $3,100 | $2.25 | 43d | 1 | 1.09mi |
| 8515 Brodie Ln Austin, TX | 1.0–2.0 | 1.0–2.0 | 980 | $1,841 | $1.88 | 2d | 28 | 1.09mi |
| 3109 Lynnbrook Dr Austin, TX | 3.0 | 2.0 | 1826 | $2,149 | $1.18 | 43d | 1 | 1.10mi |
| 1600 Sugarberry Ln Unit 54 Austin, TX | 3.0 | 2.5 | 1590 | $2,295 | $1.44 | 3d | 1 | 1.12mi |
| 8301 Winterstein Dr Austin, TX | 3.0 | 2.5 | 2163 | $2,750 | $1.27 | 16d | 1 | 1.12mi |
| 1700 Kemah Dr Austin, TX | 3.0 | 3.0 | 1714 | $2,300 | $1.34 | 43d | 1 | 1.15mi |
| 8010 Willet Trl Unit A Austin, TX | 3.0 | 2.5 | 1238 | $1,850 | $1.49 | 43d | 1 | 1.18mi |
| 8700 Brodie Ln Austin, TX | 1.0–3.0 | 1.0–2.0 | 1026 | $1,826 | $1.78 | 2d | 18 | 1.18mi |
| 8108 W Gate Blvd Unit -A Austin, TX | 2.0 | 1.0 | 1732 | $1,495 | $0.86 | 15d | 1 | 1.19mi |
| 3114 Plantation Rd Unit A Austin, TX | 2.0 | 2.0 | 1928 | $1,450 | $0.75 | 16d | 1 | 1.20mi |
| 8606 Brodie Ln Austin, TX | 3.0 | 2.0 | 1432 | $1,860 | $1.30 | 43d | 1 | 1.20mi |
| 10322 Maydelle Dr #127 Austin, TX | 3.0 | 2.5 | 1474 | $1,950 | $1.32 | 15d | 1 | 1.21mi |
| 9925 Wading Pool Path Austin, TX | 3.0 | 2.5 | 1944 | $2,249 | $1.16 | 16d | 1 | 1.22mi |
| 9925 Wading Pool Path Austin, TX | 3.0 | 2.5 | 1944 | $2,249 | $1.16 | 20d | 1 | 1.22mi |
Listing history 22 events
-
2026-06-18days on market $174,999 Active 6 DOM
-
2026-06-17days on market $174,999 Active 5 DOM
-
2026-06-16days on market $174,999 Active 4 DOM
-
2026-06-15days on market $174,999 Active 3 DOM
-
2026-06-13pricedays on market $174,999 Active 1 DOM
-
2026-06-09days on market $174,900 Active 91 DOM
-
2026-06-08days on market $174,900 Active 90 DOM
-
2026-06-07days on market $174,900 Active 89 DOM
-
2026-06-05pricedays on market $174,900 Active 86 DOM
-
2026-06-03days on market $334,900 Active 85 DOM
-
2026-06-02days on market $334,900 Active 84 DOM
-
2026-06-01days on market $334,900 Active 83 DOM
-
2026-05-31days on market $334,900 Active 82 DOM
-
2026-05-19status Active
-
2026-05-15status Pending
-
2026-04-27historical Active Under Contract
-
2026-04-17price $334,900
-
2026-03-06$349,900 Active
-
2024-09-03historical $1,550
-
2024-08-07$1,550
-
2021-10-11soldstatus
-
2004-10-04soldstatus $120,000
ⓘ Source: listings_history table (triggers on properties + properties_extension) + one-shot
backfill from property_details.listing_events for pre-trigger history.
Climate risk First Street
- Flood 1/10 Low FEMA zone X (unshaded) · 0% chance over 30 yrs
- Wildfire 4/10 Moderate
- Heat 8/10 Severe 7 d/yr ≥108°F today · 22 d/yr by 30 yrs out
- Wind 8/10 Severe 80% chance of damaging wind over 30 yrs
- Air quality 2/10 Low 1 unhealthy d/yr today · 1 by 30 yrs out
Nearby sold comps map
Loading sold comps map…
Walkable amenities ~0.75 mi
Loading nearby amenities…
Taxation est. · year 1
- Rental income
- $20,948
- − Mortgage interest
- −$9,803
- − Property taxes
- −$2,625
- − Insurance
- −$875
- − Repairs & maintenance
- −$1,676
- − Management
- −$1,676
- − Depreciation
- −$5,091
- Taxable loss
- −$797
- Est. tax savings @ 24.0%
- +$191
- After-tax cash flow
- $2,228/yr
For passive investors: Depreciation is non-cash, so a rental often shows a tax loss while cash-flowing — sheltering income. Rental losses are passive: they offset passive income freely, and up to $25,000/yr can offset ordinary (W-2) income if you actively participate and your MAGI is under $100k (phasing out to $0 by $150k); unused losses carry forward. On sale, claimed depreciation is recaptured at up to 25%, and gains may owe capital-gains tax (a 1031 exchange can defer both). Figures are a year-1 estimate at your 24.0% rate — not tax advice; consult a CPA.
Schools (NCES district)
- District
- Austin ISD
- NCES district ID
- 4808940
- Math proficiency
- 33% ▼ -19.00%
- Reading proficiency
- 44% ▼ -7.00%
- Median HH income
- $54,627
- Composite
- 33.65/100
- National rank
- #5397
- State rank
- #431 of 826 in TX
Livability — Austin
- Score
- 82/100
- State rank
- #16
- US rank
- #1208
Category grades
Schools grade is shown separately in the Schools card above.
Census & demographics
- Census place
- Austin, TX
- County
- Travis County · 1,299,254 people
- City population
- 1,066,854
- Metro
- Austin-Round Rock-Georgetown, TX
- Population (ZIP)
- 55,631
- Household income
- $115,213
- Rent vs Own
- Severe rent burden
- 2066.0
Population outlook (Travis County) Hauer SSP2
- Today (2025)
- 1,545,133 people
- By 2030
- 1,729,269 · +11.9%
- By 2040
- 2,097,596 · +35.8%
- By 2050
- 2,463,890 · +59.5%
- By 2075
- 3,249,374 · +110.3%
- By 2100
- 3,801,868 · +146.1%
Race, ethnicity, and origin ACS 2023
- Neighborhood character
- Diverse neighborhood (Simpson 0.63)
- Race & ethnicity
- White 49% Hispanic / Latino 35% Two or more races 17% Asian 5% Black 5%
- Hispanic origin (detail)
- Mexican 28%
- Common ancestry
- Lithuanian 2% Italian 2% Slovak 2%
- Foreign-born
- 10% · Canada, China, South Korea
- Languages at home
- 81% English-only · Spanish 15% Other Indo-European 1% Chinese 1%
Political lean MEDSL · Travis
- 2024 margin
- Solid D (+39.3) · D 68.8% · R 29.4% · Other 1.8%
- 2008→2024 swing
- +9.9pp toward D · 2008: 29.4pp · 2024: 39.3pp
- All cycles
- 2024: D+39.3 2020: D+45.0 2016: D+38.9 2012: D+23.9 2008: D+29.4
Not yet ingested
- Civics
- —
Market trends
- HPI YoY
- ▼ -427.12%
- Current HPI
- 234.9355
- Rent YoY
- ▼ -2.66%
- Metro
- Austin-Round Rock-Georgetown, TX
- State GDP YoY
- ▲ 3.95%
- F500 in state
- 110
Industry mix (Fortune 500 HQ in TX)
| Industry | F500 HQs | Revenue |
|---|---|---|
| Energy | 16 | $1,198B |
|
||
| Technology | 5 | $198B |
|
||
| Engineering / Construction | 4 | $72B |
|
||
| Energy Services | 3 | $60B |
|
||
| Utilities | 3 | $41B |
|
||
| Healthcare | 2 | $330B |
|
||
Price history
+179.1% since first listed9 events — show timeline
- 2026-05-19 Relisted — Unlock MLS
- 2026-05-15 Pending — Unlock MLS
- 2026-04-27 Contingent — Unlock MLS
- 2026-04-17 Price Changed $334,900 Unlock MLS
- 2026-03-06 Listed $349,900 Unlock MLS
- 2024-09-03 Rental Removed $1,550 ACTRIS
- 2024-08-07 Listed for Rent $1,550 ACTRIS
- 2021-10-11 Sold (Public Records) — Public Records
- 2004-10-04 Sold (Public Records) $120,000 Public Records
Property tax history
+6.0%/yrLatest (2022): $9,444 · +12.0% YoY. Source: county tax records.
Cash-flow waterfall
monthlySold comps — $/sqft
last 12 mo · ≤1 miLoading sold comps…