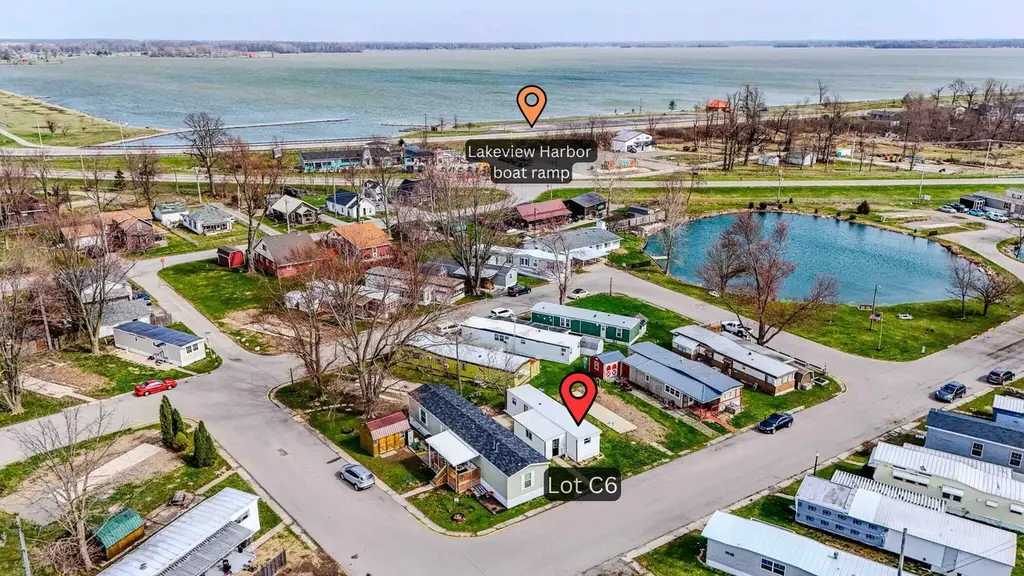
234 E Harrison St Unit C6 · Lakeview, OH
Flood risk 1/10 · Minimal
- FEMA flood zone
- X (shaded)
- Chance of flooding over 30 yrs
- 0.0%
- Est. flood insurance / yr
- $507 – $1,088
Fire risk 1/10 · Minimal
- Est. fire insurance / yr
- $713 – $1,323
Heat risk 3/10 · Minor
- Hot days now (above 99°F)
- 7 days/yr
- Hot days in 30 yrs
- 18 days/yr
Wind risk 2/10 · Minimal
- Chance of severe wind over 30 yrs
- —
Air-quality risk 2/10 · Minimal
- Unhealthy air days now
- 1 days/yr
- Unhealthy air days in 30 yrs
- 2 days/yr
Risk factors via First Street. Map © Google.
Why this score? — see what drove the B grade
The composite is a weighted blend of 9 inputs, each scored 0–100. Each bar is that input's sub-score; the figure is the points it added to the 100-point composite (weight × sub-score).
- Cash flow +30.0/30.0
- 1% rule +10.0/10.0
- DSCR +10.0/10.0
- ARV discount +8.4/15.0
- Schools +5.3/10.0
- Condition / age +4.0/5.0
- Livability +3.2/5.0
- Rent growth +2.5/5.0
- Appreciation +0.0/10.0
$39,900
🖨 Deal sheet (PDF) 📄 Offer letter ✓ Due diligence
Listing remarks MLS
Your Lake Life awaits in South Shore Estates! This 1965 New Moon Mobile home is conveniently located near: Lakeview Harbor/ Boat Ramp, The walking trail along the edge of the lake, La Playa - Mexican Restaurant, Holders Hideaway, Amvets, The Depot, and much more! Some features of this mobile home include: new vinyl siding, new skirting, new flooring, new windows in the mobile home, updated electric, open concept living with an addition, washer/dryer hookup, and rear concrete patio. This property would be ideal for full time living, as a weekend retreat, or a seasonal getaway. Indian Lake awaits - start your next adventure here!
Key facts
- Updated electric
- New flooring
- New skirting
Tags
Neighborhood map
What this means for you Summary
Snapshot
- This is a 2-bed/1.0-bath manufactured listed at $40k. Condition is rated good.
Deal economics
- At list price, monthly cash flow is $992 ($12k/yr) — positive.
- The deal already cash-flows at list — no discount required.
- Meets the 1% rule at list price ($2k rent vs $40k).
- Recommended offer: $36k (9.0% below list) — sets the bar for market timing.
- Cap rate 36.1% vs local median 5.8% in Lakeview — top-decile yield for the area; either an underpriced asset or a hidden risk that comps aren't pricing in. Stress-test before assuming the spread holds.
Location & tenants
- Location reads 63/100 on livability (#836 in OH) — a middle-class / working-renter tenant base. Strengths: crime A+, cost of living A+, housing A+; Watch: schools F, amenities F, commute F.
- Indian Lake Local (rural): math 59% / reading 66% proficiency, ranked #261 of 656 in OH (top 40%) — acceptable for families but not a draw, mixed tenant base, ~2y average lease.
- Market conditions: 109 active listings in the ZIP; 2 comparable units currently listed for rent nearby; 121 units permitted in Logan County in 2024 (0 in 5+ unit buildings).
- This rent runs 32% of the median local income ($60k/yr) — at the standard rent-burdened threshold; future hikes will face affordability resistance.
Forward outlook
- Local home prices are declining (-3.0%/yr); year-one equity from $276 of loan paydown is wiped out by about $1k of value loss. Plan a longer hold.
- Logan County population projected at -15% by 2050 — secular population decline; favor cash flow + early exit over multi-decade hold.
- At projected returns (-3.0% appreciation + 3.0% rent growth), your $11k cash investment doubles in ~2 years — after that, you're playing with house money.
Negotiation context
- It's been on market 95 days — a 9% lower offer ($36k) is reasonable based on typical stale-listing flexibility.
Questions for the listing agent
- It's been on market 95 days. Have you received any prior offers? Is the seller open to a 9% concession, seller financing, or rate buy-down credit?
- Built in 1965 — when were the roof, HVAC, electrical panel, plumbing, and water heater last replaced?
- Why hasn't it sold? Are there any deal-killer items the seller is aware of (foundation, flood, title, zoning, code violations)?
- Is there a deadline driving the sale (1031 exchange, divorce, estate, relocation)? That informs how much negotiation room exists.
- Schools are F-rated, which usually means shorter tenancies and higher turnover. Who's the typical renter profile here, and what's been the actual vacancy rate?
- What's the average days-on-market for RENTAL listings here right now (not sales)? A rising rental-DOM trend means longer vacancies and softer asking-rent achievability than the comps imply.
- What's the recent tenant-quality profile in this submarket — average credit score on applications, eviction rate, late-payment / NSF rate, and stable-employment percentage? A property-management company in the area should have these aggregated.
- How much new for-sale + rental construction is in the pipeline within 1–3 miles? Heavy new supply typically softens prices + rents 12–24 months out; constrained supply supports both.
Investment metrics
- 1% rule
- 4.02% ✓
- Cap rate
- 36.13%
- Cash-on-cash
- 106.57%
- DSCR
- 5.74
- GRM
- 2.1
CMA / ARV
- ARV (median comp)
- $40,681
- List price
- $39,900
- Delta
- -1.92%
- Verdict
- FAIR
- Comps
- 5 within 2.0 mi
Show comp detail 2 sales within ~0.75 mi
| Address | Dist | Beds/Ba | Sqft | Sold | Price | $/sf | Match |
|---|---|---|---|---|---|---|---|
| 234 E Harrison St Unit W-3 | 0.12mi | 1/1.0 (-1) | 636 (+6%) | 12mo | $49,500 | $78 | 70 |
| 290 Stephenson St Lot 12 | 0.49mi | 2/1.0 | 672 (+12%) | 20mo | $27,000 | $40 | 40 |
Match score weights: distance 35% · size 25% · config 20% · recency 20%. Top-matched comps best support the ARV.
Projected returns pro-forma
-3.0% appreciation · 3.0% rent growth · sell at horizon
- IRR
- —
- Equity multiple
- 6.08×
- Total profit
- $56,753
- Equity at exit
- $5,949
- IRR
- —
- Equity multiple
- 12.72×
- Total profit
- $130,891
- Equity at exit
- $3,450
Cash invested: $11,172 (down + closing). Projections, not guarantees.
Landlord ↔ Tenant lean methodology
- Overall (STATE)
- 73 Landlord-Friendly
- State Ohio
- 73 Landlord-Friendly · R+6
- County
- — inherits STATE
- City
- — inherits STATE
ZIP-level market 43331
- Home prices YoY
- -30.0%
- Active inventory
- 109
- Price-to-rent
- 2.1×
Monthly cashflow live
- Estimated rent
- $1,605 medium interval (Pro) →
- Mortgage (P&I)
- −$209
- Tax est. 1.5%
- −$50 /mo · $598/yr
- Insurance
- −$17
- HOA
- −$0
- Vacancy / Maint / Mgmt
- −$337
- Net cashflow
- $992
Break-even live
Sensitivity live
| Price | -10% $1,020 | -5% $1,006 | +0% $992 | +5% $978 | +10% $965 |
|---|---|---|---|---|---|
| Rent | -10% $865 | -5% $929 | +0% $992 | +5% $1,056 | +10% $1,119 |
| Rate | -1.0pp $1,012 | -0.5pp $1,002 | base $992 | +0.5pp $982 | +1.0pp $971 |
UW: 25.0% down · 7.5% · 30yr · 1.5% tax · 5.0% vac · 8.0% maint · 8.0% mgmt
Financing live
Cash to close
- Down payment
- $9,975
- Closing costs
- $1,197
- Reserves months
- —
- Total cash needed
- —
Loan-product check · same deal, 3 products live
Conventional
25% down · 7.5% · 30yr
- Down + closing
- —
- Monthly P&I
- —
- Monthly cashflow
- —
- DSCR
- —
- Eligible?
- —
Personal DTI + credit; lowest rate.
DSCR
20% down · 8.5% · 30yr
- Down + closing
- —
- Monthly P&I
- —
- Monthly cashflow
- —
- DSCR
- —
- Eligible?
- —
No personal income docs; deal must DSCR.
Hard money
10% down · 12.0% · 12mo
- Down + closing
- —
- Monthly P&I
- —
- Monthly cashflow
- —
- DSCR
- —
- Eligible?
- —
Short-term bridge; refi at stabilization.
Rent comps 2 comps
| Address | Beds | Baths | Sqft | Rent | $/sqft | DOM | Units | Dist |
|---|---|---|---|---|---|---|---|---|
| 8926 Franklin Ave Unit B Lakeview, OH | 2.0 | 1.0 | 696 | $1,605 | $2.31 | 2d | 1 | 0.53mi |
| 8926 Franklin Ave Lakeview, OH | 2.0 | 1.0 | 696 | $1,605 | $2.31 | 2d | 1 | 0.53mi |
Listing history 17 events
-
2026-06-21days on market $39,900 Active 95 DOM
-
2026-06-18days on market $39,900 Active 93 DOM
-
2026-06-17days on market $39,900 Active 92 DOM
-
2026-06-16days on market $39,900 Active 91 DOM
-
2026-06-15days on market $39,900 Active 90 DOM
-
2026-06-13days on market $39,900 Active 88 DOM
-
2026-06-12days on market $39,900 Active 87 DOM
-
2026-06-09days on market $39,900 Active 84 DOM
-
2026-06-08days on market $39,900 Active 83 DOM
-
2026-06-08days on market $39,900 Active 82 DOM
-
2026-06-07pricedays on market $39,900 Active 81 DOM
-
2026-06-04days on market $44,900 Active 78 DOM
-
2026-06-02days on market $44,900 Active 77 DOM
-
2026-06-01days on market $44,900 Active 76 DOM
-
2026-05-31days on market $44,900 Active 75 DOM
-
2026-05-06price $44,900 648-char remark
Show marketing remark (648 chars)
Your Lake Life awaits in South Shore Estates! This 1965 New Moon Mobile home is conveniently located near: Lakeview Harbor/ Boat Ramp, The walking trail along the edge of the lake, La Playa - Mexican Restaurant, Holders Hideaway, Amvets, The Depot, and much more! Some features of this mobile home include: new vinyl siding, new skirting, new flooring, new windows in the mobile home, updated electric, open concept living with an addition, washer/dryer hookup, and rear concrete patio. This property would be ideal for full time living, as a weekend retreat, or a seasonal getaway. Indian Lake awaits - start your next adventure here!
-
2026-03-17$49,900 Active 648-char remark
Show marketing remark (648 chars)
Your Lake Life awaits in South Shore Estates! This 1965 New Moon Mobile home is conveniently located near: Lakeview Harbor/ Boat Ramp, The walking trail along the edge of the lake, La Playa - Mexican Restaurant, Holders Hideaway, Amvets, The Depot, and much more! Some features of this mobile home include: new vinyl siding, new skirting, new flooring, new windows in the mobile home, updated electric, open concept living with an addition, washer/dryer hookup, and rear concrete patio. This property would be ideal for full time living, as a weekend retreat, or a seasonal getaway. Indian Lake awaits - start your next adventure here!
ⓘ Source: listings_history table (triggers on properties + properties_extension) + one-shot
backfill from property_details.listing_events for pre-trigger history.
Climate risk First Street
- Flood 1/10 Low FEMA zone X (shaded) · 0% chance over 30 yrs
- Wildfire 1/10 Low
- Heat 3/10 Moderate 7 d/yr ≥99°F today · 18 d/yr by 30 yrs out
- Wind 2/10 Low
- Air quality 2/10 Low 1 unhealthy d/yr today · 2 by 30 yrs out
Nearby sold comps map
Loading sold comps map…
Walkable amenities ~0.75 mi
Loading nearby amenities…
Taxation est. · year 1
- Rental income
- $19,260
- − Mortgage interest
- −$2,235
- − Property taxes
- −$598
- − Insurance
- −$200
- − Repairs & maintenance
- −$1,541
- − Management
- −$1,541
- − Depreciation
- −$1,161
- Taxable income
- $11,985
- Est. tax owed @ 24.0%
- −$2,876
- After-tax cash flow
- $9,030/yr
For passive investors: Depreciation is non-cash, so a rental often shows a tax loss while cash-flowing — sheltering income. Rental losses are passive: they offset passive income freely, and up to $25,000/yr can offset ordinary (W-2) income if you actively participate and your MAGI is under $100k (phasing out to $0 by $150k); unused losses carry forward. On sale, claimed depreciation is recaptured at up to 25%, and gains may owe capital-gains tax (a 1031 exchange can defer both). Figures are a year-1 estimate at your 24.0% rate — not tax advice; consult a CPA.
Condition & rehab AI · 12 photos
This 1965 New Moon mobile home in South Shore Estates is in good condition with recent updates, making it an ideal property for full-time living or seasonal use. The home is move-in ready with new flooring, siding, and windows, and is conveniently located near various amenities and a lakefront setting.
Value-add opportunities
- Both Paint interior walls and trim — Enhances curb appeal and interior aesthetics.
- Both Install new lighting fixtures — Improves functionality and enhances curb appeal.
- Both Add outdoor furniture to patio — Enhances outdoor living space and increases appeal for potential buyers/renters.
Renovation cost estimate screening
Value-add ROI direction
- Both Paint interior walls and trim — Enhances curb appeal and interior aesthetics. ↑
- Both Install new lighting fixtures — Improves functionality and enhances curb appeal. ↑
- Both Add outdoor furniture to patio — Enhances outdoor living space and increases appeal for potential buyers/renters. ↑
ⓘ Cost ranges are severity-bucket heuristics (US national rule-of-thumb). Get contractor quotes + a written scope before underwriting a rehab budget.
Schools (NCES district)
- District
- Indian Lake Local
- NCES district ID
- 3904808
- Math proficiency
- 59% ▼ -14.00%
- Reading proficiency
- 66% ▼ -4.00%
- Median HH income
- $44,496
- Composite
- 52.6/100
- National rank
- #1559
- State rank
- #261 of 656 in OH
Livability — Lakeview
- Score
- 63/100
- State rank
- #836
- US rank
- #15632
Category grades
Schools grade is shown separately in the Schools card above.
Census & demographics
- Census place
- Lakeview, OH
- County
- Logan · 47,256 people
- Population (ZIP)
- 4,012
- Household income
- $60,159
- Rent vs Own
- Severe rent burden
- 16.1
Population outlook (Logan County) Hauer SSP2
- Today (2025)
- 44,240 people
- By 2030
- 43,166 · -2.4%
- By 2040
- 40,495 · -8.5%
- By 2050
- 37,511 · -15.2%
- By 2075
- 30,453 · -31.2%
- By 2100
- 23,081 · -47.8%
Race, ethnicity, and origin ACS 2023
- Neighborhood character
- Predominantly White (94%)
- Race & ethnicity
- White 94% Hispanic / Latino 4% Two or more races 2% Black 1%
- Common ancestry
- Lithuanian 2% Slovak 2% Iranian 1%
- Foreign-born
- 2% · Canada
- Languages at home
- 96% English-only · Spanish 4%
Political lean MEDSL · Logan
- 2024 margin
- Solid R (+56.2) · D 21.5% · R 77.7%
- 2008→2024 swing
- -29.6pp toward R · 2008: -26.6pp · 2024: -56.2pp
- All cycles
- 2024: R+56.2 2020: R+55.2 2016: R+52.6 2012: R+31.8 2008: R+26.6
Not yet ingested
- Civics
- —
Market trends
- HPI YoY
- ▼ -109.75%
- Current HPI
- 256.2406
- Rent YoY
- —
- Metro
- —
- State GDP YoY
- ▲ 1.98%
- F500 in state
- 48
Industry mix (Fortune 500 HQ in OH)
| Industry | F500 HQs | Revenue |
|---|---|---|
| Insurance | 3 | $145B |
|
||
| Industrial Machinery | 3 | $49B |
|
||
| Financial Services | 3 | $24B |
|
||
| Consumer Goods | 2 | $93B |
|
||
| Aerospace / Defense | 2 | $47B |
|
||
| Utilities | 2 | $33B |
|
||
Price history
-10.0% since first listed2 events — show timeline
- 2026-05-06 Price Changed $44,900 WRIST
- 2026-03-17 Listed $49,900 WRIST
Cash-flow waterfall
monthlySold comps — $/sqft
last 12 mo · ≤1 miLoading sold comps…