 Duplex
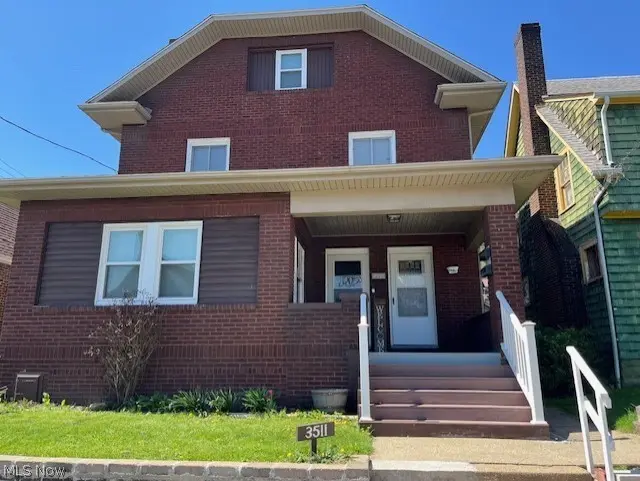
3511 Orchard St · Weirton, WV
Flood risk 1/10 · Minimal
- FEMA flood zone
- X (unshaded)
- Chance of flooding over 30 yrs
- 0.0%
- Est. flood insurance / yr
- $473 – $860
Fire risk 1/10 · Minimal
- Est. fire insurance / yr
- $787 – $1,461
Heat risk 4/10 · Minor
- Hot days now (above 97°F)
- 7 days/yr
- Hot days in 30 yrs
- 19 days/yr
Wind risk 1/10 · Minimal
- Chance of severe wind over 30 yrs
- —
Air-quality risk 2/10 · Minimal
- Unhealthy air days now
- 2 days/yr
- Unhealthy air days in 30 yrs
- 2 days/yr
Risk factors via First Street. Map © Google.
Why this score? — see what drove the B grade
The composite is a weighted blend of 9 inputs, each scored 0–100. Each bar is that input's sub-score; the figure is the points it added to the 100-point composite (weight × sub-score).
- Cash flow +30.0/30.0
- 1% rule +10.0/10.0
- DSCR +10.0/10.0
- ARV discount +8.6/15.0
- Condition / age +3.8/5.0
- Livability +3.5/5.0
- Schools +3.4/10.0
- Rent growth +2.5/5.0
- Appreciation +0.0/10.0
$109,900
🖨 Deal sheet (PDF) 📄 Offer letter ✓ Due diligence
Multi-family units
County records classify this as Multi-Family (2-4 Unit). Listing-text estimate: 2 units. confirmed
Listing remarks
Up/Down duplex offering an excellent investment opportunity with an extensive list of updates (available upon request). The owner-occupied main floor features 2 bedrooms, 1 full bath, a kitchen, and a spacious living/dining room combination, along with access to a full basement providing abundant storage and a laundry area. The second and third floors comprise the upper unit, offering 4 bedrooms, 2 full baths, a kitchen, living room, and a large entry foyer. Recent improvements include 28 new windows, hot water tanks (2018 & 2020), central A/C (2021), roof (2022), radon mitigation system (2019), updated electrical service with both units rewired (2019–2020), garage door (2021),
Key facts
- Large entry foyer
- Central a/c
- 28 new windows
Tags
Property features AI
Finance
- Other: Above-grade finished area reported as 2,620 (owner source)
- Financial info: Owner pays gas, water and trash collection; tenant pays electricity
Exterior
- Parking: Detached garage (2 spaces)
- Utilities: Public water; Public sewer
- Home design: Brick construction; 3 stories; Updated / remodeled condition
- Construction: Built (year source: Assessor); Asphalt/fiberglass roof
- Exterior features: Back yard; City lot; Flat, level lot; Garden
Interior
- Bedrooms: Total rooms: 10
- Bathrooms: 3 full bathrooms
- Heating & cooling: Gas forced air heating; Central air and window AC units
- Interior features: Ceiling fan(s); Common full walk-up basement
- Laundry & utility: Laundry located in basement
Neighborhood map
What this means for you Summary
Snapshot
- This is a 2 × 3-bed/1.5-bath units multifamily listed at $110k. Condition is rated good.
Deal economics
- At list price, monthly cash flow is $640 ($8k/yr) — positive. Per door: $320/mo.
- The deal already cash-flows at list — no discount required.
- Meets the 1% rule at list price ($2k rent vs $110k).
- Cap rate 13.3% vs local median 4.3% in Weirton — top-decile yield for the area; either an underpriced asset or a hidden risk that comps aren't pricing in. Stress-test before assuming the spread holds.
Location & tenants
- Location reads 69/100 on livability (#70 in WV) — a middle-class / working-renter tenant base. Strengths: crime A+, cost of living A+, housing A+; Watch: commute C-, schools D+, employment D.
- Hancock County Schools (urban): math 37% / reading 43% proficiency, ranked #7 of 55 in WV (top 13%) — families likely to look elsewhere, expect single-tenant / working-renter base with shorter leases.
- Market conditions: 79 active listings in the ZIP; 15 units permitted in Hancock County in 2024 (0 in 5+ unit buildings).
Forward outlook
- Local home prices are declining (-3.0%/yr); year-one equity from $760 of loan paydown is wiped out by about $3k of value loss. Plan a longer hold.
- Hancock County population projected at -15% by 2050 — secular population decline; favor cash flow + early exit over multi-decade hold.
- At projected returns (-3.0% appreciation + 3.0% rent growth), your $31k cash investment doubles in ~5 years — after that, you're playing with house money.
Negotiation context
- Only 4 days on market — expect competitive offers; lowballing is unlikely to land.
Risks & watch-outs
- Watch-outs: built in 1940 — expect roof / HVAC / electrical / plumbing capex.
Questions for the listing agent
- Can we see the unit-by-unit rent roll, current vacancy, and any below-market leases? What's the average tenancy length?
- What capital expenditures (roof, boiler, parking lot, exteriors) have been made in the last 5 years, and what's planned in the next 2?
- Built in 1940 — when were the roof, HVAC, electrical panel, plumbing, and water heater last replaced?
- Is there a deadline driving the sale (1031 exchange, divorce, estate, relocation)? That informs how much negotiation room exists.
- Schools are D-rated, which usually means shorter tenancies and higher turnover. Who's the typical renter profile here, and what's been the actual vacancy rate?
- What's the average days-on-market for RENTAL listings here right now (not sales)? A rising rental-DOM trend means longer vacancies and softer asking-rent achievability than the comps imply.
- What's the recent tenant-quality profile in this submarket — average credit score on applications, eviction rate, late-payment / NSF rate, and stable-employment percentage? A property-management company in the area should have these aggregated.
- How much new apartment / multifamily construction is in the pipeline within 1–3 miles? Heavy new supply (>2% of stock underway) typically softens rents 12–24 months out; light construction supports rent growth.
Investment metrics
- 1% rule
- 1.61% ✓
- Cap rate
- 13.29%
- Cash-on-cash
- 24.97%
- DSCR
- 2.11
- GRM
- 5.2
CMA / ARV
- ARV (on-the-fly)
- $112,660
- Comps found
- 2
Show comp detail 2 sales within ~0.75 mi
| Address | Dist | Beds/Ba | Sqft | Sold | Price | $/sf | Match |
|---|---|---|---|---|---|---|---|
| 3511 Orchard St | 0.00mi | 6/3.0 | 2,620 (0%) | 1mo | $111,700 | $43 | 99 |
| 3331-33 West St | 0.17mi | 6/2.0 | 2,968 (+13%) | 9mo | $23,000 | $8 | 58 |
Match score weights: distance 35% · size 25% · config 20% · recency 20%. Top-matched comps best support the ARV.
Projected returns pro-forma
-3.0% appreciation · 3.0% rent growth · sell at horizon
- IRR
- 18.4%
- Equity multiple
- 1.75×
- Total profit
- $23,005
- Equity at exit
- $16,386
- IRR
- 26.8%
- Equity multiple
- 3.36×
- Total profit
- $72,660
- Equity at exit
- $9,502
Cash invested: $30,772 (down + closing). Projections, not guarantees.
Landlord ↔ Tenant lean methodology
- Overall (STATE)
- 83 Strongly Landlord-Friendly
- State West Virginia
- 83 Strongly Landlord-Friendly · R+22
- County
- — inherits STATE
- City
- — inherits STATE
ZIP-level market 26062
- Home prices YoY
- -16.5%
- Active inventory
- 79
- Price-to-rent
- 10.3×
Monthly cashflow live
- Estimated rent
- $1,772 medium interval (Pro) →
- Mortgage (P&I)
- −$576
- Tax est. 1.5%
- −$137 /mo · $1,648/yr
- Insurance
- −$46
- HOA
- −$0
- Vacancy / Maint / Mgmt
- −$372
- Net cashflow
- $640
Break-even live
Sensitivity live
| Price | -10% $716 | -5% $678 | +0% $640 | +5% $602 | +10% $564 |
|---|---|---|---|---|---|
| Rent | -10% $500 | -5% $570 | +0% $640 | +5% $710 | +10% $780 |
| Rate | -1.0pp $696 | -0.5pp $668 | base $640 | +0.5pp $612 | +1.0pp $583 |
2-unit breakdown (identical units grouped — click to expand)
| Units | Beds | Baths | Est. rent |
|---|---|---|---|
| 2× units | 3 | 1.5 | $1,772 |
| #1 | 3 | 1.5 | $886 |
| #2 | 3 | 1.5 | $886 |
| Total (2 units) | $1,772 | ||
UW: 25.0% down · 7.5% · 30yr · 1.5% tax · 5.0% vac · 8.0% maint · 8.0% mgmt
Financing live
Cash to close
- Down payment
- $27,475
- Closing costs
- $3,297
- Reserves months
- —
- Total cash needed
- —
Loan-product check · same deal, 3 products live
Conventional
25% down · 7.5% · 30yr
- Down + closing
- —
- Monthly P&I
- —
- Monthly cashflow
- —
- DSCR
- —
- Eligible?
- —
Personal DTI + credit; lowest rate.
DSCR
20% down · 8.5% · 30yr
- Down + closing
- —
- Monthly P&I
- —
- Monthly cashflow
- —
- DSCR
- —
- Eligible?
- —
No personal income docs; deal must DSCR.
Hard money
10% down · 12.0% · 12mo
- Down + closing
- —
- Monthly P&I
- —
- Monthly cashflow
- —
- DSCR
- —
- Eligible?
- —
Short-term bridge; refi at stabilization.
Listing history 2 events
-
2026-04-13status Pending
-
2026-04-08$109,900 Active
ⓘ Source: listings_history table (triggers on properties + properties_extension) + one-shot
backfill from property_details.listing_events for pre-trigger history.
Climate risk First Street
- Flood 1/10 Low FEMA zone X (unshaded) · 0% chance over 30 yrs
- Wildfire 1/10 Low
- Heat 4/10 Moderate 7 d/yr ≥97°F today · 19 d/yr by 30 yrs out
- Wind 1/10 Low
- Air quality 2/10 Low 2 unhealthy d/yr today · 2 by 30 yrs out
Nearby sold comps map
Loading sold comps map…
Walkable amenities ~0.75 mi
Loading nearby amenities…
Taxation est. · year 1
- Rental income
- $21,264
- − Mortgage interest
- −$6,156
- − Property taxes
- −$1,648
- − Insurance
- −$550
- − Repairs & maintenance
- −$1,701
- − Management
- −$1,701
- − Depreciation
- −$3,197
- Taxable income
- $6,311
- Est. tax owed @ 24.0%
- −$1,515
- After-tax cash flow
- $6,170/yr
For passive investors: Depreciation is non-cash, so a rental often shows a tax loss while cash-flowing — sheltering income. Rental losses are passive: they offset passive income freely, and up to $25,000/yr can offset ordinary (W-2) income if you actively participate and your MAGI is under $100k (phasing out to $0 by $150k); unused losses carry forward. On sale, claimed depreciation is recaptured at up to 25%, and gains may owe capital-gains tax (a 1031 exchange can defer both). Figures are a year-1 estimate at your 24.0% rate — not tax advice; consult a CPA.
Condition & rehab AI · 13 photos
This multi-family home is in good condition with recent updates, including a new roof, windows, and HVAC system. It offers a good investment opportunity with potential for further cosmetic improvements to enhance its curb appeal and value.
Value-add opportunities
- Resale Paint exterior — Fresh paint can enhance curb appeal and property value.
- Resale Replace front porch railings — Worn railings can detract from the home's overall appearance and safety.
Renovation cost estimate screening
Value-add ROI direction
- Resale Paint exterior — Fresh paint can enhance curb appeal and property value. ↑
- Resale Replace front porch railings — Worn railings can detract from the home's overall appearance and safety. ↑
ⓘ Cost ranges are severity-bucket heuristics (US national rule-of-thumb). Get contractor quotes + a written scope before underwriting a rehab budget.
Schools (NCES district)
- District
- Hancock County Schools
- NCES district ID
- 5400450
- Math proficiency
- 37% ▼ -11.00%
- Reading proficiency
- 43% ▼ -5.00%
- Median HH income
- $39,803
- Composite
- 33.5/100
- National rank
- #5445
- State rank
- #7 of 55 in WV
Livability — Weirton
- Score
- 69/100
- State rank
- #70
- US rank
- #8638
Category grades
Schools grade is shown separately in the Schools card above.
Census & demographics
- Census place
- Weirton, WV
- City population
- 20,721
- Population (ZIP)
- 20,721
Population outlook (Hancock County) Hauer SSP2
- Today (2025)
- 28,704 people
- By 2030
- 27,913 · -2.8%
- By 2040
- 26,078 · -9.1%
- By 2050
- 24,521 · -14.6%
- By 2075
- 21,630 · -24.6%
- By 2100
- 17,867 · -37.8%
Race, ethnicity, and origin ACS 2023
- Neighborhood character
- Predominantly White (90%)
- Race & ethnicity
- White 90% Two or more races 4% Black 3% Hispanic / Latino 2%
- Common ancestry
- Romanian 7% Lithuanian 2% Serbian 2%
- Foreign-born
- 2% · Vietnam, Canada
- Languages at home
- 97% English-only · Other Indo-European 1% Spanish 1%
Political lean MEDSL · Hancock
- 2024 margin
- Solid R (+46.8) · D 25.8% · R 72.6% · Other 1.6%
- 2008→2024 swing
- -31.6pp toward R · 2008: -15.2pp · 2024: -46.8pp
- All cycles
- 2024: R+46.8 2020: R+43.6 2016: R+44.5 2012: R+21.6 2008: R+15.2
Not yet ingested
- Civics
- —
Market trends
- HPI YoY
- ▼ -41.66%
- Current HPI
- 210.5239
- Rent YoY
- —
- Metro
- —
- State GDP YoY
- —
- F500 in state
- 0
Price history
2 events — show timeline
- 2026-04-13 Pending — MLSNOW
- 2026-04-08 Listed $109,900 MLSNOW
Cash-flow waterfall
monthlySold comps — $/sqft
last 12 mo · ≤1 miLoading sold comps…