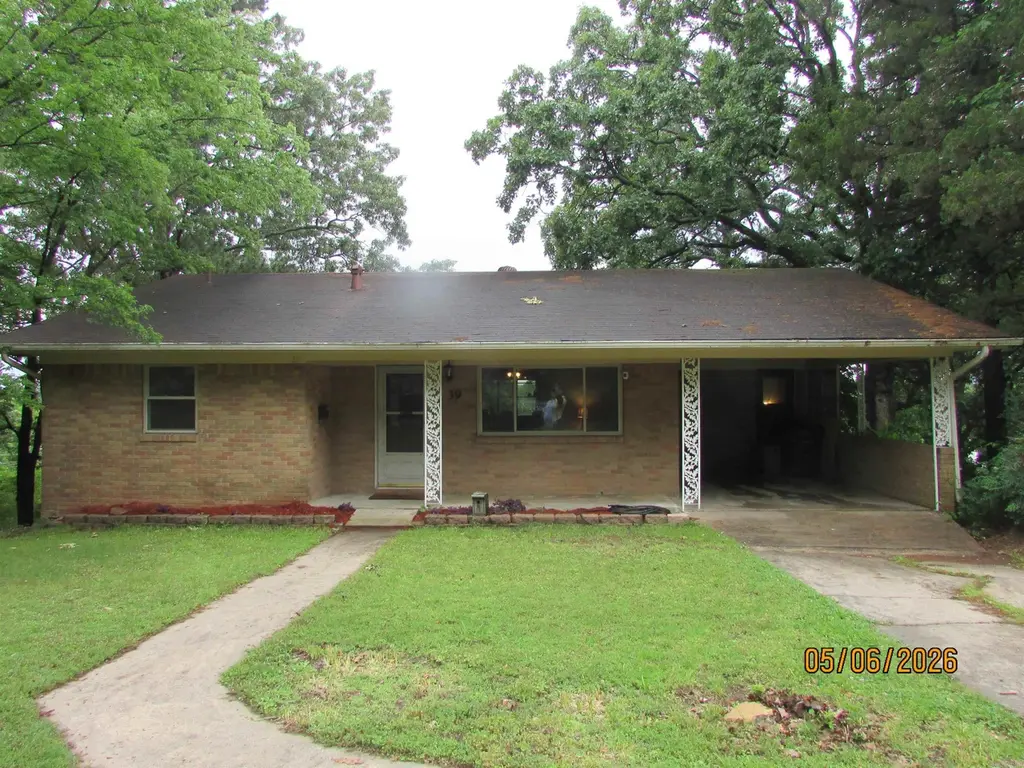
39 Cliffwood Cir · North Little Rock, AR
Flood risk 1/10 · Minimal
- FEMA flood zone
- X (unshaded)
- Chance of flooding over 30 yrs
- 0.0%
- Est. flood insurance / yr
- $507 – $1,088
Fire risk 3/10 · Minor
- Est. fire insurance / yr
- $1,499 – $2,785
Heat risk 7/10 · Major
- Hot days now (above 110°F)
- 7 days/yr
- Hot days in 30 yrs
- 19 days/yr
Wind risk 4/10 · Minor
- Chance of severe wind over 30 yrs
- 9.0%
Air-quality risk 2/10 · Minimal
- Unhealthy air days now
- 1 days/yr
- Unhealthy air days in 30 yrs
- 1 days/yr
Risk factors via First Street. Map © Google.
Why this score? — see what drove the C grade
The composite is a weighted blend of 9 inputs, each scored 0–100. Each bar is that input's sub-score; the figure is the points it added to the 100-point composite (weight × sub-score).
- Cash flow +24.8/30.0
- DSCR +8.1/10.0
- ARV discount +6.0/15.0
- 1% rule +5.9/10.0
- Rent growth +3.9/5.0
- Livability +3.7/5.0
- Condition / age +2.5/5.0
- Schools +2.0/10.0
- Appreciation +0.0/10.0
$174,900
🖨 Deal sheet (PDF) 📄 Offer letter ✓ Due diligence
Listing remarks
Home with a view with so much potential! Whether you're looking for an investment home or one you can customize to your taste. This one is it! Main floor features living room, kitchen, dining, 2 bedrooms, a full bath and a screened in porch for relaxing after a busy day. Full basement has a bedroom, bathroom, laundry room with lots of storage and a huge den/game room with a walk out covered patio. Nice size back yard. So many possibilities. Pool table to convey. Call today before it's too late.
Key facts
- Parking
- Built 1963
- Listed 45 days
Property features AI
Finance
- Financial info: Financing available: Cash, FHA, Conventional, VA
Exterior
- Parking: Carport for 1 car
- Utilities: Public sewer; Public water; Natural gas; Insulated doors and insulated windows
- Home design: Brick and frame combination exterior; Paved road access; Approximate living area reported from courthouse
- Construction: Composition roof; Slab/crawlspace combination foundation
- Exterior features: Patio; Screened porch; Partially fenced yard with chain link; Guttering; Sloped, wooded lot in a subdivision; Inside city limits
Interior
- Kitchen: Gas range; Wall oven; Disposal; Refrigerator stays
- Bedrooms: Includes bonus room and den/family room (additional living spaces); Basement provides finished, heated living area with outside walk-out access
- Flooring: Vinyl; Wood; Carpet
- Bathrooms: Two full bathrooms
- Heating & cooling: Central gas heat; Central electric cooling; Attic fan
- Interior features: Washer connection and gas dryer connection; Gas water heater; Paneling and sheetrock walls/ceilings
- Laundry & utility: Laundry area (washer/dryer connections); Basement utility access
Neighborhood map
What this means for you Summary
Snapshot
- This is a 3-bed/1.0-bath single-family listed at $175k.
Deal economics
- At list price, monthly cash flow is $372 ($4k/yr) — positive.
- The deal already cash-flows at list — no discount required.
- Meets the 1% rule at list price ($2k rent vs $175k).
- Recommended offer: $170k (3.0% below list) — sets the bar for market timing.
- Cap rate 8.8% vs local median 5.0% in North Little Rock — top-decile yield for the area; either an underpriced asset or a hidden risk that comps aren't pricing in. Stress-test before assuming the spread holds.
Location & tenants
- Location reads 73/100 on livability (#24 in AR) — a middle-class / working-renter tenant base. Strengths: commute A+, cost of living A+, housing A+; Watch: crime F, amenities F, employment D-.
- N. Little Rock School District (urban): math 21% / reading 26% proficiency, ranked #191 of 238 in AR (top 80%) — low school quality limits family demand, transient renter base, plan for 1-2y turnover; 66% free/reduced lunch — lower-income household profile, screen leases tightly.
- Zoned schools: Boone Park Elementary School (math 12% / reading 12%, grade F, #419 of 454 statewide, top 93%, 414 students, 100% FRL); Lakewood Middle School (math 23% / reading 32%, grade F, #155 of 201 statewide, top 77%, 1,115 students, 100% FRL); North Little Rock High School (math 12% / reading 26%, grade F, #248 of 292 statewide, top 86%, 1,949 students, 100% FRL) — zoned schools average 100% FRL vs 66% district-wide (33 pts higher); higher-poverty schools than district average — tighter screening recommended.
- Market conditions: Rents rising fast (+5.5%/yr); 106 active listings in the ZIP; 1 comparable units currently listed for rent nearby; 1,006 units permitted in Pulaski County in 2024 (0 in 5+ unit buildings).
- At $1,907/mo this rent would consume 46% of the median local household income ($50k/yr) (locally 1149% of renters already pay >50% of income on rent) — very limited rent-growth headroom before tenants either downsize or default.
Forward outlook
- Local home prices are declining (-3.0%/yr); year-one equity from $1k of loan paydown is wiped out by about $5k of value loss. Plan a longer hold.
- Pulaski County population projected at +6% by 2050 — modest demand growth; plan on rents tracking national, not racing it.
- At projected returns (-3.0% appreciation + 5.5% rent growth), your $49k cash investment doubles in ~9 years — after that, you're playing with house money.
Negotiation context
- It's been on market 46 days — a 3% lower offer ($170k) is reasonable based on typical stale-listing flexibility.
- Current owner paid $98k; list at $175k implies a 78% gain — meaningful room to come down on a strong offer.
Risks & watch-outs
- Climate carrying-cost: extreme-heat days projected 7→19/yr by 2055 (HVAC capex compounding) — expect insurance premiums to compound above CPI over the hold.
Questions for the listing agent
- It's been on market 46 days. Have you received any prior offers? Is the seller open to a 3% concession, seller financing, or rate buy-down credit?
- Built in 1963 — when were the roof, HVAC, electrical panel, plumbing, and water heater last replaced?
- Is there a deadline driving the sale (1031 exchange, divorce, estate, relocation)? That informs how much negotiation room exists.
- Schools are D-rated, which usually means shorter tenancies and higher turnover. Who's the typical renter profile here, and what's been the actual vacancy rate?
- Crime grade is F in this area — have there been break-ins, vandalism, or insurance claims at this property in the last 3 years? What carrier currently insures it and at what premium?
- What's the average days-on-market for RENTAL listings here right now (not sales)? A rising rental-DOM trend means longer vacancies and softer asking-rent achievability than the comps imply.
- What's the recent tenant-quality profile in this submarket — average credit score on applications, eviction rate, late-payment / NSF rate, and stable-employment percentage? A property-management company in the area should have these aggregated.
- How much new for-sale + rental construction is in the pipeline within 1–3 miles? Heavy new supply typically softens prices + rents 12–24 months out; constrained supply supports both.
Investment metrics
- 1% rule
- 1.09% ✓
- Cap rate
- 8.85%
- Cash-on-cash
- 9.12%
- DSCR
- 1.41
- GRM
- 7.6
CMA / ARV
- ARV (median comp)
- $169,302
- List price
- $174,900
- Delta
- 3.31%
- Verdict
- FAIR
- Comps
- 20 within 1.0 mi
Show comp detail 2 sales within ~0.75 mi
| Address | Dist | Beds/Ba | Sqft | Sold | Price | $/sf | Match |
|---|---|---|---|---|---|---|---|
| 800 Cherry Hl | 0.53mi | 3/2.5 | 3,031 (+0%) | 8mo | $450,000 | $148 | 63 |
| 1009 Cherry Hill Dr | 0.40mi | 4/3.0 (+1) | 2,676 (-12%) | 5mo | $350,000 | $131 | 44 |
Match score weights: distance 35% · size 25% · config 20% · recency 20%. Top-matched comps best support the ARV.
Projected returns pro-forma
-3.0% appreciation · 5.47% rent growth · sell at horizon
- IRR
- 0.1%
- Equity multiple
- 1.00×
- Total profit
- $207
- Equity at exit
- $26,078
- IRR
- 12.0%
- Equity multiple
- 2.05×
- Total profit
- $51,608
- Equity at exit
- $15,122
Cash invested: $48,972 (down + closing). Projections, not guarantees.
Landlord ↔ Tenant lean methodology
- Overall (STATE)
- 92 Strongly Landlord-Friendly
- State Arkansas
- 92 Strongly Landlord-Friendly · R+14
- County
- — inherits STATE
- City
- — inherits STATE
ZIP-level market 72118
- Home prices YoY
- -17.9%
- Rents YoY
- 5.5%
- Active inventory
- 106
- Price-to-rent
- 7.6×
Monthly cashflow live
- Estimated rent
- $1,907 medium interval (Pro) →
- Mortgage (P&I)
- −$917
- Tax from tax record
- −$145 /mo · $1,735/yr
- Insurance
- −$73
- HOA
- −$0
- Vacancy / Maint / Mgmt
- −$401
- Net cashflow
- $372
Break-even live
Sensitivity live
| Price | -10% $471 | -5% $422 | +0% $372 | +5% $323 | +10% $273 |
|---|---|---|---|---|---|
| Rent | -10% $222 | -5% $297 | +0% $372 | +5% $448 | +10% $523 |
| Rate | -1.0pp $460 | -0.5pp $417 | base $372 | +0.5pp $327 | +1.0pp $281 |
UW: 25.0% down · 7.5% · 30yr · 1.5% tax · 5.0% vac · 8.0% maint · 8.0% mgmt
Financing live
Cash to close
- Down payment
- $43,725
- Closing costs
- $5,247
- Reserves months
- —
- Total cash needed
- —
Loan-product check · same deal, 3 products live
Conventional
25% down · 7.5% · 30yr
- Down + closing
- —
- Monthly P&I
- —
- Monthly cashflow
- —
- DSCR
- —
- Eligible?
- —
Personal DTI + credit; lowest rate.
DSCR
20% down · 8.5% · 30yr
- Down + closing
- —
- Monthly P&I
- —
- Monthly cashflow
- —
- DSCR
- —
- Eligible?
- —
No personal income docs; deal must DSCR.
Hard money
10% down · 12.0% · 12mo
- Down + closing
- —
- Monthly P&I
- —
- Monthly cashflow
- —
- DSCR
- —
- Eligible?
- —
Short-term bridge; refi at stabilization.
Rent comps 1 comps
| Address | Beds | Baths | Sqft | Rent | $/sqft | DOM | Units | Dist |
|---|---|---|---|---|---|---|---|---|
| 524 W B Ave North Little Rock, AR | 3.0 | 2.5 | 2830 | $3,500 | $1.24 | 45d | 1 | 0.77mi |
Listing history 19 events
-
2026-06-21days on market $174,900 Active 46 DOM
-
2026-06-18days on market $174,900 Active 43 DOM
-
2026-06-17statusdays on market $174,900 Active 42 DOM
-
2026-06-16days on market $174,900 Price Change 41 DOM
-
2026-06-15days on market $174,900 Price Change 40 DOM
-
2026-06-14days on market $174,900 Price Change 38 DOM
-
2026-06-13pricestatusdays on market $174,900 Price Change 37 DOM
-
2026-06-10days on market $178,500 Active 35 DOM
-
2026-06-09days on market $178,500 Active 34 DOM
-
2026-06-08days on market $178,500 Active 33 DOM
-
2026-06-07days on market $178,500 Active 32 DOM
-
2026-06-05days on market $178,500 Active 29 DOM
-
2026-06-03days on market $178,500 Active 28 DOM
-
2026-06-02days on market $178,500 Active 27 DOM
-
2026-06-01days on market $178,500 Active 26 DOM
-
2026-05-31days on market $178,500 Active 25 DOM
-
2026-05-31days on market $178,500 Active 24 DOM
-
2026-05-07$178,500 New Listing 499-char remark
-
2003-11-19soldstatus $98,000
ⓘ Source: listings_history table (triggers on properties + properties_extension) + one-shot
backfill from property_details.listing_events for pre-trigger history.
Tax reassessment forecast AR · Resets to sale price
- Current annual tax
- $1,735 · $145/mo
- Projected year-2 tax
- $1,735 · $145/mo
- Expected delta
- $0/yr ($0/mo · 0.0%)
ⓘ Screening estimate from a state-policy table — verify with the county assessor before closing.
Climate risk First Street
- Flood 1/10 Low FEMA zone X (unshaded) · 0% chance over 30 yrs
- Wildfire 3/10 Moderate
- Heat 7/10 Severe 7 d/yr ≥110°F today · 19 d/yr by 30 yrs out
- Wind 4/10 Moderate 9% chance of damaging wind over 30 yrs
- Air quality 2/10 Low 1 unhealthy d/yr today · 1 by 30 yrs out
Nearby sold comps map
Loading sold comps map…
Walkable amenities ~0.75 mi
Loading nearby amenities…
Taxation est. · year 1
- Rental income
- $22,890
- − Mortgage interest
- −$9,797
- − Property taxes
- −$1,735
- − Insurance
- −$874
- − Repairs & maintenance
- −$1,831
- − Management
- −$1,831
- − Depreciation
- −$5,088
- Taxable income
- $1,733
- Est. tax owed @ 24.0%
- −$416
- After-tax cash flow
- $4,051/yr
For passive investors: Depreciation is non-cash, so a rental often shows a tax loss while cash-flowing — sheltering income. Rental losses are passive: they offset passive income freely, and up to $25,000/yr can offset ordinary (W-2) income if you actively participate and your MAGI is under $100k (phasing out to $0 by $150k); unused losses carry forward. On sale, claimed depreciation is recaptured at up to 25%, and gains may owe capital-gains tax (a 1031 exchange can defer both). Figures are a year-1 estimate at your 24.0% rate — not tax advice; consult a CPA.
Schools (NCES district)
- District
- N. Little Rock School District
- NCES district ID
- 0510680
- Math proficiency
- 21% ▼ -11.00%
- Reading proficiency
- 26% ▼ -9.00%
- Median HH income
- $38,325
- Composite
- 19.69/100
- National rank
- #8728
- State rank
- #191 of 238 in AR
Livability — North Little Rock
- Score
- 73/100
- State rank
- #24
- US rank
- #5452
Category grades
Schools grade is shown separately in the Schools card above.
Census & demographics
- Census place
- North Little Rock, AR
- County
- Pulaski County · 372,764 people
- City population
- 55,470
- Metro
- Little Rock-North Little Rock-Conway, AR
- Population (ZIP)
- 22,913
- Household income
- $49,559
- Rent vs Own
- Severe rent burden
- 1149.0
Population outlook (Pulaski County) Hauer SSP2
- Today (2025)
- 415,378 people
- By 2030
- 423,720 · +2.0%
- By 2040
- 435,182 · +4.8%
- By 2050
- 440,904 · +6.1%
- By 2075
- 445,521 · +7.3%
- By 2100
- 419,173 · +0.9%
Race, ethnicity, and origin ACS 2023
- Neighborhood character
- Diverse neighborhood (Simpson 0.64)
- Race & ethnicity
- Black 42% White 42% Hispanic / Latino 11% Two or more races 5%
- Hispanic origin (detail)
- Mexican 6%
- Common ancestry
- Lithuanian 2% Slovak 1% Italian 1%
- Foreign-born
- 7% · Canada
- Languages at home
- 89% English-only · Spanish 10%
Political lean MEDSL · Pulaski
- 2024 margin
- Strong D (+22.1) · D 59.8% · R 37.7% · Other 2.5%
- 2008→2024 swing
- +10.6pp toward D · 2008: 11.6pp · 2024: 22.1pp
- All cycles
- 2024: D+22.1 2020: D+22.5 2016: D+17.9 2012: D+11.4 2008: D+11.6
Not yet ingested
- Civics
- —
Market trends
- HPI YoY
- ▼ -39.32%
- Current HPI
- 180.6901
- Rent YoY
- ▲ 5.47%
- Metro
- Little Rock-North Little Rock-Conway, AR
- State GDP YoY
- ▲ 3.80%
- F500 in state
- 10
Industry mix (Fortune 500 HQ in AR)
| Industry | F500 HQs | Revenue |
|---|---|---|
| Retail | 1 | $681B |
|
||
| Food / Agriculture | 1 | $53B |
|
||
| Retail / Energy | 1 | $22B |
|
||
| Transportation / Logistics | 1 | $12B |
|
||
| Energy | 1 | $4B |
|
||
Price history
+78.5% since first listed3 events — show timeline
- 2026-06-11 Price Changed $174,900 CARMLS
- 2026-05-07 Listed $178,500 CARMLS
- 2003-11-19 Sold (Public Records) $98,000 Public Records
Property tax history
+3.1%/yrLatest (2025): $1,735 · +10.6% YoY. Source: county tax records.
Cash-flow waterfall
monthlySold comps — $/sqft
last 12 mo · ≤1 miLoading sold comps…