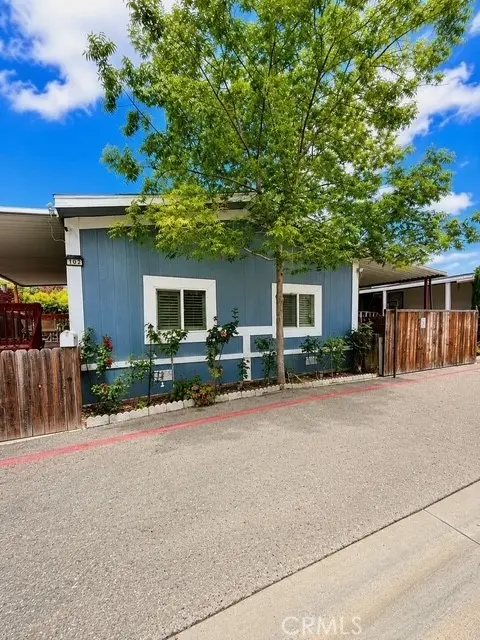
36200 Paradise Rnch #102 · Hasley Canyon, CA
Flood risk 9/10 · Severe
- FEMA flood zone
- D
- Chance of flooding over 30 yrs
- 0.99%
- Est. flood insurance / yr
- $544 – $1,084
Fire risk 10/10 · Severe
- Est. fire insurance / yr
- $659 – $1,223
Heat risk 5/10 · Moderate
- Hot days now (above 96°F)
- 8 days/yr
- Hot days in 30 yrs
- 22 days/yr
Wind risk 1/10 · Minimal
- Chance of severe wind over 30 yrs
- —
Air-quality risk 7/10 · Major
- Unhealthy air days now
- 15 days/yr
- Unhealthy air days in 30 yrs
- 18 days/yr
Risk factors via First Street. Map © Google.
Why this score? — see what drove the B grade
The composite is a weighted blend of 9 inputs, each scored 0–100. Each bar is that input's sub-score; the figure is the points it added to the 100-point composite (weight × sub-score).
- Cash flow +30.0/30.0
- 1% rule +10.0/10.0
- DSCR +10.0/10.0
- ARV discount +7.5/15.0
- Schools +5.9/10.0
- Condition / age +3.8/5.0
- Rent growth +2.5/5.0
- Livability +2.5/5.0
- Appreciation +0.0/10.0
$180,000
🖨 Deal sheet 📄 Offer letter ✓ Due diligence
Listing remarks
Welcome to easy living in the sought-after Paradise Ranch Estates community in Castaic! This inviting home offers a spacious floor plan filled with natural light and comfortable living areas perfect for everyday living and entertaining. Enjoy a well-sized kitchen with plenty of cabinet space, generous bedrooms, and a relaxing atmosphere throughout. Step outside to enjoy the outdoor space, ideal for morning coffee, gardening, or simply unwinding. Located in a friendly and well-kept community with convenient access to shopping, dining, schools, parks, and the freeway, this home combines comfort, convenience, and affordability. A wonderful opportunity to enjoy all that Castaic living has to of
Key facts
- Well-sized kitchen
- Outdoor space
- Community pool
Tags
Property features AI
Finance
- Other: Street lighting in the community; Access road frontage
- Financial info: Land lease amount approximately $1,029 per month
- HOA & community: Land lease community with monthly land lease
Exterior
- Parking: Located in Paradise Ranch park
- Utilities: Public sewer; District/public water
- Home design: Single-story home; Street-level entry; Entry on street
- Construction: Mobile home remains on site; Mobile home dimensions approximately 56 x 24; Year built source: Other
- Exterior features: Deck; Community pool; Close to clubhouse; No landscaping
Interior
- Kitchen: Garbage disposal; Built-in range
- Bedrooms: All bedrooms on one level
- Flooring: Laminate flooring
- Bathrooms: 2 full bathrooms; Bathtub
- Heating & cooling: Central heating (furnace); Central cooling
- Interior features: Open floor plan; Community spa
- Laundry & utility: Laundry inside in a dedicated room
Neighborhood map
What this means for you Summary
Snapshot
- This is a 2-bed/2.0-bath manufactured listed at $180k. Condition is rated good.
Deal economics
- At list price, monthly cash flow is $1k ($14k/yr) — positive.
- The deal already cash-flows at list — no discount required.
- Meets the 1% rule at list price ($3k rent vs $180k).
- Recommended offer: $177k (1.5% below list) — sets the bar for market timing.
Location & tenants
- Location reads 49/100 on livability (#1,168 in CA) — a working-class tenant base; expect higher turnover. Strengths: crime A+, employment A+; Watch: housing C-, schools F, amenities F.
- William S. Hart Union High (suburban): math 52% / reading 72% proficiency, ranked #155 of 1,400 in CA (top 11%) — acceptable for families but not a draw, mixed tenant base, ~2y average lease; only 18% free/reduced lunch — higher-income household profile.
- Market conditions: 140 active listings in the ZIP; 19,697 units permitted in Los Angeles County in 2024 (9,426 in 5+ unit buildings).
Forward outlook
- Local home prices are declining (-3.0%/yr); year-one equity from $1k of loan paydown is wiped out by about $5k of value loss. Plan a longer hold.
- Los Angeles County population projected at +9% by 2050 — modest demand growth; plan on rents tracking national, not racing it.
- At projected returns (-3.0% appreciation + 3.0% rent growth), your $50k cash investment doubles in ~5 years — after that, you're playing with house money.
Negotiation context
- It's been on market 17 days — a 2% lower offer ($177k) is reasonable based on typical stale-listing flexibility.
Risks & watch-outs
- Watch-outs: flood insurance adds $68/mo.
- Climate carrying-cost: severe flood risk; severe wildfire risk; extreme-heat days projected 8→22/yr by 2055 (HVAC capex compounding) — expect insurance premiums to compound above CPI over the hold.
Questions for the listing agent
- What's the actual annual flood-insurance premium (NFIP or private), and is the property in a SFHA with mandatory coverage?
- Is there a deadline driving the sale (1031 exchange, divorce, estate, relocation)? That informs how much negotiation room exists.
- Schools are F-rated, which usually means shorter tenancies and higher turnover. Who's the typical renter profile here, and what's been the actual vacancy rate?
- What's the average days-on-market for RENTAL listings here right now (not sales)? A rising rental-DOM trend means longer vacancies and softer asking-rent achievability than the comps imply.
- What's the recent tenant-quality profile in this submarket — average credit score on applications, eviction rate, late-payment / NSF rate, and stable-employment percentage? A property-management company in the area should have these aggregated.
- How much new for-sale + rental construction is in the pipeline within 1–3 miles? Heavy new supply typically softens prices + rents 12–24 months out; constrained supply supports both.
Investment metrics
- 1% rule
- 1.61% ✓
- Cap rate
- 14.43%
- Cash-on-cash
- 29.07%
- DSCR
- 2.29
- GRM
- 5.2
CMA / ARV
- ARV (on-the-fly)
- $92,736
- Comps found
- 3
Show comp detail 3 sales within ~0.75 mi
| Address | Dist | Beds/Ba | Sqft | Sold | Price | $/sf | Match |
|---|---|---|---|---|---|---|---|
| 36200 Paradise Ranch Rd #44 | 0.00mi | 3/2.0 (+1) | 1,440 (+7%) | 10mo | $100,000 | $69 | 75 |
| 36200 Paradise Ranch Rd #83 | 0.02mi | 3/2.0 (+1) | 1,440 (+7%) | 14mo | $100,000 | $69 | 71 |
| 36200 Paradise Ranch Rd #88 | 0.00mi | 3/2.0 (+1) | 1,536 (+14%) | 6mo | $135,000 | $88 | 66 |
Match score weights: distance 35% · size 25% · config 20% · recency 20%. Top-matched comps best support the ARV.
Projected returns pro-forma
-3.0% appreciation · 3.0% rent growth · sell at horizon
- IRR
- 21.5%
- Equity multiple
- 1.88×
- Total profit
- $44,261
- Equity at exit
- $26,839
- IRR
- 29.6%
- Equity multiple
- 3.64×
- Total profit
- $133,024
- Equity at exit
- $15,563
Cash invested: $50,400 (down + closing). Projections, not guarantees.
Landlord ↔ Tenant lean methodology
- Overall (STATE)
- 18 Strongly Tenant-Friendly
- State California
- 18 Strongly Tenant-Friendly · D+13
- County
- — inherits STATE
- City
- — inherits STATE
ZIP-level market 91384
- Home prices YoY
- -28.3%
- Active inventory
- 140
- Price-to-rent
- 5.2×
Monthly cashflow live
- Estimated rent
- $2,893 medium interval (Pro) →
- Mortgage (P&I)
- −$944
- Tax from tax record
- −$46 /mo · $548/yr
- Insurance
- −$75
- Flood insurance flood zone
- −$68 /mo · $814/yr
- HOA
- −$0
- Vacancy / Maint / Mgmt
- −$608
- Net cashflow
- $1,153
Break-even live
UW: 25.0% down · 7.5% · 30yr · 1.5% tax · 5.0% vac · 8.0% maint · 8.0% mgmt
Financing live
Cash to close
- Down payment
- $45,000
- Closing costs
- $5,400
- Reserves months
- —
- Total cash needed
- —
Loan-product check · same deal, 3 products live
Conventional
25% down · 7.5% · 30yr
- Down + closing
- —
- Monthly P&I
- —
- Monthly cashflow
- —
- DSCR
- —
- Eligible?
- —
Personal DTI + credit; lowest rate.
DSCR
20% down · 8.5% · 30yr
- Down + closing
- —
- Monthly P&I
- —
- Monthly cashflow
- —
- DSCR
- —
- Eligible?
- —
No personal income docs; deal must DSCR.
Hard money
10% down · 12.0% · 12mo
- Down + closing
- —
- Monthly P&I
- —
- Monthly cashflow
- —
- DSCR
- —
- Eligible?
- —
Short-term bridge; refi at stabilization.
Listing history 13 events
-
2026-06-18days on market $180,000 Active 17 DOM
-
2026-06-17days on market $180,000 Active 16 DOM
-
2026-06-16days on market $180,000 Active 15 DOM
-
2026-06-15days on market $180,000 Active 14 DOM
-
2026-06-13days on market $180,000 Active 12 DOM
-
2026-06-13days on market $180,000 Active 11 DOM
-
2026-06-09days on market $180,000 Active 8 DOM
-
2026-06-08days on market $180,000 Active 7 DOM
-
2026-06-07days on market $180,000 Active 6 DOM
-
2026-06-04days on market $180,000 Active 3 DOM
-
2026-06-03days on market $180,000 Active 2 DOM
-
2026-06-02remarks 699-char remark
-
2026-06-02$180,000 Active 1 DOM
ⓘ Source: listings_history table (triggers on properties + properties_extension) + one-shot
backfill from property_details.listing_events for pre-trigger history.
Tax reassessment forecast CA · Resets to sale price
- Current annual tax
- $548 · $46/mo
- Projected year-2 tax
- $1,368 · $114/mo
- Expected delta
- +$820/yr (+$68/mo · 149.8%)
ⓘ Screening estimate from a state-policy table — verify with the county assessor before closing.
Climate risk First Street
- Flood 9/10 Extreme FEMA zone D · 99% chance over 30 yrs
- Wildfire 10/10 Extreme
- Heat 5/10 Major 8 d/yr ≥96°F today · 22 d/yr by 30 yrs out
- Wind 1/10 Low
- Air quality 7/10 Severe 15 unhealthy d/yr today · 18 by 30 yrs out
Nearby sold comps map
Loading sold comps map…
Walkable amenities ~0.75 mi
Loading nearby amenities…
Taxation est. · year 1
- Rental income
- $34,719
- − Mortgage interest
- −$10,083
- − Property taxes
- −$548
- − Insurance
- −$1,714
- − Repairs & maintenance
- −$2,778
- − Management
- −$2,778
- − Depreciation
- −$5,236
- Taxable income
- $11,584
- Est. tax owed @ 24.0%
- −$2,780
- After-tax cash flow
- $11,059/yr
For passive investors: Depreciation is non-cash, so a rental often shows a tax loss while cash-flowing — sheltering income. Rental losses are passive: they offset passive income freely, and up to $25,000/yr can offset ordinary (W-2) income if you actively participate and your MAGI is under $100k (phasing out to $0 by $150k); unused losses carry forward. On sale, claimed depreciation is recaptured at up to 25%, and gains may owe capital-gains tax (a 1031 exchange can defer both). Figures are a year-1 estimate at your 24.0% rate — not tax advice; consult a CPA.
Condition & rehab AI · 12 photos
This home is in good condition with a good condition score of 75. It has a cosmetic rehab level and requires minor maintenance. The highest-ROI updates would be painting the exterior walls and replacing countertops.
Value-add opportunities
- Resale Paint exterior walls — Enhances curb appeal and can increase property value
- Both Replace countertops — Modernizes kitchen and improves functionality
- Both Install smart home devices — Enhances convenience and can increase property value
Renovation cost estimate screening
Value-add ROI direction
- Resale Paint exterior walls — Enhances curb appeal and can increase property value ↑
- Both Replace countertops — Modernizes kitchen and improves functionality ↑
- Both Install smart home devices — Enhances convenience and can increase property value ↑
ⓘ Cost ranges are severity-bucket heuristics (US national rule-of-thumb). Get contractor quotes + a written scope before underwriting a rehab budget.
Schools (NCES district)
- District
- William S. Hart Union High
- NCES district ID
- 0642510
- Math proficiency
- 52% ▬ 0.00%
- Reading proficiency
- 72% ▲ 1.00%
- Median HH income
- $95,844
- Composite
- 58.6/100
- National rank
- #2030
- State rank
- #155 of 1400 in CA
Livability — Hasley Canyon
- Score
- 49/100
- State rank
- #1168
- US rank
- #25897
Category grades
Schools grade is shown separately in the Schools card above.
Census & demographics
- Population (ZIP)
- 27,278
Population outlook (Los Angeles County) Hauer SSP2
- Today (2025)
- 10,940,515 people
- By 2030
- 11,256,481 · +2.9%
- By 2040
- 11,729,929 · +7.2%
- By 2050
- 11,948,407 · +9.2%
- By 2075
- 11,818,114 · +8.0%
- By 2100
- 10,842,928 · -0.9%
Race, ethnicity, and origin ACS 2023
- Neighborhood character
- Diverse neighborhood (Simpson 0.67)
- Race & ethnicity
- Hispanic / Latino 43% White 37% Two or more races 22% Asian 9% Black 5% Native American 1%
- Hispanic origin (detail)
- Mexican 31%
- Common ancestry
- Italian 3% Lithuanian 2% Portuguese 2%
- Foreign-born
- 20% · Canada, South Korea, China
- Languages at home
- 62% English-only · Spanish 29% Other Indo-European 2% Tagalog/Filipino 2%
Political lean MEDSL · Los Angeles
- 2024 margin
- Solid D (+32.9) · D 64.8% · R 31.9% · Other 3.3%
- 2008→2024 swing
- -7.4pp toward R · 2008: 40.4pp · 2024: 32.9pp
- All cycles
- 2024: D+32.9 2020: D+44.2 2016: D+48.0 2012: D+40.0 2008: D+40.4
Not yet ingested
- Civics
- —
Market trends
- HPI YoY
- ▼ -126.54%
- Current HPI
- 319.9021
- Rent YoY
- —
- Metro
- —
- State GDP YoY
- ▲ 3.21%
- F500 in state
- 116
Industry mix (Fortune 500 HQ in CA)
| Industry | F500 HQs | Revenue |
|---|---|---|
| Technology | 27 | $1,492B |
|
||
| Financial Services | 3 | $174B |
|
||
| Retail | 3 | $44B |
|
||
| Insurance | 3 | $26B |
|
||
| Media / Entertainment | 2 | $115B |
|
||
| Pharmaceuticals / Biotech | 2 | $62B |
|
||
Price history
1 event — show timeline
- 2026-06-01 Listed $180,000 CRMLS
Property tax history
+4.6%/yrLatest (2025): $548 · +4.6% YoY. Source: county tax records.
Cash-flow waterfall
monthlySold comps — $/sqft
last 12 mo · ≤1 miLoading sold comps…