121 Golden Isles Dr #904 · Hallandale Beach, FL
Flood risk No data
- FEMA flood zone
- —
- Chance of flooding over 30 yrs
- —
- Est. flood insurance / yr
- —
Fire risk No data
- Est. fire insurance / yr
- —
Heat risk No data
- Hot days now (above threshold)
- —
- Hot days in 30 yrs
- —
Wind risk No data
- Chance of severe wind over 30 yrs
- —
Air-quality risk No data
- Unhealthy air days now
- —
- Unhealthy air days in 30 yrs
- —
Risk factors via First Street. Map © Google.
Why this score? — see what drove the C- grade
The composite is a weighted blend of 9 inputs, each scored 0–100. Each bar is that input's sub-score; the figure is the points it added to the 100-point composite (weight × sub-score).
- Cash flow +17.2/30.0
- ARV discount +7.5/15.0
- 1% rule +7.4/10.0
- DSCR +5.3/10.0
- Schools +4.1/10.0
- Livability +4.0/5.0
- Rent growth +2.6/5.0
- Condition / age +2.5/5.0
- Appreciation +0.0/10.0
$237,000
🖨 Deal sheet 📄 Offer letter ✓ Due diligence
Listing remarks
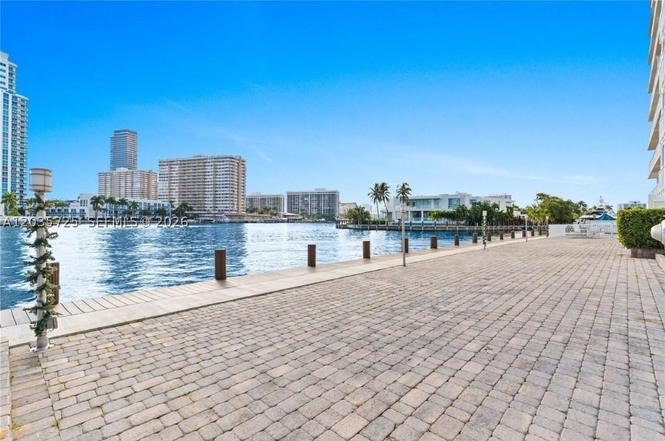
Bright, sun-filled 9th-floor residence with serene Intracoastal views and endless potential. This spacious 1-bedroom, 1.5-bath unit offers a rare opportunity to create your ideal waterfront retreat. Filled with natural light, the open layout provides a true blank canvas—perfect for a modern renovation or a warm coastal escape tailored to your style. Enjoy peace of mind with full hurricane impact windows and doors, while watching the daily boat parade from your living room. Located in a well-maintained waterfront building with low monthly fees, this unit delivers exceptional value in one of South Florida’s most convenient locations. Just minutes to the beach, Gulfstream Park, Ave
Key facts
- Intracoastal views
- Waterfront building
- Quiet scenic setting
Tags
Property features AI
Finance
- Financial info: Pets not allowed
- HOA & community: Monthly association fee of $526; Association covers management, insurance, laundry, and grounds maintenance; Fitness center in the community
Exterior
- Parking: Assigned attached garage
- Security: Elevator secured; Key card entry; Phone entry
- Utilities: Central heating and cooling
- Home design: High-rise building (15 stories); Property is attached; Entry located on level 9; Effective year built
- Construction: Block construction
- Exterior features: Deck; Barbecue; Security/High impact doors; Bay front, intracoastal access and oceanfront waterfront location; Has a view
Interior
- Bedrooms: Bedroom located on the main level
- Flooring: Tile
- Bathrooms: 1 full bathroom; 1 half bathroom
- Heating & cooling: Central heating; Central air conditioning
- Interior features: Bedroom on main level; Elevator; Tile flooring
- Laundry & utility: Laundry service included in association
Neighborhood map
What this means for you Summary
Snapshot
- This is a 1-bed/2.0-bath condo listed at $237k.
Deal economics
- At list price, monthly cash flow is $168 ($2k/yr) — positive.
- The deal already cash-flows at list — no discount required.
- Meets the 1% rule at list price ($3k rent vs $237k).
- Cap rate 7.1% vs local median 5.2% in Hallandale Beach — top-decile yield for the area; either an underpriced asset or a hidden risk that comps aren't pricing in. Stress-test before assuming the spread holds.
Location & tenants
- Location reads 81/100 on livability (#86 in FL, #1,400 nationally) — a professional / high-income tenant draw. Strengths: commute A+, health & safety A+, crime B+; Watch: schools C-, employment D-.
- Broward (suburban): math 42% / reading 53% proficiency, ranked #46 of 73 in FL (top 63%) — families likely to look elsewhere, expect single-tenant / working-renter base with shorter leases.
- Market conditions: Rents flat; 1373 active listings in the ZIP; 8 comparable units currently listed for rent nearby; rentals leasing fast (median 11d on market — plan ~1-2 weeks tenant-placement turnaround); 2,111 units permitted in Broward County in 2024 (1,265 in 5+ unit buildings).
- At $2,929/mo this rent would consume 67% of the median local household income ($52k/yr) (locally 3293% of renters already pay >50% of income on rent) — very limited rent-growth headroom before tenants either downsize or default.
Forward outlook
- Local home prices are declining (-3.0%/yr); year-one equity from $2k of loan paydown is wiped out by about $7k of value loss. Plan a longer hold.
- Broward County population projected at +34% by 2050 — long-run rental-demand tailwind backs the buy-and-hold thesis.
Negotiation context
- Only 7 days on market — expect competitive offers; lowballing is unlikely to land.
- 3 sale attempts since 13y ago with the ask held roughly flat each time — persistent listings suggest the price (not the market) is what's stuck; bring a comps-based counter.
- Current owner paid $57k; list at $237k implies a 316% gain — meaningful room to come down on a strong offer.
Questions for the listing agent
- Built in 1970 — when were the roof, HVAC, electrical panel, plumbing, and water heater last replaced?
- What does the HOA fee cover, when was the last increase, and are there any pending special assessments or reserve-fund shortfalls?
- Any open or pending special assessments — roof, HVAC, plumbing, elevator, façade? What's the per-unit balance and payoff schedule, and is the seller paying it off at close or rolling it to the buyer?
- Is there a deadline driving the sale (1031 exchange, divorce, estate, relocation)? That informs how much negotiation room exists.
- What's the average days-on-market for RENTAL listings here right now (not sales)? A rising rental-DOM trend means longer vacancies and softer asking-rent achievability than the comps imply.
- What's the recent tenant-quality profile in this submarket — average credit score on applications, eviction rate, late-payment / NSF rate, and stable-employment percentage? A property-management company in the area should have these aggregated.
- How much new apartment / multifamily construction is in the pipeline within 1–3 miles? Heavy new supply (>2% of stock underway) typically softens rents 12–24 months out; light construction supports rent growth.
Investment metrics
- 1% rule
- 1.24% ✓
- Cap rate
- 7.14%
- Cash-on-cash
- 3.03%
- DSCR
- 1.13
- GRM
- 6.7
CMA / ARV
No comps found within radius.
Projected returns pro-forma
-3.0% appreciation · 0.43% rent growth · sell at horizon
- IRR
- -15.1%
- Equity multiple
- 0.48×
- Total profit
- $-34,746
- Equity at exit
- $35,337
- IRR
- -13.3%
- Equity multiple
- 0.34×
- Total profit
- $-43,828
- Equity at exit
- $20,491
Cash invested: $66,360 (down + closing). Projections, not guarantees.
Landlord ↔ Tenant lean methodology
- Overall (STATE)
- 87 Strongly Landlord-Friendly
- State Florida
- 87 Strongly Landlord-Friendly · R+3
- County
- — inherits STATE
- City
- — inherits STATE
ZIP-level market 33009
- Rents YoY
- 0.4%
- Active inventory
- 1373
- Price-to-rent
- 6.7×
Monthly cashflow live
- Estimated rent
- $2,929 high interval (Pro) →
- Mortgage (P&I)
- −$1,243
- Tax from tax record
- −$278 /mo · $3,339/yr
- Insurance
- −$99
- HOA
- −$526
- Vacancy / Maint / Mgmt
- −$615
- Net cashflow
- $168
Break-even live
UW: 25.0% down · 7.5% · 30yr · 1.5% tax · 5.0% vac · 8.0% maint · 8.0% mgmt
Financing live
Cash to close
- Down payment
- $59,250
- Closing costs
- $7,110
- Reserves months
- —
- Total cash needed
- —
Loan-product check · same deal, 3 products live
Conventional
25% down · 7.5% · 30yr
- Down + closing
- —
- Monthly P&I
- —
- Monthly cashflow
- —
- DSCR
- —
- Eligible?
- —
Personal DTI + credit; lowest rate.
DSCR
20% down · 8.5% · 30yr
- Down + closing
- —
- Monthly P&I
- —
- Monthly cashflow
- —
- DSCR
- —
- Eligible?
- —
No personal income docs; deal must DSCR.
Hard money
10% down · 12.0% · 12mo
- Down + closing
- —
- Monthly P&I
- —
- Monthly cashflow
- —
- DSCR
- —
- Eligible?
- —
Short-term bridge; refi at stabilization.
Rent comps 8 comps
| Address | Beds | Baths | Sqft | Rent | $/sqft | DOM | Units | Dist |
|---|---|---|---|---|---|---|---|---|
| 2602 E Hallandale Beach Blvd Hallandale Beach, FL | 3.0 | 1.0–3.0 | 1011 | $3,862 | $3.82 | 2d | 5 | 0.27mi |
| 2601 E Hallandale Beach Blvd Unit 1227344P Hallandale Beach, FL | 1.0–2.0 | 1.0–2.0 | 844 | $2,465 | $2.92 | 2d | 2 | 0.28mi |
| 1180 E Hallandale Beach Blvd Unit 1241877P Hallandale Beach, FL | 1.0–2.0 | 1.0–2.0 | 844 | $2,465 | $2.92 | 3d | 2 | 0.85mi |
| 2501 S Ocean Dr Hollywood, FL | 1.0–2.0 | 1.0–2.0 | 971 | $4,200 | $4.32 | 14d | 7 | 1.10mi |
| 2501 S Ocean Dr Hollywood, FL | 1.0–2.0 | 1.0–2.0 | 971 | $4,400 | $4.53 | 10d | 6 | 1.10mi |
| 2501 S Ocean Dr Hollywood, FL | 1.0–2.0 | 1.0–2.0 | 971 | $4,000 | $4.12 | 7d | 7 | 1.10mi |
| 2501 S Ocean Dr Hollywood, FL | 1.0–2.0 | 1.0–2.0 | 971 | $3,800 | $3.91 | 19d | 8 | 1.10mi |
| 401 N Federal Hwy Hallandale Beach, FL | 1.0–3.0 | 1.0–2.0 | 973 | $1,892 | $1.94 | 15d | 48 | 1.38mi |
HOA detail condo
- Monthly dues
- $526 · $6,312/yr
- Likely covers
- water
- Assessments
- None detected in remarks — confirm with the listing agent.
Listing history 6 events
-
2026-06-18days on market $237,000 Active 7 DOM
-
2026-06-17days on market $237,000 Active 6 DOM
-
2026-06-16days on market $237,000 Active 5 DOM
-
2026-06-15days on market $237,000 Active 4 DOM
-
2026-06-13remarks 687-char remark
-
2026-06-13$237,000 Active 2 DOM
ⓘ Source: listings_history table (triggers on properties + properties_extension) + one-shot
backfill from property_details.listing_events for pre-trigger history.
Tax reassessment forecast FL · Resets to sale price
- Current annual tax
- $3,339 · $278/mo
- Projected year-2 tax
- $3,339 · $278/mo
- Expected delta
- $0/yr ($0/mo · 0.0%)
ⓘ Screening estimate from a state-policy table — verify with the county assessor before closing.
Nearby sold comps map
Loading sold comps map…
Walkable amenities ~0.75 mi
Loading nearby amenities…
Taxation est. · year 1
- Rental income
- $35,143
- − Mortgage interest
- −$13,276
- − Property taxes
- −$3,339
- − Insurance
- −$1,185
- − Repairs & maintenance
- −$2,811
- − Management
- −$2,811
- − HOA
- −$6,312
- − Depreciation
- −$6,895
- Taxable loss
- −$1,486
- Est. tax savings @ 24.0%
- +$357
- After-tax cash flow
- $2,370/yr
For passive investors: Depreciation is non-cash, so a rental often shows a tax loss while cash-flowing — sheltering income. Rental losses are passive: they offset passive income freely, and up to $25,000/yr can offset ordinary (W-2) income if you actively participate and your MAGI is under $100k (phasing out to $0 by $150k); unused losses carry forward. On sale, claimed depreciation is recaptured at up to 25%, and gains may owe capital-gains tax (a 1031 exchange can defer both). Figures are a year-1 estimate at your 24.0% rate — not tax advice; consult a CPA.
Schools (NCES district)
- District
- Broward
- NCES district ID
- 1200180
- Math proficiency
- 42% ▼ -18.00%
- Reading proficiency
- 53% ▼ -5.00%
- Median HH income
- $52,139
- Composite
- 40.88/100
- National rank
- #3621
- State rank
- #46 of 73 in FL
Livability — Hallandale Beach
- Score
- 81/100
- State rank
- #86
- US rank
- #1400
Category grades
Schools grade is shown separately in the Schools card above.
Census & demographics
- Census place
- Hallandale Beach, FL
- County
- Broward County · 1,963,430 people
- City population
- 44,021
- Metro
- Miami-Fort Lauderdale-Pompano Beach, FL
- Population (ZIP)
- 44,502
- Household income
- $52,079
- Rent vs Own
- Severe rent burden
- 3293.0
Population outlook (Broward County) Hauer SSP2
- Today (2025)
- 2,207,033 people
- By 2030
- 2,360,704 · +7.0%
- By 2040
- 2,661,208 · +20.6%
- By 2050
- 2,946,698 · +33.5%
- By 2075
- 3,602,273 · +63.2%
- By 2100
- 3,970,984 · +79.9%
Race, ethnicity, and origin ACS 2023
- Neighborhood character
- Diverse neighborhood (Simpson 0.67)
- Race & ethnicity
- Hispanic / Latino 39% White 39% Two or more races 24% Black 17% Asian 1%
- Hispanic origin (detail)
- Mexican 2% Puerto Rican 3% Cuban 9% Dominican 3% Salvadoran 2%
- Common ancestry
- Scotch-Irish 5% Hispanic 5% Subsaharan African 3%
- Foreign-born
- 51% · Canada, Jamaica, Dominican Republic
- Languages at home
- 38% English-only · Spanish 36% Russian/Polish/Slavic 12% French/Haitian/Cajun 7%
Political lean MEDSL · Broward
- 2024 margin
- D (+17.0) · D 58.0% · R 41.0%
- 2008→2024 swing
- -17.8pp toward R · 2008: 34.7pp · 2024: 17.0pp
- All cycles
- 2024: D+17.0 2020: D+29.8 2016: D+35.0 2012: D+34.9 2008: D+34.7
Not yet ingested
- Civics
- —
Market trends
- HPI YoY
- ▼ -299.13%
- Current HPI
- 329.9081
- Rent YoY
- ▲ 0.43%
- Metro
- Miami-Fort Lauderdale-Pompano Beach, FL
- State GDP YoY
- ▲ 3.28%
- F500 in state
- 36
Industry mix (Fortune 500 HQ in FL)
| Industry | F500 HQs | Revenue |
|---|---|---|
| Industrial Technology | 2 | $29B |
|
||
| Insurance | 2 | $17B |
|
||
| Retail | 1 | $60B |
|
||
| Technology Distribution | 1 | $58B |
|
||
| Homebuilding | 1 | $35B |
|
||
| Technology Manufacturing | 1 | $35B |
|
||
Price history
+426.7% since first listed9 events — show timeline
- 2026-06-12 Price Changed $237,000 MARMLS
- 2026-06-11 Listed $247,000 MARMLS
- 2026-04-30 Listing Removed — Beaches MLS
- 2025-12-22 Listed $249,000 Beaches MLS
- 2015-01-26 Listing Removed — MARMLS
- 2014-03-28 Price Changed $169,000 MARMLS
- 2013-12-29 Listed $179,000 MARMLS
- 2000-05-31 Sold (Public Records) $57,000 Public Records
- 1997-01-10 Sold (Public Records) $45,000 Public Records
Property tax history
+4.0%/yrLatest (2025): $3,339 · +5.5% YoY. Source: county tax records.
Cash-flow waterfall
monthlySold comps — $/sqft
last 12 mo · ≤1 miLoading sold comps…