 Triplex
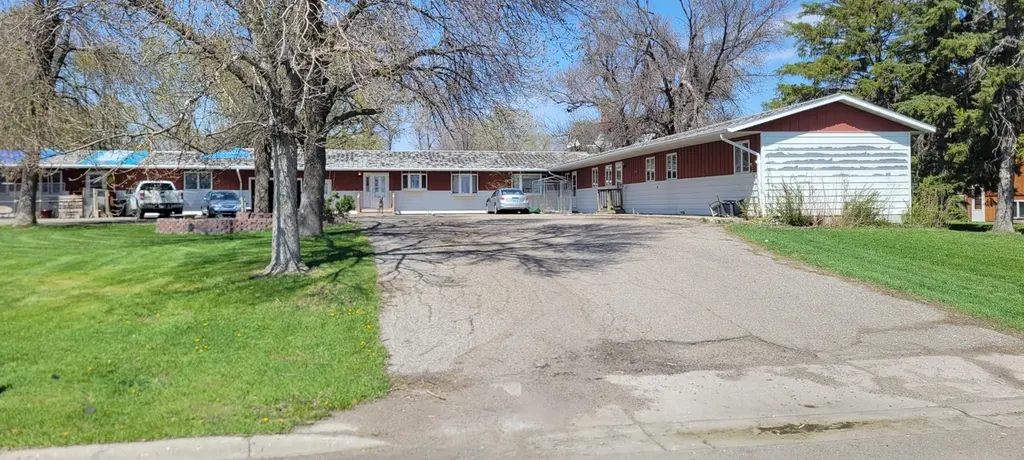
20 5th St E · Halstad, MN
Flood risk No data
- FEMA flood zone
- —
- Chance of flooding over 30 yrs
- —
- Est. flood insurance / yr
- —
Fire risk No data
- Est. fire insurance / yr
- —
Heat risk No data
- Hot days now (above threshold)
- —
- Hot days in 30 yrs
- —
Wind risk No data
- Chance of severe wind over 30 yrs
- —
Air-quality risk No data
- Unhealthy air days now
- —
- Unhealthy air days in 30 yrs
- —
Risk factors via First Street. Map © Google.
Why this score? — see what drove the B+ grade
The composite is a weighted blend of 9 inputs, each scored 0–100. Each bar is that input's sub-score; the figure is the points it added to the 100-point composite (weight × sub-score).
- Cash flow +30.0/30.0
- 1% rule +10.0/10.0
- DSCR +10.0/10.0
- ARV discount +7.5/15.0
- Appreciation +6.5/10.0
- Schools +5.0/10.0
- Livability +3.2/5.0
- Rent growth +2.5/5.0
- Condition / age +2.2/5.0
$89,900
🖨 Deal sheet (PDF) 📄 Offer letter ✓ Due diligence
Multi-family units
County records classify this as Multi-Family (2-4 Unit). Listing-text estimate: 3 units. confirmed
Listing remarks
Investment opportunity in Halstad! This triplex features three spacious apartments, each offering 2 bedrooms, 2 bathrooms, and in-unit laundry. Great layout and strong potential for rental income after improvements. Property is being sold AS-IS and priced well below assessed value to account for needed remodeling and updates. Excellent opportunity for investors, flippers, or buyers looking to build equity. • Triplex • 3 units total • Each unit: 2 bed / 2 bath • In-unit laundry in every apartment • Strong value-add potential • Sold as-is Bring your vision and turn this property into a great income-producing asset! Message for more details or to schedule a show
Key facts
- In-unit laundry
- Triplex
- 9,931 sq ft lot
Tags
Property features AI
Finance
- Other: Turn east on 5th Street off Hwy 75 (directions provided)
- Financial info: 3 total units; Gross income reported as $21,600; Owner insurance expense listed as $1,456; Tenant pays all utilities; Owner pays none of the unit expenses
Exterior
- Parking: Attached garage with asphalt surface; 3 garage spaces
- Utilities: City water connected; City sewer connected; Electric and propane fuel
- Home design: Residential income property — triplex; One level; Above-grade finished area about 3,087 sq ft; Total building area about 4,087 sq ft
- Construction: Asphalt roof (over 8 years old); Concrete perimeter foundation; Foundation area about 4,033
- Exterior features: City street frontage; Lot dimensions approximately 216 x 141 (0.228 acres)
Interior
- Kitchen: Range; Refrigerator
- Bedrooms: Total of 6 bedrooms; Each unit includes 2 bedrooms (3 identical units)
- Bathrooms: Each unit has 2 bathrooms (one full and one three-quarter)
- Heating & cooling: Forced air heating; Baseboard heating; Wall cooling units
- Interior features: Unfinished basement; Concrete perimeter foundation
- Laundry & utility: Washer; Dryer; In-unit laundry
Neighborhood map
What this means for you Summary
Snapshot
- This is a 3 × 2-bed/2-bath units multifamily listed at $90k. Condition is rated fair.
Deal economics
- At list price, monthly cash flow is $2k ($20k/yr) — positive. Per door: $548/mo.
- The deal already cash-flows at list — no discount required.
- Meets the 1% rule at list price ($3k rent vs $90k).
- Recommended offer: $87k (3.0% below list) — sets the bar for market timing.
Location & tenants
- Location reads 65/100 on livability (#557 in MN) — a middle-class / working-renter tenant base. Strengths: cost of living A+, housing A+; Watch: crime D+, health & safety D+, schools D-.
- Market conditions: 7 active listings in the ZIP; 8 units permitted in Norman County in 2024 (0 in 5+ unit buildings).
Forward outlook
- In year one you build about $3k of equity ($622 loan paydown + $3k appreciation (3.0% local appreciation)).
- At projected returns (3.0% appreciation + 3.0% rent growth), your $25k cash investment doubles in ~2 years — after that, you're playing with house money.
- By year 10, paydown + projected appreciation supports a ~$32k cash-out refi (75% LTV) — recoverable capital for the next deal without selling this one.
Negotiation context
- It's been on market 40 days — a 3% lower offer ($87k) is reasonable based on typical stale-listing flexibility.
Questions for the listing agent
- It's been on market 40 days. Have you received any prior offers? Is the seller open to a 3% concession, seller financing, or rate buy-down credit?
- Can we see the unit-by-unit rent roll, current vacancy, and any below-market leases? What's the average tenancy length?
- What capital expenditures (roof, boiler, parking lot, exteriors) have been made in the last 5 years, and what's planned in the next 2?
- Have any recent inspections been done? Can we get a copy of the seller's disclosures and any deferred-maintenance estimates?
- Built in 1960 — when were the roof, HVAC, electrical panel, plumbing, and water heater last replaced?
- Is there a deadline driving the sale (1031 exchange, divorce, estate, relocation)? That informs how much negotiation room exists.
- Schools are D-rated, which usually means shorter tenancies and higher turnover. Who's the typical renter profile here, and what's been the actual vacancy rate?
- Crime grade is D in this area — have there been break-ins, vandalism, or insurance claims at this property in the last 3 years? What carrier currently insures it and at what premium?
- What's the average days-on-market for RENTAL listings here right now (not sales)? A rising rental-DOM trend means longer vacancies and softer asking-rent achievability than the comps imply.
- What's the recent tenant-quality profile in this submarket — average credit score on applications, eviction rate, late-payment / NSF rate, and stable-employment percentage? A property-management company in the area should have these aggregated.
- How much new apartment / multifamily construction is in the pipeline within 1–3 miles? Heavy new supply (>2% of stock underway) typically softens rents 12–24 months out; light construction supports rent growth.
Investment metrics
- 1% rule
- 3.19% ✓
- Cap rate
- 28.24%
- Cash-on-cash
- 78.39%
- DSCR
- 4.49
- GRM
- 2.6
CMA / ARV
No comps found within radius.
Projected returns pro-forma
2.95% appreciation · 3.0% rent growth · sell at horizon
- IRR
- 82.8%
- Equity multiple
- 5.58×
- Total profit
- $115,385
- Equity at exit
- $40,185
- IRR
- 82.4%
- Equity multiple
- 11.50×
- Total profit
- $264,327
- Equity at exit
- $61,745
Cash invested: $25,172 (down + closing). Projections, not guarantees.
Landlord ↔ Tenant lean methodology
- Overall (STATE)
- 46 Balanced
- State Minnesota
- 46 Balanced · D+2
- County
- — inherits STATE
- City
- — inherits STATE
ZIP-level market 56548
- Home prices YoY
- 2.5%
- Active inventory
- 7
- Price-to-rent
- 7.8×
Monthly cashflow live
- Estimated rent
- $2,868 medium interval (Pro) →
- Mortgage (P&I)
- −$471
- Tax est. 1.5%
- −$112 /mo · $1,348/yr
- Insurance
- −$37
- HOA
- −$0
- Vacancy / Maint / Mgmt
- −$602
- Net cashflow
- $1,644
Break-even live
Sensitivity live
| Price | -10% $1,707 | -5% $1,676 | +0% $1,644 | +5% $1,613 | +10% $1,582 |
|---|---|---|---|---|---|
| Rent | -10% $1,418 | -5% $1,531 | +0% $1,644 | +5% $1,758 | +10% $1,871 |
| Rate | -1.0pp $1,690 | -0.5pp $1,667 | base $1,644 | +0.5pp $1,621 | +1.0pp $1,597 |
3-unit breakdown (identical units grouped — click to expand)
| Units | Beds | Baths | Est. rent |
|---|---|---|---|
| 3× units | 2 | 2 | $2,868 |
| #1 | 2 | 2 | $956 |
| #2 | 2 | 2 | $956 |
| #3 | 2 | 2 | $956 |
| Total (3 units) | $2,868 | ||
UW: 25.0% down · 7.5% · 30yr · 1.5% tax · 5.0% vac · 8.0% maint · 8.0% mgmt
Financing live
Cash to close
- Down payment
- $22,475
- Closing costs
- $2,697
- Reserves months
- —
- Total cash needed
- —
Loan-product check · same deal, 3 products live
Conventional
25% down · 7.5% · 30yr
- Down + closing
- —
- Monthly P&I
- —
- Monthly cashflow
- —
- DSCR
- —
- Eligible?
- —
Personal DTI + credit; lowest rate.
DSCR
20% down · 8.5% · 30yr
- Down + closing
- —
- Monthly P&I
- —
- Monthly cashflow
- —
- DSCR
- —
- Eligible?
- —
No personal income docs; deal must DSCR.
Hard money
10% down · 12.0% · 12mo
- Down + closing
- —
- Monthly P&I
- —
- Monthly cashflow
- —
- DSCR
- —
- Eligible?
- —
Short-term bridge; refi at stabilization.
Listing history 17 events
-
2026-06-21days on market $89,900 Active 40 DOM
-
2026-06-18days on market $89,900 Active 38 DOM
-
2026-06-17days on market $89,900 Active 37 DOM
-
2026-06-16days on market $89,900 Active 36 DOM
-
2026-06-15days on market $89,900 Active 35 DOM
-
2026-06-13days on market $89,900 Active 33 DOM
-
2026-06-12days on market $89,900 Active 32 DOM
-
2026-06-09days on market $89,900 Active 29 DOM
-
2026-06-08days on market $89,900 Active 28 DOM
-
2026-06-07days on market $89,900 Active 27 DOM
-
2026-06-05days on market $89,900 Active 25 DOM
-
2026-06-04days on market $89,900 Active 23 DOM
-
2026-06-02days on market $89,900 Active 22 DOM
-
2026-06-01days on market $89,900 Active 21 DOM
-
2026-05-31days on market $89,900 Active 20 DOM
-
2026-05-31days on market $89,900 Active 19 DOM
-
2026-05-11$89,900 Active 705-char remark
ⓘ Source: listings_history table (triggers on properties + properties_extension) + one-shot
backfill from property_details.listing_events for pre-trigger history.
Nearby sold comps map
Loading sold comps map…
Walkable amenities ~0.75 mi
Loading nearby amenities…
Taxation est. · year 1
- Rental income
- $34,416
- − Mortgage interest
- −$5,036
- − Property taxes
- −$1,348
- − Insurance
- −$450
- − Repairs & maintenance
- −$2,753
- − Management
- −$2,753
- − Depreciation
- −$2,615
- Taxable income
- $19,460
- Est. tax owed @ 24.0%
- −$4,670
- After-tax cash flow
- $15,063/yr
For passive investors: Depreciation is non-cash, so a rental often shows a tax loss while cash-flowing — sheltering income. Rental losses are passive: they offset passive income freely, and up to $25,000/yr can offset ordinary (W-2) income if you actively participate and your MAGI is under $100k (phasing out to $0 by $150k); unused losses carry forward. On sale, claimed depreciation is recaptured at up to 25%, and gains may owe capital-gains tax (a 1031 exchange can defer both). Figures are a year-1 estimate at your 24.0% rate — not tax advice; consult a CPA.
Condition & rehab AI · 13 photos
This triplex requires moderate repairs and maintenance to improve its curb appeal and rental value.
Repairs flagged
- Major Paint — Peeling paint indicates significant wear
- Moderate Siding — Weathered siding needs repainting or replacement
Value-add opportunities
- Both Paint and repair exterior — Enhances curb appeal and value
- Both Replace carpet — Fresh carpet improves living space and rental appeal
Renovation cost estimate screening
| Repair item | Severity | Est. cost |
|---|---|---|
| Paint · Peeling paint indicates significant wear | Major | $15,000–50,000 |
| Siding · Weathered siding needs repainting or replacement | Moderate | $3,000–15,000 |
| Total estimated repair cost · 2 items | $18,000–65,000 |
Value-add ROI direction
- Both Paint and repair exterior — Enhances curb appeal and value ↑
- Both Replace carpet — Fresh carpet improves living space and rental appeal ↑
ⓘ Cost ranges are severity-bucket heuristics (US national rule-of-thumb). Get contractor quotes + a written scope before underwriting a rehab budget.
Schools (NCES district)
No district data.
Livability — Halstad
- Score
- 65/100
- State rank
- #557
- US rank
- #13487
Category grades
Schools grade is shown separately in the Schools card above.
Census & demographics
- Census place
- Halstad, MN
- Population (ZIP)
- 724
Population outlook (Norman County) Hauer SSP2
- Today (2025)
- 6,540 people
- By 2030
- 6,489 · -0.8%
- By 2040
- 6,436 · -1.6%
- By 2050
- 6,348 · -2.9%
- By 2075
- 6,263 · -4.2%
- By 2100
- 5,731 · -12.4%
Race, ethnicity, and origin ACS 2023
- Neighborhood character
- Predominantly White (78%)
- Race & ethnicity
- White 78% Hispanic / Latino 16% Two or more races 12% Black 3% Native American 2%
- Hispanic origin (detail)
- Mexican 12% Puerto Rican 2%
- Common ancestry
- Portuguese 36% Romanian 5% Scottish 4%
- Foreign-born
- 3% · Canada
- Languages at home
- 96% English-only · Spanish 2% Russian/Polish/Slavic 1%
Political lean MEDSL · Norman
- 2024 margin
- Strong R (+22.2) · D 37.5% · R 59.8% · Other 2.7%
- 2008→2024 swing
- -49.2pp toward R · 2008: 26.9pp · 2024: -22.2pp
- All cycles
- 2024: R+22.2 2020: R+16.0 2016: R+13.5 2012: D+10.8 2008: D+26.9
Not yet ingested
- Civics
- —
Market trends
- HPI YoY
- ▲ 2.95%
- Current HPI
- 119.4964
- Rent YoY
- —
- Metro
- —
- State GDP YoY
- ▲ 2.41%
- F500 in state
- 34
Industry mix (Fortune 500 HQ in MN)
| Industry | F500 HQs | Revenue |
|---|---|---|
| Healthcare | 2 | $407B |
|
||
| Retail | 2 | $150B |
|
||
| Consumer Goods | 2 | $32B |
|
||
| Industrial Machinery | 2 | $6B |
|
||
| Agriculture | 1 | $40B |
|
||
| Healthcare / Medical Devices | 1 | $32B |
|
||
Price history
1 event — show timeline
- 2026-05-11 Listed $89,900 NORTHSTARMLS as Distributed by MLS Grid
Cash-flow waterfall
monthlySold comps — $/sqft
last 12 mo · ≤1 miLoading sold comps…