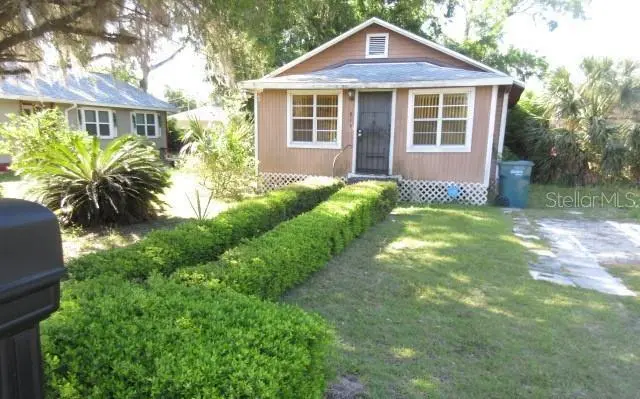
814 NW 2nd St · Ocala, FL
Flood risk 1/10 · Minimal
- FEMA flood zone
- X (unshaded)
- Chance of flooding over 30 yrs
- 0.0%
- Est. flood insurance / yr
- $507 – $1,088
Fire risk 1/10 · Minimal
- Est. fire insurance / yr
- $947 – $1,759
Heat risk 8/10 · Major
- Hot days now (above 107°F)
- 7 days/yr
- Hot days in 30 yrs
- 22 days/yr
Wind risk 9/10 · Severe
- Chance of severe wind over 30 yrs
- 99.0%
Air-quality risk 4/10 · Minor
- Unhealthy air days now
- 5 days/yr
- Unhealthy air days in 30 yrs
- 5 days/yr
Risk factors via First Street. Map © Google.
Why this score? — see what drove the B- grade
The composite is a weighted blend of 9 inputs, each scored 0–100. Each bar is that input's sub-score; the figure is the points it added to the 100-point composite (weight × sub-score).
- Cash flow +30.0/30.0
- 1% rule +10.0/10.0
- DSCR +10.0/10.0
- ARV discount +7.5/15.0
- Schools +3.6/10.0
- Livability +3.5/5.0
- Rent growth +2.5/5.0
- Condition / age +2.5/5.0
- Appreciation +0.0/10.0
$44,500
🖨 Deal sheet (PDF) 📄 Offer letter ✓ Due diligence
Listing remarks MLS
ALERT ALERT!. .INVESTORS. LOOKING TO INVEST? NOW IS THE TIME. Check out this CUTE & COMFY 2/1 HOME. 1 OWNER. JUST RIGHT FOR YOU. Convert EXTRA SPACE INTO BEDROOM, DEN OR OFFICE. NEAR DOWNTOWN. OPEN DINING & LIVING ROOM AREA. .ADORABLE KITCHEN. CLOSE TO MAJOR RETAIL STORES & POPULAR EATERIES. OWNER UPGRADED PLUMBING & ELECTRICAL. HVAC REPLACED 006. MOTIVATED TO SELL.
Key facts
- 3,920 sq ft lot
- Built 1973
- Listed 2 days
Neighborhood map
What this means for you Summary
Snapshot
- This is a 3-bed/1.0-bath single-family listed at $44k.
Deal economics
- At list price, monthly cash flow is $833 ($10k/yr) — positive.
- The deal already cash-flows at list — no discount required.
- Meets the 1% rule at list price ($1k rent vs $44k).
- Cap rate 28.8% vs local median 4.2% in Ocala — top-decile yield for the area; either an underpriced asset or a hidden risk that comps aren't pricing in. Stress-test before assuming the spread holds.
Location & tenants
- Location reads 69/100 on livability (#476 in FL) — a middle-class / working-renter tenant base. Strengths: cost of living A+, housing A+, health & safety A+; Watch: crime F, amenities F, commute F.
- Marion (rural): math 42% / reading 43% proficiency, ranked #61 of 73 in FL (top 84%) — families likely to look elsewhere, expect single-tenant / working-renter base with shorter leases; 61% free/reduced lunch — lower-income household profile, screen leases tightly.
- Market conditions: 199 active listings in the ZIP; 17 comparable units currently listed for rent nearby; rentals at typical pace (median 15d on market — plan ~3-4 weeks tenant-placement turnaround); lower-income renter base — watch delinquency; 7,071 units permitted in Marion County in 2024 (534 in 5+ unit buildings).
- At $1,438/mo this rent would consume 57% of the median local household income ($30k/yr) (locally 923% of renters already pay >50% of income on rent) — very limited rent-growth headroom before tenants either downsize or default.
Forward outlook
- Local home prices are declining (-3.0%/yr); year-one equity from $308 of loan paydown is wiped out by about $1k of value loss. Plan a longer hold.
- Marion County population projected at +13% by 2050 — modest demand growth; plan on rents tracking national, not racing it.
- At projected returns (-3.0% appreciation + 3.0% rent growth), your $12k cash investment doubles in ~2 years — after that, you're playing with house money.
Negotiation context
- Only 2 days on market — expect competitive offers; lowballing is unlikely to land.
- 4 sale attempts since 8y ago with the ask held roughly flat each time — persistent listings suggest the price (not the market) is what's stuck; bring a comps-based counter.
- Current owner paid $38k; 17% above their basis — modest negotiation headroom, anchor on the comps not their cost.
Risks & watch-outs
- Climate carrying-cost: severe wind risk, 99% chance of damaging wind over 30y; extreme-heat days projected 7→22/yr by 2055 (HVAC capex compounding) — expect insurance premiums to compound above CPI over the hold.
Questions for the listing agent
- Built in 1973 — when were the roof, HVAC, electrical panel, plumbing, and water heater last replaced?
- Is there a deadline driving the sale (1031 exchange, divorce, estate, relocation)? That informs how much negotiation room exists.
- Crime grade is F in this area — have there been break-ins, vandalism, or insurance claims at this property in the last 3 years? What carrier currently insures it and at what premium?
- What's the average days-on-market for RENTAL listings here right now (not sales)? A rising rental-DOM trend means longer vacancies and softer asking-rent achievability than the comps imply.
- What's the recent tenant-quality profile in this submarket — average credit score on applications, eviction rate, late-payment / NSF rate, and stable-employment percentage? A property-management company in the area should have these aggregated.
- How much new for-sale + rental construction is in the pipeline within 1–3 miles? Heavy new supply typically softens prices + rents 12–24 months out; constrained supply supports both.
Investment metrics
- 1% rule
- 3.23% ✓
- Cap rate
- 28.77%
- Cash-on-cash
- 80.27%
- DSCR
- 4.57
- GRM
- 2.6
CMA / ARV
No comps found within radius.
Projected returns pro-forma
-3.0% appreciation · 3.0% rent growth · sell at horizon
- IRR
- 80.5%
- Equity multiple
- 4.68×
- Total profit
- $45,892
- Equity at exit
- $6,635
- IRR
- 83.9%
- Equity multiple
- 9.70×
- Total profit
- $108,392
- Equity at exit
- $3,848
Cash invested: $12,460 (down + closing). Projections, not guarantees.
Landlord ↔ Tenant lean methodology
- Overall (STATE)
- 87 Strongly Landlord-Friendly
- State Florida
- 87 Strongly Landlord-Friendly · R+3
- County
- — inherits STATE
- City
- — inherits STATE
ZIP-level market 34475
- Home prices YoY
- -8.0%
- Active inventory
- 199
- Price-to-rent
- 2.6×
Monthly cashflow live
- Estimated rent
- $1,438 high interval (Pro) →
- Mortgage (P&I)
- −$233
- Tax from tax record
- −$51 /mo · $607/yr
- Insurance
- −$19
- HOA
- −$0
- Vacancy / Maint / Mgmt
- −$302
- Net cashflow
- $833
Break-even live
Sensitivity live
| Price | -10% $859 | -5% $846 | +0% $833 | +5% $821 | +10% $808 |
|---|---|---|---|---|---|
| Rent | -10% $720 | -5% $777 | +0% $833 | +5% $890 | +10% $947 |
| Rate | -1.0pp $856 | -0.5pp $845 | base $833 | +0.5pp $822 | +1.0pp $810 |
UW: 25.0% down · 7.5% · 30yr · 1.5% tax · 5.0% vac · 8.0% maint · 8.0% mgmt
Financing live
Cash to close
- Down payment
- $11,125
- Closing costs
- $1,335
- Reserves months
- —
- Total cash needed
- —
Loan-product check · same deal, 3 products live
Conventional
25% down · 7.5% · 30yr
- Down + closing
- —
- Monthly P&I
- —
- Monthly cashflow
- —
- DSCR
- —
- Eligible?
- —
Personal DTI + credit; lowest rate.
DSCR
20% down · 8.5% · 30yr
- Down + closing
- —
- Monthly P&I
- —
- Monthly cashflow
- —
- DSCR
- —
- Eligible?
- —
No personal income docs; deal must DSCR.
Hard money
10% down · 12.0% · 12mo
- Down + closing
- —
- Monthly P&I
- —
- Monthly cashflow
- —
- DSCR
- —
- Eligible?
- —
Short-term bridge; refi at stabilization.
Rent comps 17 comps
| Address | Beds | Baths | Sqft | Rent | $/sqft | DOM | Units | Dist |
|---|---|---|---|---|---|---|---|---|
| 717 W Silver Springs Pl Ocala, FL | 3.0 | 2.0 | 1000 | $1,445 | $1.45 | 14d | 1 | 0.06mi |
| 12 NW 16th Ct Ocala, FL | 2.0 | 1.0 | 576 | $1,050 | $1.82 | 22d | 1 | 0.46mi |
| 1809 SW 3rd St Ocala, FL | 2.0 | 1.0 | 600 | $1,025 | $1.71 | 14d | 1 | 0.64mi |
| 1911 NW 6th St Ocala, FL | 3.0 | 1.0 | 877 | $1,400 | $1.60 | 14d | 1 | 0.73mi |
| 900 SE 3rd Ave Ocala, FL | 2.0–3.0 | 2.0 | 1160 | $2,325 | $2.00 | 14d | 4 | 0.90mi |
| 715 NE 3rd St Ocala, FL | 2.0 | 1.0 | 850 | $1,475 | $1.74 | 14d | 1 | 0.92mi |
| 708 SW 20th Ave Ocala, FL | 2.0 | 1.0 | 700 | $999 | $1.43 | 22d | 1 | 0.94mi |
| 2006 SW 7th St Ocala, FL | 2.0 | 1.0 | 700 | $1,050 | $1.50 | 22d | 1 | 0.95mi |
| 1908 NW 13th Pl Ocala, FL | 3.0 | 1.0 | 1000 | $1,325 | $1.32 | 22d | 1 | 1.03mi |
| 815 E Fort King St Unit B-813 Ocala, FL | 2.0 | 1.5 | 700 | $1,199 | $1.71 | 14d | 1 | 1.03mi |
| 815 E Fort King St Unit D-817 Ocala, FL | 2.0 | 1.0 | 700 | $1,299 | $1.86 | 22d | 1 | 1.03mi |
| 2305 SW 2nd St Unit A Ocala, FL | 2.0 | 1.0 | 676 | $1,175 | $1.74 | 22d | 1 | 1.03mi |
| 510 SE 11th St Unit 510-D Ocala, FL | 2.0 | 1.0 | 925 | $995 | $1.08 | 14d | 1 | 1.09mi |
| 1030 E Fort King St Ocala, FL | 1.0–2.0 | 1.0 | 612 | $1,499 | $2.45 | 14d | 2 | 1.25mi |
| 730 SE 13th St Ocala, FL | 2.0 | 1.0 | 1000 | $1,499 | $1.50 | 22d | 1 | 1.27mi |
| 1220 SE 3rd St Ocala, FL | 2.0 | 1.0 | 800 | $1,550 | $1.94 | 22d | 1 | 1.41mi |
| 1243 NE 6th Pl Ocala, FL | 2.0 | 1.0 | 868 | $1,650 | $1.90 | 14d | 1 | 1.49mi |
Listing history 8 events
-
2026-04-24status Pending
-
2026-04-22$44,500 Active
-
2018-10-04soldstatus $38,000 392-char remark
Show marketing remark (392 chars)
ALERT ALERT!. .INVESTORS. LOOKING TO INVEST? NOW IS THE TIME. Check out this CUTE & COMFY 2/1 HOME. 1 OWNER. JUST RIGHT FOR YOU. Convert EXTRA SPACE INTO BEDROOM, DEN OR OFFICE. NEAR DOWNTOWN. OPEN DINING & LIVING ROOM AREA. .ADORABLE KITCHEN. CLOSE TO MAJOR RETAIL STORES & POPULAR EATERIES. OWNER UPGRADED PLUMBING & ELECTRICAL. HVAC REPLACED 006. MOTIVATED TO SELL.
-
2018-09-01historical
-
2018-03-20$40,000 392-char remark
Show marketing remark (392 chars)
ALERT ALERT!. .INVESTORS. LOOKING TO INVEST? NOW IS THE TIME. Check out this CUTE & COMFY 2/1 HOME. 1 OWNER. JUST RIGHT FOR YOU. Convert EXTRA SPACE INTO BEDROOM, DEN OR OFFICE. NEAR DOWNTOWN. OPEN DINING & LIVING ROOM AREA. .ADORABLE KITCHEN. CLOSE TO MAJOR RETAIL STORES & POPULAR EATERIES. OWNER UPGRADED PLUMBING & ELECTRICAL. HVAC REPLACED 006. MOTIVATED TO SELL.
-
2018-03-20$49,999
Show marketing remark (392 chars)
ALERT ALERT!. .INVESTORS. LOOKING TO INVEST? NOW IS THE TIME. Check out this CUTE & COMFY 2/1 HOME. 1 OWNER. JUST RIGHT FOR YOU. Convert EXTRA SPACE INTO BEDROOM, DEN OR OFFICE. NEAR DOWNTOWN. OPEN DINING & LIVING ROOM AREA. .ADORABLE KITCHEN. CLOSE TO MAJOR RETAIL STORES & POPULAR EATERIES. OWNER UPGRADED PLUMBING & ELECTRICAL. HVAC REPLACED 006. MOTIVATED TO SELL.
-
2018-03-20historical
Show marketing remark (392 chars)
ALERT ALERT!. .INVESTORS. LOOKING TO INVEST? NOW IS THE TIME. Check out this CUTE & COMFY 2/1 HOME. 1 OWNER. JUST RIGHT FOR YOU. Convert EXTRA SPACE INTO BEDROOM, DEN OR OFFICE. NEAR DOWNTOWN. OPEN DINING & LIVING ROOM AREA. .ADORABLE KITCHEN. CLOSE TO MAJOR RETAIL STORES & POPULAR EATERIES. OWNER UPGRADED PLUMBING & ELECTRICAL. HVAC REPLACED 006. MOTIVATED TO SELL.
-
2018-02-19$55,000
ⓘ Source: listings_history table (triggers on properties + properties_extension) + one-shot
backfill from property_details.listing_events for pre-trigger history.
Tax reassessment forecast FL · Resets to sale price
- Current annual tax
- $607 · $51/mo
- Projected year-2 tax
- $607 · $51/mo
- Expected delta
- $0/yr ($0/mo · 0.0%)
ⓘ Screening estimate from a state-policy table — verify with the county assessor before closing.
Climate risk First Street
- Flood 1/10 Low FEMA zone X (unshaded) · 0% chance over 30 yrs
- Wildfire 1/10 Low
- Heat 8/10 Severe 7 d/yr ≥107°F today · 22 d/yr by 30 yrs out
- Wind 9/10 Extreme 99% chance of damaging wind over 30 yrs
- Air quality 4/10 Moderate 5 unhealthy d/yr today · 5 by 30 yrs out
Nearby sold comps map
Loading sold comps map…
Walkable amenities ~0.75 mi
Loading nearby amenities…
Taxation est. · year 1
- Rental income
- $17,255
- − Mortgage interest
- −$2,493
- − Property taxes
- −$607
- − Insurance
- −$222
- − Repairs & maintenance
- −$1,380
- − Management
- −$1,380
- − Depreciation
- −$1,295
- Taxable income
- $9,878
- Est. tax owed @ 24.0%
- −$2,371
- After-tax cash flow
- $7,631/yr
For passive investors: Depreciation is non-cash, so a rental often shows a tax loss while cash-flowing — sheltering income. Rental losses are passive: they offset passive income freely, and up to $25,000/yr can offset ordinary (W-2) income if you actively participate and your MAGI is under $100k (phasing out to $0 by $150k); unused losses carry forward. On sale, claimed depreciation is recaptured at up to 25%, and gains may owe capital-gains tax (a 1031 exchange can defer both). Figures are a year-1 estimate at your 24.0% rate — not tax advice; consult a CPA.
Schools (NCES district)
- District
- Marion
- NCES district ID
- 1201260
- Math proficiency
- 42% ▼ -7.00%
- Reading proficiency
- 43% ▼ -4.00%
- Median HH income
- $40,015
- Composite
- 35.61/100
- National rank
- #4890
- State rank
- #61 of 73 in FL
Livability — Ocala
- Score
- 69/100
- State rank
- #476
- US rank
- #8461
Category grades
Schools grade is shown separately in the Schools card above.
Census & demographics
- Census place
- Ocala, FL
- County
- Marion County · 315,796 people
- City population
- 263,375
- Metro
- Ocala, FL
- Population (ZIP)
- 14,301
- Household income
- $30,174
- Rent vs Own
- Severe rent burden
- 923.0
Population outlook (Marion County) Hauer SSP2
- Today (2025)
- 365,905 people
- By 2030
- 376,768 · +3.0%
- By 2040
- 396,555 · +8.4%
- By 2050
- 412,723 · +12.8%
- By 2075
- 446,090 · +21.9%
- By 2100
- 436,193 · +19.2%
Race, ethnicity, and origin ACS 2023
- Neighborhood character
- Diverse neighborhood (Simpson 0.68)
- Race & ethnicity
- Black 44% White 30% Hispanic / Latino 19% Two or more races 11%
- Hispanic origin (detail)
- Mexican 1% Puerto Rican 8% Cuban 3%
- Common ancestry
- Serbian 2% Hispanic 1% Lithuanian 1%
- Foreign-born
- 8% · Canada, China, Jamaica
- Languages at home
- 84% English-only · Spanish 13% French/Haitian/Cajun 2%
Political lean MEDSL · Marion
- 2024 margin
- Solid R (+31.6) · D 33.8% · R 65.5%
- 2008→2024 swing
- -20.0pp toward R · 2008: -11.6pp · 2024: -31.6pp
- All cycles
- 2024: R+31.6 2020: R+25.9 2016: R+26.2 2012: R+16.2 2008: R+11.6
Not yet ingested
- Civics
- —
Market trends
- HPI YoY
- ▼ -22.26%
- Current HPI
- 254.6319
- Rent YoY
- —
- Metro
- Ocala, FL
- State GDP YoY
- ▲ 3.28%
- F500 in state
- 36
Industry mix (Fortune 500 HQ in FL)
| Industry | F500 HQs | Revenue |
|---|---|---|
| Industrial Technology | 2 | $29B |
|
||
| Insurance | 2 | $17B |
|
||
| Retail | 1 | $60B |
|
||
| Technology Distribution | 1 | $58B |
|
||
| Homebuilding | 1 | $35B |
|
||
| Technology Manufacturing | 1 | $35B |
|
||
Price history
-19.1% since first listed8 events — show timeline
- 2026-04-24 Pending — Stellar MLS as Distributed by MLS Grid
- 2026-04-22 Listed $44,500 Stellar MLS as Distributed by MLS Grid
- 2018-10-04 Sold (MLS) $38,000 Stellar MLS as Distributed by MLS Grid
- 2018-09-01 Listing Removed — Stellar MLS as Distributed by MLS Grid
- 2018-03-20 Listing Removed — Stellar MLS as Distributed by MLS Grid
- 2018-03-20 Listed $49,999 Stellar MLS as Distributed by MLS Grid
- 2018-03-20 Listed $40,000 Stellar MLS as Distributed by MLS Grid
- 2018-02-19 Listed $55,000 Stellar MLS as Distributed by MLS Grid
Property tax history
+8.7%/yrLatest (2025): $607 · +2.8% YoY. Source: county tax records.
Cash-flow waterfall
monthlySold comps — $/sqft
last 12 mo · ≤1 miLoading sold comps…