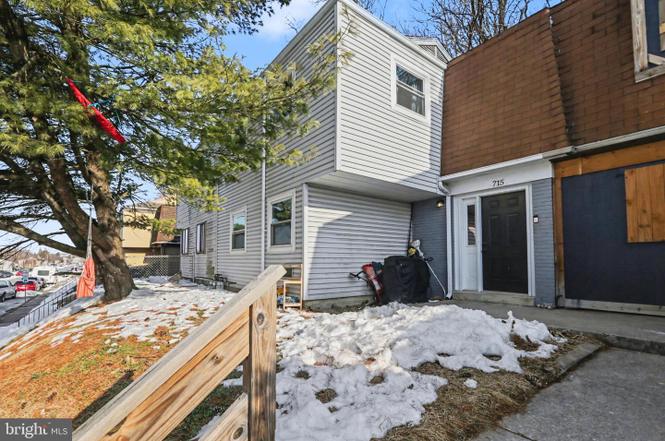
715 Saint Marys Dr · Steelton, PA
Flood risk 5/10 · Moderate
- FEMA flood zone
- X (unshaded)
- Chance of flooding over 30 yrs
- 0.27%
- Est. flood insurance / yr
- $507 – $1,088
Fire risk 1/10 · Minimal
- Est. fire insurance / yr
- $511 – $949
Heat risk 5/10 · Moderate
- Hot days now (above 101°F)
- 7 days/yr
- Hot days in 30 yrs
- 16 days/yr
Wind risk 3/10 · Minor
- Chance of severe wind over 30 yrs
- 5.0%
Air-quality risk 3/10 · Minor
- Unhealthy air days now
- 3 days/yr
- Unhealthy air days in 30 yrs
- 5 days/yr
Risk factors via First Street. Map © Google.
Why this score? — see what drove the C- grade
The composite is a weighted blend of 9 inputs, each scored 0–100. Each bar is that input's sub-score; the figure is the points it added to the 100-point composite (weight × sub-score).
- Cash flow +16.9/30.0
- ARV discount +15.0/15.0
- DSCR +5.3/10.0
- 1% rule +4.3/10.0
- Livability +3.4/5.0
- Rent growth +2.5/5.0
- Condition / age +2.5/5.0
- Schools +0.5/10.0
- Appreciation +0.0/10.0
$152,900
🖨 Deal sheet (PDF) 📄 Offer letter ✓ Due diligence
Listing remarks MLS
Welcome Home to this great 3bed 1 bath home!
Key facts
- Built 1975
- Listed 51 days
Neighborhood map
What this means for you Summary
Snapshot
- This is a 3-bed/1.0-bath single-family listed at $153k.
Deal economics
- At list price, monthly cash flow is $101 ($1k/yr) — positive.
- The deal already cash-flows at list — no discount required.
- To meet the 1% rule (rent ≥ 1% of price), the offer needs to be $143k (6.6% below list).
- Recommended offer: $143k (6.6% below list) — sets the bar for 1% rule.
Location & tenants
- Location reads 67/100 on livability (#971 in PA) — a middle-class / working-renter tenant base. Strengths: cost of living A+, housing A+, health & safety A+; Watch: employment C-, crime F, amenities F.
- Steelton-Highspire SD (suburban): math 2% / reading 9% proficiency, ranked #538 of 539 in PA (top 100%) — low school quality limits family demand, transient renter base, plan for 1-2y turnover; 68% free/reduced lunch — lower-income household profile, screen leases tightly.
- Zoned schools: Steelton-Highspire El Sch (math 2% / reading 12%, grade F, #1,491 of 1,518 statewide, top 98%, 738 students, 100% FRL); Steelton-Highspire Hs (math 2% / reading 6%, grade F, #434 of 437 statewide, top 99%, 599 students, 100% FRL) — zoned schools average 100% FRL vs 68% district-wide (32 pts higher); higher-poverty schools than district average — tighter screening recommended.
- Market conditions: 68 active listings in the ZIP; 10 comparable units currently listed for rent nearby; rentals at typical pace (median 16d on market — plan ~3-4 weeks tenant-placement turnaround); 540 units permitted in Dauphin County in 2024 (194 in 5+ unit buildings).
Forward outlook
- Local home prices are declining (-3.0%/yr); year-one equity from $1k of loan paydown is wiped out by about $5k of value loss. Plan a longer hold.
Negotiation context
- It's been on market 51 days — a 3% lower offer ($148k) is reasonable based on typical stale-listing flexibility.
- 3 sale attempts since 5y ago with the ask held roughly flat each time — persistent listings suggest the price (not the market) is what's stuck; bring a comps-based counter.
Risks & watch-outs
- Climate carrying-cost: moderate flood risk; extreme-heat days projected 7→16/yr by 2055 (HVAC capex compounding) — expect insurance premiums to compound above CPI over the hold.
Questions for the listing agent
- It's been on market 51 days. Have you received any prior offers? Is the seller open to a 7% concession, seller financing, or rate buy-down credit?
- Built in 1975 — when were the roof, HVAC, electrical panel, plumbing, and water heater last replaced?
- Is there a deadline driving the sale (1031 exchange, divorce, estate, relocation)? That informs how much negotiation room exists.
- Schools are F-rated, which usually means shorter tenancies and higher turnover. Who's the typical renter profile here, and what's been the actual vacancy rate?
- Crime grade is F in this area — have there been break-ins, vandalism, or insurance claims at this property in the last 3 years? What carrier currently insures it and at what premium?
- What's the average days-on-market for RENTAL listings here right now (not sales)? A rising rental-DOM trend means longer vacancies and softer asking-rent achievability than the comps imply.
- What's the recent tenant-quality profile in this submarket — average credit score on applications, eviction rate, late-payment / NSF rate, and stable-employment percentage? A property-management company in the area should have these aggregated.
- How much new for-sale + rental construction is in the pipeline within 1–3 miles? Heavy new supply typically softens prices + rents 12–24 months out; constrained supply supports both.
Investment metrics
- 1% rule
- 0.93% ✗
- Cap rate
- 7.08%
- Cash-on-cash
- 2.82%
- DSCR
- 1.13
- GRM
- 8.9
CMA / ARV
- ARV (on-the-fly)
- $198,505
- Comps found
- 12
Show comp detail 12 sales within ~0.75 mi
| Address | Dist | Beds/Ba | Sqft | Sold | Price | $/sf | Match |
|---|---|---|---|---|---|---|---|
| 422 High St | 0.29mi | 3/1.5 | 1,416 (+3%) | 12mo | $198,900 | $140 | 68 |
| 616 2nd St | 0.45mi | 3/2.0 | 1,366 (-0%) | 14mo | $150,000 | $110 | 63 |
| 510 Chambers St | 0.32mi | 2/1.0 (-1) | 1,240 (-9%) | 2mo | $218,000 | $176 | 63 |
| 351 Catherine St | 0.65mi | 3/1.5 | 1,378 (+1%) | 7mo | $200,000 | $145 | 61 |
| 791 Chambers St | 0.67mi | 3/1.0 | 1,400 (+2%) | 8mo | $254,000 | $181 | 59 |
| 710 Main St | 0.50mi | 3/1.0 | 1,486 (+8%) | 6mo | $210,000 | $141 | 57 |
| 816 Mohn St | 0.58mi | 3/1.5 | 1,408 (+3%) | 13mo | $250,000 | $178 | 56 |
| 342 S 3rd St | 0.46mi | 4/— (+1) | 1,498 (+9%) | 3mo | $156,000 | $104 | 55 |
| 743 Monroe St | 0.57mi | 3/1.5 | 1,300 (-5%) | 14mo | $245,900 | $189 | 51 |
| 662 Woodview St | 0.42mi | 4/2.5 (+1) | 1,254 (-8%) | 7mo | $262,500 | $209 | 50 |
| 314 S 2nd St | 0.52mi | 2/1.0 (-1) | 1,568 (+14%) | 15mo | $160,000 | $102 | 34 |
| 211 Park Ave | 0.70mi | 4/1.0 (+1) | 1,501 (+10%) | 16mo | $210,000 | $140 | 33 |
Match score weights: distance 35% · size 25% · config 20% · recency 20%. Top-matched comps best support the ARV.
Projected returns pro-forma
-3.0% appreciation · 3.0% rent growth · sell at horizon
- IRR
- -11.8%
- Equity multiple
- 0.57×
- Total profit
- $-18,360
- Equity at exit
- $22,798
- IRR
- -2.7%
- Equity multiple
- 0.82×
- Total profit
- $-7,715
- Equity at exit
- $13,220
Cash invested: $42,812 (down + closing). Projections, not guarantees.
Landlord ↔ Tenant lean methodology
- Overall (STATE)
- 62 Landlord-Friendly
- State Pennsylvania
- 62 Landlord-Friendly · EVEN
- County
- — inherits STATE
- City
- — inherits STATE
ZIP-level market 17113
- Home prices YoY
- -16.3%
- Active inventory
- 68
- Price-to-rent
- 8.9×
Monthly cashflow live
- Estimated rent
- $1,428 high interval (Pro) →
- Mortgage (P&I)
- −$802
- Tax from tax record
- −$162 /mo · $1,944/yr
- Insurance
- −$64
- HOA
- −$0
- Vacancy / Maint / Mgmt
- −$300
- Net cashflow
- $101
Break-even live
Sensitivity live
| Price | -10% $187 | -5% $144 | +0% $101 | +5% $57 | +10% $14 |
|---|---|---|---|---|---|
| Rent | -10% $-12 | -5% $44 | +0% $101 | +5% $157 | +10% $214 |
| Rate | -1.0pp $178 | -0.5pp $140 | base $101 | +0.5pp $61 | +1.0pp $21 |
UW: 25.0% down · 7.5% · 30yr · 1.5% tax · 5.0% vac · 8.0% maint · 8.0% mgmt
Financing live
Cash to close
- Down payment
- $38,225
- Closing costs
- $4,587
- Reserves months
- —
- Total cash needed
- —
Loan-product check · same deal, 3 products live
Conventional
25% down · 7.5% · 30yr
- Down + closing
- —
- Monthly P&I
- —
- Monthly cashflow
- —
- DSCR
- —
- Eligible?
- —
Personal DTI + credit; lowest rate.
DSCR
20% down · 8.5% · 30yr
- Down + closing
- —
- Monthly P&I
- —
- Monthly cashflow
- —
- DSCR
- —
- Eligible?
- —
No personal income docs; deal must DSCR.
Hard money
10% down · 12.0% · 12mo
- Down + closing
- —
- Monthly P&I
- —
- Monthly cashflow
- —
- DSCR
- —
- Eligible?
- —
Short-term bridge; refi at stabilization.
Rent comps 10 comps
| Address | Beds | Baths | Sqft | Rent | $/sqft | DOM | Units | Dist |
|---|---|---|---|---|---|---|---|---|
| 640 S 2nd St Steelton, PA | 3.0 | 1.5 | 1290 | $1,400 | $1.09 | 25d | 1 | 0.11mi |
| 25 Chestnut St Steelton, PA | 3.0 | 1.0 | 1146 | $1,250 | $1.09 | 16d | 1 | 0.56mi |
| 971 Monroe St Harrisburg, PA | 2.0 | 1.5 | 1120 | $1,600 | $1.43 | 16d | 1 | 0.78mi |
| 322 Pine St Unit 2 Steelton, PA | 3.0 | 1.0 | 1100 | $995 | $0.90 | 45d | 1 | 0.94mi |
| 314 Lincoln St Steelton, PA | 3.0 | 1.0 | 1264 | $1,595 | $1.26 | 16d | 1 | 1.17mi |
| 316 N 2nd St Steelton, PA | 3.0 | 1.5 | 1524 | $1,600 | $1.05 | 16d | 1 | 1.17mi |
| 465 Sunday Dr Harrisburg, PA | 3.0 | 2.5 | 1540 | $1,895 | $1.23 | 16d | 1 | 1.19mi |
| 325 Lincoln St Steelton, PA | 3.0 | 1.0 | 1186 | $1,250 | $1.05 | 16d | 1 | 1.19mi |
| 508 N 2nd St Steelton, PA | 3.0 | 1.5 | 1360 | $1,450 | $1.07 | 16d | 1 | 1.31mi |
| 589 Yale St Harrisburg, PA | 2.0 | 2.0 | 911 | $1,549 | $1.70 | 16d | 1 | 1.47mi |
Listing history 19 events
-
2026-04-11status Pending
-
2026-04-04price $152,900
-
2026-02-20$154,900 Active
-
2026-02-17historical $154,900
-
2024-03-01soldstatus $145,000 Closed 44-char remark
Show marketing remark (44 chars)
Welcome Home to this great 3bed 1 bath home!
-
2024-03-01soldstatus $145,000
Show marketing remark (44 chars)
Welcome Home to this great 3bed 1 bath home!
-
2024-01-24status Pending 44-char remark
Show marketing remark (44 chars)
Welcome Home to this great 3bed 1 bath home!
-
2024-01-11$149,900 Active 44-char remark
Show marketing remark (44 chars)
Welcome Home to this great 3bed 1 bath home!
-
2022-07-17price $1,350
-
2021-09-17soldstatus $61,900 Closed 362-char remark
Show marketing remark (362 chars)
* Property is currently tenant occupied, photos used are prior to tenants move in out of respect for the tenants privacy * This 3 bedroom 1 bath townhome in Steelton is the perfect place to call home or the perfect place to have an investment property. Property is currently tenant occupied with a rental rate of $850/month with the tenant paying all utilities.
-
2021-09-17soldstatus $61,900
Show marketing remark (362 chars)
* Property is currently tenant occupied, photos used are prior to tenants move in out of respect for the tenants privacy * This 3 bedroom 1 bath townhome in Steelton is the perfect place to call home or the perfect place to have an investment property. Property is currently tenant occupied with a rental rate of $850/month with the tenant paying all utilities.
-
2021-08-19status Pending 362-char remark
Show marketing remark (362 chars)
* Property is currently tenant occupied, photos used are prior to tenants move in out of respect for the tenants privacy * This 3 bedroom 1 bath townhome in Steelton is the perfect place to call home or the perfect place to have an investment property. Property is currently tenant occupied with a rental rate of $850/month with the tenant paying all utilities.
-
2021-08-17price $69,900 362-char remark
Show marketing remark (362 chars)
* Property is currently tenant occupied, photos used are prior to tenants move in out of respect for the tenants privacy * This 3 bedroom 1 bath townhome in Steelton is the perfect place to call home or the perfect place to have an investment property. Property is currently tenant occupied with a rental rate of $850/month with the tenant paying all utilities.
-
2021-08-03price $79,900 362-char remark
Show marketing remark (362 chars)
* Property is currently tenant occupied, photos used are prior to tenants move in out of respect for the tenants privacy * This 3 bedroom 1 bath townhome in Steelton is the perfect place to call home or the perfect place to have an investment property. Property is currently tenant occupied with a rental rate of $850/month with the tenant paying all utilities.
-
2021-07-12$85,000 Active 362-char remark
Show marketing remark (362 chars)
* Property is currently tenant occupied, photos used are prior to tenants move in out of respect for the tenants privacy * This 3 bedroom 1 bath townhome in Steelton is the perfect place to call home or the perfect place to have an investment property. Property is currently tenant occupied with a rental rate of $850/month with the tenant paying all utilities.
-
2012-07-30soldstatus $65,000
-
2012-06-27soldstatus $44,000
-
1995-07-27soldstatus $34,000
-
1991-04-04soldstatus $29,500
ⓘ Source: listings_history table (triggers on properties + properties_extension) + one-shot
backfill from property_details.listing_events for pre-trigger history.
Tax reassessment forecast PA · Partial reset (capped growth)
- Current annual tax
- $1,944 · $162/mo
- Projected year-2 tax
- $2,180 · $182/mo
- Expected delta
- +$236/yr (+$20/mo · 12.1%)
ⓘ Screening estimate from a state-policy table — verify with the county assessor before closing.
Climate risk First Street
- Flood 5/10 Major FEMA zone X (unshaded) · 27% chance over 30 yrs
- Wildfire 1/10 Low
- Heat 5/10 Major 7 d/yr ≥101°F today · 16 d/yr by 30 yrs out
- Wind 3/10 Moderate 5% chance of damaging wind over 30 yrs
- Air quality 3/10 Moderate 3 unhealthy d/yr today · 5 by 30 yrs out
Nearby sold comps map
Loading sold comps map…
Walkable amenities ~0.75 mi
Loading nearby amenities…
Taxation est. · year 1
- Rental income
- $17,138
- − Mortgage interest
- −$8,565
- − Property taxes
- −$1,944
- − Insurance
- −$764
- − Repairs & maintenance
- −$1,371
- − Management
- −$1,371
- − Depreciation
- −$4,448
- Taxable loss
- −$1,326
- Est. tax savings @ 24.0%
- +$318
- After-tax cash flow
- $1,526/yr
For passive investors: Depreciation is non-cash, so a rental often shows a tax loss while cash-flowing — sheltering income. Rental losses are passive: they offset passive income freely, and up to $25,000/yr can offset ordinary (W-2) income if you actively participate and your MAGI is under $100k (phasing out to $0 by $150k); unused losses carry forward. On sale, claimed depreciation is recaptured at up to 25%, and gains may owe capital-gains tax (a 1031 exchange can defer both). Figures are a year-1 estimate at your 24.0% rate — not tax advice; consult a CPA.
Schools (NCES district)
- District
- Steelton-Highspire SD
- NCES district ID
- 4222800
- Math proficiency
- 2% ▼ -4.00%
- Reading proficiency
- 9% ▼ -12.00%
- Median HH income
- $40,685
- Composite
- 4.98/100
- National rank
- #10040
- State rank
- #538 of 539 in PA
Livability — Steelton
- Score
- 67/100
- State rank
- #971
- US rank
- #10606
Category grades
Schools grade is shown separately in the Schools card above.
Census & demographics
- Census place
- Steelton, PA
- County
- Dauphin County · 247,857 people
- City population
- 19,401
- Metro
- Harrisburg-Carlisle, PA
- Population (ZIP)
- 11,724
- Household income
- $68,244
- Rent vs Own
- Severe rent burden
- 338.0
Population outlook (Dauphin County) Hauer SSP2
- Today (2025)
- 281,628 people
- By 2030
- 283,549 · +0.7%
- By 2040
- 285,385 · +1.3%
- By 2050
- 286,188 · +1.6%
- By 2075
- 291,053 · +3.3%
- By 2100
- 282,374 · +0.3%
Race, ethnicity, and origin ACS 2023
- Neighborhood character
- Diverse neighborhood (Simpson 0.67)
- Race & ethnicity
- White 48% Hispanic / Latino 24% Black 22% Two or more races 19% Native American 2% Asian 2%
- Hispanic origin (detail)
- Mexican 7% Puerto Rican 11% Cuban 2%
- Common ancestry
- Romanian 1% Lithuanian 1% Iranian 1%
- Foreign-born
- 7% · Canada, India
- Languages at home
- 80% English-only · Spanish 17% Other Indo-European 1% Russian/Polish/Slavic 1%
Political lean MEDSL · Dauphin
- 2024 margin
- Lean D (+5.9) · D 52.4% · R 46.5% · Other 1.1%
- 2008→2024 swing
- -3.1pp toward R · 2008: 9.1pp · 2024: 5.9pp
- All cycles
- 2024: D+5.9 2020: D+8.5 2016: D+2.8 2012: D+6.0 2008: D+9.1
Not yet ingested
- Civics
- —
Market trends
- HPI YoY
- ▼ -54.73%
- Current HPI
- 281.6906
- Rent YoY
- —
- Metro
- Harrisburg-Carlisle, PA
- State GDP YoY
- ▲ 1.68%
- F500 in state
- 34
Industry mix (Fortune 500 HQ in PA)
| Industry | F500 HQs | Revenue |
|---|---|---|
| Healthcare | 2 | $309B |
|
||
| Insurance | 2 | $27B |
|
||
| Telecommunications / Media | 1 | $124B |
|
||
| Industrial Distribution | 1 | $22B |
|
||
| Financial Services | 1 | $20B |
|
||
| Chemicals / Materials | 1 | $18B |
|
||
Price history
+418.3% since first listed19 events — show timeline
- 2026-04-11 Pending — BRIGHT MLS
- 2026-04-04 Price Changed $152,900 BRIGHT MLS
- 2026-02-20 Listed $154,900 BRIGHT MLS
- 2026-02-17 Coming Soon $154,900 BRIGHT MLS
- 2024-03-01 Sold (Public Records) $145,000 Public Records
- 2024-03-01 Sold (MLS) $145,000 BRIGHT MLS
- 2024-01-24 Pending — BRIGHT MLS
- 2024-01-11 Listed $149,900 BRIGHT MLS
- 2022-07-17 Price Changed $1,350 RENT.
- 2021-09-17 Sold (Public Records) $61,900 Public Records
- 2021-09-17 Sold (MLS) $61,900 BRIGHT MLS
- 2021-08-19 Pending — BRIGHT MLS
- 2021-08-17 Price Changed $69,900 BRIGHT MLS
- 2021-08-03 Price Changed $79,900 BRIGHT MLS
- 2021-07-12 Listed $85,000 BRIGHT MLS
- 2012-07-30 Sold (Public Records) $65,000 Public Records
- 2012-06-27 Sold (Public Records) $44,000 Public Records
- 1995-07-27 Sold (Public Records) $34,000 Public Records
- 1991-04-04 Sold (Public Records) $29,500 Public Records
Property tax history
+1.2%/yrLatest (2026): $1,944 · +7.2% YoY. Source: county tax records.
Cash-flow waterfall
monthlySold comps — $/sqft
last 12 mo · ≤1 miLoading sold comps…