 Fourplex
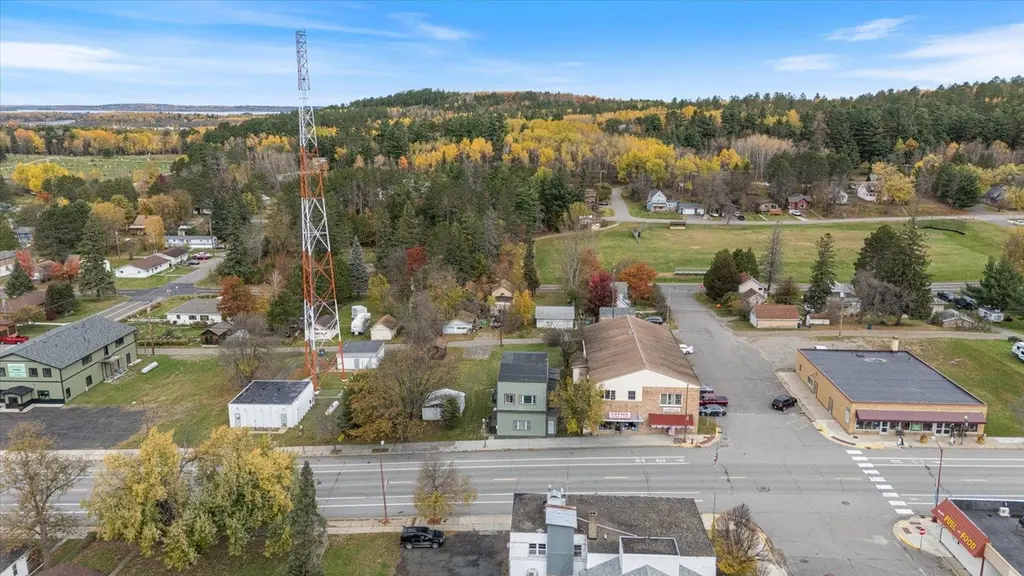
605 Main St · Tower, MN
Flood risk No data
- FEMA flood zone
- —
- Chance of flooding over 30 yrs
- —
- Est. flood insurance / yr
- —
Fire risk No data
- Est. fire insurance / yr
- —
Heat risk No data
- Hot days now (above threshold)
- —
- Hot days in 30 yrs
- —
Wind risk No data
- Chance of severe wind over 30 yrs
- —
Air-quality risk No data
- Unhealthy air days now
- —
- Unhealthy air days in 30 yrs
- —
Risk factors via First Street. Map © Google.
Why this score? — see what drove the B- grade
The composite is a weighted blend of 9 inputs, each scored 0–100. Each bar is that input's sub-score; the figure is the points it added to the 100-point composite (weight × sub-score).
- Cash flow +24.6/30.0
- Appreciation +10.0/10.0
- DSCR +7.9/10.0
- ARV discount +7.5/15.0
- 1% rule +5.0/10.0
- Schools +3.6/10.0
- Livability +3.2/5.0
- Rent growth +2.5/5.0
- Condition / age +2.5/5.0
$329,900
🖨 Deal sheet 📄 Offer letter ✓ Due diligence
Multi-family units
County records classify this as Multi-Family (5+ Unit). Listing-text estimate: 4 units. estimate disagrees with records
5+ unit building — per-unit beds/baths from public records are typically unavailable; the breakdown below (if shown) is an estimate from the listing text.
Listing remarks MLS
Exceptional turn-key 4-plex opportunity in the heart of Tower, MN — just one block from beautiful Lake Vermilion. Whether you’re an investor looking for strong cash flow or a first-time home buyer wanting tenants to help pay the mortgage, this property offers endless potential. The building features four spacious 2-bedroom, 1-bath units with separate electric meters, allowing tenants to pay their own electricity. All units are currently rented at $1,000 per month on flexible month-to-month leases, providing immediate rental income with room for future rent increases. Located in one of northern Minnesota’s premier recreation destinations, this property offers quick access to boating, fishing, snowmobile trails, and ATV trails right outside your door. The historic building has seen updates throughout while still maintaining its character and charm. Additional opportunity available with a neighboring commercial lot that may be purchased together or separately. Live in one unit while the other tenants help offset your mortgage, or add a solid income-producing property to your portfolio in a highly desirable lake community.
Key facts
- Turn-key 4-plex
- Historic building
- Updates throughout
Tags
Neighborhood map
What this means for you Summary
Snapshot
- This is a 4 × 2-bed/1.0-bath units multifamily listed at $330k.
Deal economics
- At list price, monthly cash flow is $681 ($8k/yr) — positive. Per door: $170/mo.
- The deal already cash-flows at list — no discount required.
- Meets the 1% rule at list price ($3k rent vs $330k).
- Recommended offer: $310k (6.0% below list) — sets the bar for market timing.
- Cap rate 8.8% vs local median 0.4% in Tower — top-decile yield for the area; either an underpriced asset or a hidden risk that comps aren't pricing in. Stress-test before assuming the spread holds.
Location & tenants
- Location reads 65/100 on livability (#517 in MN) — a middle-class / working-renter tenant base. Strengths: cost of living A+, housing A+, schools B; Watch: crime C-, employment C-, health & safety D.
- St. Louis County School District (rural): math 34% / reading 49% proficiency, ranked #212 of 301 in MN (top 70%) — families likely to look elsewhere, expect single-tenant / working-renter base with shorter leases.
- Market conditions: 128 active listings in the ZIP; 639 units permitted in St. Louis County in 2024 (338 in 5+ unit buildings).
Forward outlook
- In year one you build about $35k of equity ($2k loan paydown + $33k appreciation (10.0% local appreciation)).
- At projected returns (10.0% appreciation + 3.0% rent growth), your $92k cash investment doubles in ~3 years — after that, you're playing with house money.
- By year 2, paydown + projected appreciation supports a ~$57k cash-out refi (75% LTV) — recoverable capital for the next deal without selling this one.
Negotiation context
- It's been on market 77 days — a 6% lower offer ($310k) is reasonable based on typical stale-listing flexibility.
- 3 sale attempts with the ask held roughly flat each time — persistent listings suggest the price (not the market) is what's stuck; bring a comps-based counter.
- Current owner paid $100k; list at $330k implies a 230% gain — meaningful room to come down on a strong offer.
Questions for the listing agent
- It's been on market 77 days. Have you received any prior offers? Is the seller open to a 6% concession, seller financing, or rate buy-down credit?
- Can we see the unit-by-unit rent roll, current vacancy, and any below-market leases? What's the average tenancy length?
- What capital expenditures (roof, boiler, parking lot, exteriors) have been made in the last 5 years, and what's planned in the next 2?
- Why hasn't it sold? Are there any deal-killer items the seller is aware of (foundation, flood, title, zoning, code violations)?
- Is there a deadline driving the sale (1031 exchange, divorce, estate, relocation)? That informs how much negotiation room exists.
- Schools are B-rated — typically a magnet for longer-tenancy family renters. What's the average tenant stay here, and is there a school-zone premium baked into asking?
- What's the average days-on-market for RENTAL listings here right now (not sales)? A rising rental-DOM trend means longer vacancies and softer asking-rent achievability than the comps imply.
- What's the recent tenant-quality profile in this submarket — average credit score on applications, eviction rate, late-payment / NSF rate, and stable-employment percentage? A property-management company in the area should have these aggregated.
- How much new apartment / multifamily construction is in the pipeline within 1–3 miles? Heavy new supply (>2% of stock underway) typically softens rents 12–24 months out; light construction supports rent growth.
Investment metrics
- 1% rule
- 1.00% ✓
- Cap rate
- 8.77%
- Cash-on-cash
- 8.85%
- DSCR
- 1.39
- GRM
- 8.3
CMA / ARV
No comps found within radius.
Projected returns pro-forma
10.0% appreciation · 3.0% rent growth · sell at horizon
- IRR
- 30.7%
- Equity multiple
- 3.41×
- Total profit
- $222,886
- Equity at exit
- $297,200
- IRR
- 26.6%
- Equity multiple
- 7.73×
- Total profit
- $621,923
- Equity at exit
- $640,923
Cash invested: $92,372 (down + closing). Projections, not guarantees.
Landlord ↔ Tenant lean methodology
- Overall (STATE)
- 46 Balanced
- State Minnesota
- 46 Balanced · D+2
- County
- — inherits STATE
- City
- — inherits STATE
ZIP-level market 55790
- Home prices YoY
- 8.4%
- Active inventory
- 128
- Price-to-rent
- 33.3×
Monthly cashflow live
- Estimated rent
- $3,306 medium interval (Pro) →
- Mortgage (P&I)
- −$1,730
- Tax from tax record
- −$63 /mo · $758/yr
- Insurance
- −$137
- HOA
- −$0
- Vacancy / Maint / Mgmt
- −$694
- Net cashflow
- $681
Break-even live
4-unit breakdown (identical units grouped — click to expand)
| Units | Beds | Baths | Est. rent |
|---|---|---|---|
| 4× units | 2 | 1 | $3,308 |
| #1 | 2 | 1 | $827 |
| #2 | 2 | 1 | $827 |
| #3 | 2 | 1 | $827 |
| #4 | 2 | 1 | $827 |
| Total (4 units) | $3,306 | ||
UW: 25.0% down · 7.5% · 30yr · 1.5% tax · 5.0% vac · 8.0% maint · 8.0% mgmt
Financing live
Cash to close
- Down payment
- $82,475
- Closing costs
- $9,897
- Reserves months
- —
- Total cash needed
- —
Loan-product check · same deal, 3 products live
Conventional
25% down · 7.5% · 30yr
- Down + closing
- —
- Monthly P&I
- —
- Monthly cashflow
- —
- DSCR
- —
- Eligible?
- —
Personal DTI + credit; lowest rate.
DSCR
20% down · 8.5% · 30yr
- Down + closing
- —
- Monthly P&I
- —
- Monthly cashflow
- —
- DSCR
- —
- Eligible?
- —
No personal income docs; deal must DSCR.
Hard money
10% down · 12.0% · 12mo
- Down + closing
- —
- Monthly P&I
- —
- Monthly cashflow
- —
- DSCR
- —
- Eligible?
- —
Short-term bridge; refi at stabilization.
Listing history 21 events
-
2026-06-19days on market $329,900 Active 77 DOM
-
2026-06-18days on market $329,900 Active 76 DOM
-
2026-06-17days on market $329,900 Active 75 DOM
-
2026-06-16days on market $329,900 Active 74 DOM
-
2026-06-15days on market $329,900 Active 73 DOM
-
2026-06-14days on market $329,900 Active 71 DOM
-
2026-06-13days on market $329,900 Active 70 DOM
-
2026-06-10days on market $329,900 Active 68 DOM
-
2026-06-09days on market $329,900 Active 67 DOM
-
2026-06-08days on market $329,900 Active 66 DOM
-
2026-06-07days on market $329,900 Active 65 DOM
-
2026-06-02days on market $329,900 Active 60 DOM
-
2026-06-01days on market $329,900 Active 59 DOM
-
2026-05-31days on market $329,900 Active 58 DOM
-
2026-05-30days on market $329,900 Active 57 DOM
-
2026-04-03$329,900 Active 1158-char remark
Show marketing remark (583 chars)
Turn-key 4-plex in the heart of Tower, MN just one block from Lake Vermilion. Great opportunity for owner-occupants or investors. Property features four 2-bedroom, 1-bath units, all separately metered for electricity with tenants paying electric. Currently rented at $1,000/month per unit on month-to-month leases, providing immediate income with flexibility for future rent adjustments. Strong cash-flow potential. Located in a desirable recreation area with close access to boating, fishing, snowmobile and ATV trails right out your door. Historic building with updates throughout.
-
2026-04-03$329,900 Active 583-char remark
Show marketing remark (583 chars)
Turn-key 4-plex in the heart of Tower, MN just one block from Lake Vermilion. Great opportunity for owner-occupants or investors. Property features four 2-bedroom, 1-bath units, all separately metered for electricity with tenants paying electric. Currently rented at $1,000/month per unit on month-to-month leases, providing immediate income with flexibility for future rent adjustments. Strong cash-flow potential. Located in a desirable recreation area with close access to boating, fishing, snowmobile and ATV trails right out your door. Historic building with updates throughout.
-
2026-02-01historical
-
2025-10-17$349,000 Active
-
2014-05-21soldstatus $100,000
-
2003-06-20soldstatus $130,000
ⓘ Source: listings_history table (triggers on properties + properties_extension) + one-shot
backfill from property_details.listing_events for pre-trigger history.
Tax reassessment forecast MN · Partial reset (capped growth)
- Current annual tax
- $758 · $63/mo
- Projected year-2 tax
- $2,226 · $186/mo
- Expected delta
- +$1,468/yr (+$122/mo · 193.7%)
ⓘ Screening estimate from a state-policy table — verify with the county assessor before closing.
Nearby sold comps map
Loading sold comps map…
Walkable amenities ~0.75 mi
Loading nearby amenities…
Taxation est. · year 1
- Rental income
- $39,672
- − Mortgage interest
- −$18,480
- − Property taxes
- −$758
- − Insurance
- −$1,650
- − Repairs & maintenance
- −$3,174
- − Management
- −$3,174
- − Depreciation
- −$9,597
- Taxable income
- $2,840
- Est. tax owed @ 24.0%
- −$682
- After-tax cash flow
- $7,491/yr
For passive investors: Depreciation is non-cash, so a rental often shows a tax loss while cash-flowing — sheltering income. Rental losses are passive: they offset passive income freely, and up to $25,000/yr can offset ordinary (W-2) income if you actively participate and your MAGI is under $100k (phasing out to $0 by $150k); unused losses carry forward. On sale, claimed depreciation is recaptured at up to 25%, and gains may owe capital-gains tax (a 1031 exchange can defer both). Figures are a year-1 estimate at your 24.0% rate — not tax advice; consult a CPA.
Schools (NCES district)
- District
- St. Louis County School District
- NCES district ID
- 2700008
- Math proficiency
- 34% ▼ -7.00%
- Reading proficiency
- 49% ▼ -6.00%
- Median HH income
- $49,389
- Composite
- 35.63/100
- National rank
- #4886
- State rank
- #212 of 301 in MN
Livability — Tower
- Score
- 65/100
- State rank
- #517
- US rank
- #12482
Category grades
Schools grade is shown separately in the Schools card above.
Census & demographics
- Census place
- Tower, MN
- Population (ZIP)
- 1,933
Population outlook (St. Louis County) Hauer SSP2
- Today (2025)
- 202,411 people
- By 2030
- 203,234 · +0.4%
- By 2040
- 202,520 · +0.1%
- By 2050
- 200,853 · -0.8%
- By 2075
- 200,943 · -0.7%
- By 2100
- 192,058 · -5.1%
Race, ethnicity, and origin ACS 2023
- Neighborhood character
- Predominantly White (80%)
- Race & ethnicity
- White 80% Native American 11% Two or more races 5% Hispanic / Latino 3%
- Common ancestry
- Portuguese 9% Lithuanian 3% Scottish 2%
- Foreign-born
- 1% · Canada
Political lean MEDSL · St. Louis
- 2024 margin
- D (+13.7) · D 55.9% · R 42.2% · Other 1.8%
- 2008→2024 swing
- -18.8pp toward R · 2008: 32.5pp · 2024: 13.7pp
- All cycles
- 2024: D+13.7 2020: D+15.6 2016: D+11.8 2012: D+29.6 2008: D+32.5
Not yet ingested
- Civics
- —
Market trends
- HPI YoY
- ▲ 23.54%
- Current HPI
- 302.84
- Rent YoY
- —
- Metro
- —
- State GDP YoY
- ▲ 2.41%
- F500 in state
- 34
Industry mix (Fortune 500 HQ in MN)
| Industry | F500 HQs | Revenue |
|---|---|---|
| Healthcare | 2 | $407B |
|
||
| Retail | 2 | $150B |
|
||
| Consumer Goods | 2 | $32B |
|
||
| Industrial Machinery | 2 | $6B |
|
||
| Agriculture | 1 | $40B |
|
||
| Healthcare / Medical Devices | 1 | $32B |
|
||
Price history
+153.8% since first listed6 events — show timeline
- 2026-04-03 Listed $329,900 RAOR
- 2026-04-03 Listed $329,900 NORTHSTARMLS as Distributed by MLS Grid
- 2026-02-01 Listing Removed — NORTHSTARMLS as Distributed by MLS Grid
- 2025-10-17 Listed $349,000 NORTHSTARMLS as Distributed by MLS Grid
- 2014-05-21 Sold (Public Records) $100,000 Public Records
- 2003-06-20 Sold (Public Records) $130,000 Public Records
Property tax history
-0.8%/yrLatest (2025): $758 · +6.8% YoY. Source: county tax records.
Cash-flow waterfall
monthlySold comps — $/sqft
last 12 mo · ≤1 miLoading sold comps…