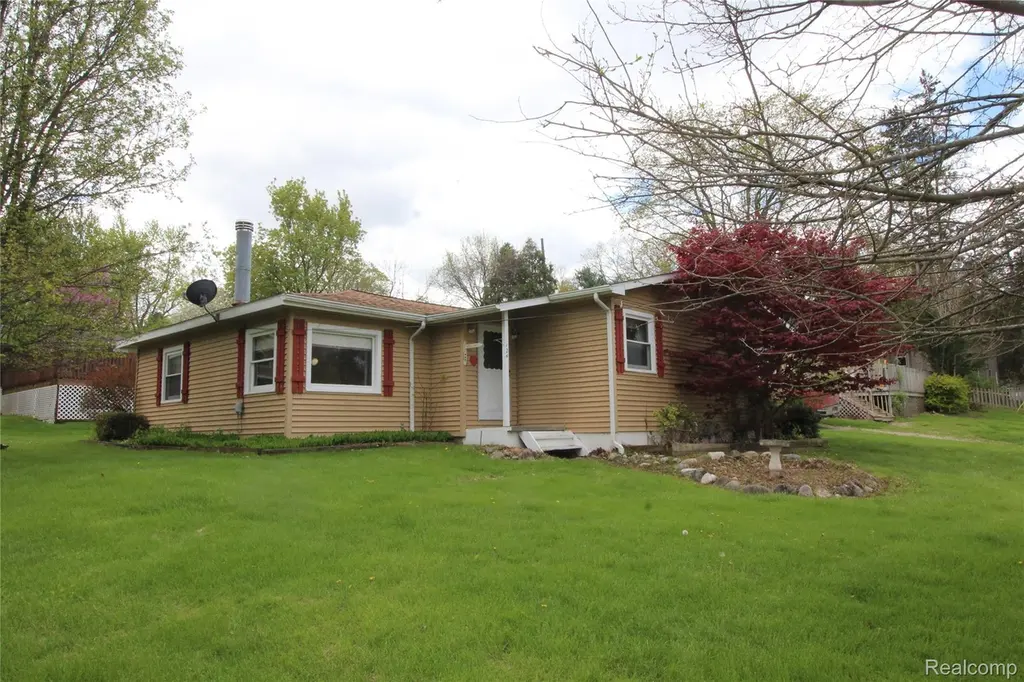
124 E Lafayette St · Milford, MI
Flood risk 1/10 · Minimal
- FEMA flood zone
- X (unshaded)
- Chance of flooding over 30 yrs
- 0.0%
- Est. flood insurance / yr
- $473 – $860
Fire risk 3/10 · Minor
- Est. fire insurance / yr
- $784 – $1,456
Heat risk 2/10 · Minimal
- Hot days now (above 95°F)
- 7 days/yr
- Hot days in 30 yrs
- 15 days/yr
Wind risk 2/10 · Minimal
- Chance of severe wind over 30 yrs
- —
Air-quality risk 2/10 · Minimal
- Unhealthy air days now
- 1 days/yr
- Unhealthy air days in 30 yrs
- 3 days/yr
Risk factors via First Street. Map © Google.
Why this score? — see what drove the C- grade
The composite is a weighted blend of 9 inputs, each scored 0–100. Each bar is that input's sub-score; the figure is the points it added to the 100-point composite (weight × sub-score).
- Cash flow +16.3/30.0
- ARV discount +15.0/15.0
- DSCR +5.0/10.0
- 1% rule +4.9/10.0
- Schools +4.4/10.0
- Livability +4.4/5.0
- Rent growth +2.5/5.0
- Condition / age +2.5/5.0
- Appreciation +0.0/10.0
$180,000
🖨 Deal sheet 📄 Offer letter ✓ Due diligence
Listing remarks MLS
Investors, flippers, builders - and savvy buyers looking to create instant equity - this is an opportunity you don't see often in the highly desirable Village of Milford, part of an estate offering. This former owner occupied home is in need of updating and repairs and presents strong potential for renovation or redevelopment. Please note: MOLD IS BELIEVED TO BE PRESENT IN THE HOME AND IS BEING SOLD STRICTLY AS IS. ENTER AT YOUR OWN RISK. A signed Release and Hold Harmless Agreement (Mold Disclosure and Property Entry) is required for every individual prior to entering the home. All information is deemed reliable but not guaranteed and should be independently verified by Buyer and Buyer's agent.
Key facts
- 0.3 acre lot
- 2 garage spots
- Pool
Property features AI
Exterior
- Parking: Detached 2-car garage
- Utilities: Public water; Septic tank sewage
- Home design: Single-family residence; One level; Ground-level entry; Vinyl siding; Facing direction not specified
- Construction: Asphalt roof; Block foundation
- Exterior features: Above-ground pool; Gravel road access
Interior
- Bathrooms: 2 full bathrooms
- Heating & cooling: Baseboard heating (natural gas); No central air conditioning
- Interior features: Crawl space, unfinished basement; Total of 8 rooms
Neighborhood map
What this means for you Summary
Snapshot
- This is a 3-bed/2.0-bath single-family listed at $180k.
Deal economics
- At list price, monthly cash flow is $98 ($1k/yr) — positive.
- The deal already cash-flows at list — no discount required.
- To meet the 1% rule (rent ≥ 1% of price), the offer needs to be $178k (1.2% below list).
- Recommended offer: $177k (1.5% below list) — sets the bar for market timing.
- Cap rate 6.9% vs local median 2.1% in Milford — top-decile yield for the area; either an underpriced asset or a hidden risk that comps aren't pricing in. Stress-test before assuming the spread holds.
Location & tenants
- Location reads 87/100 on livability (#17 in MI, #275 nationally) — a professional / high-income tenant draw. Strengths: crime A+, amenities A+, employment A+; Watch: commute F.
- Huron Valley Schools (suburban): math 42% / reading 56% proficiency, ranked #87 of 540 in MI (top 16%) — families likely to look elsewhere, expect single-tenant / working-renter base with shorter leases.
- Market conditions: 180 active listings in the ZIP; 2,614 units permitted in Oakland County in 2024 (721 in 5+ unit buildings).
Forward outlook
- Local home prices are declining (-3.0%/yr); year-one equity from $1k of loan paydown is wiped out by about $5k of value loss. Plan a longer hold.
- Oakland County population projected at +10% by 2050 — modest demand growth; plan on rents tracking national, not racing it.
Negotiation context
- It's been on market 24 days — a 2% lower offer ($177k) is reasonable based on typical stale-listing flexibility.
- 2 sale attempts; this cycle's ask has dropped $20k (10%) from the opening price — seller is motivated, your offer sets the floor, not the list.
- Current owner paid $140k; 29% above their basis — modest negotiation headroom, anchor on the comps not their cost.
Risks & watch-outs
- Watch-outs: built in 1935 — expect roof / HVAC / electrical / plumbing capex.
Questions for the listing agent
- Built in 1935 — when were the roof, HVAC, electrical panel, plumbing, and water heater last replaced?
- Is there a deadline driving the sale (1031 exchange, divorce, estate, relocation)? That informs how much negotiation room exists.
- Schools are B-rated — typically a magnet for longer-tenancy family renters. What's the average tenant stay here, and is there a school-zone premium baked into asking?
- What's the average days-on-market for RENTAL listings here right now (not sales)? A rising rental-DOM trend means longer vacancies and softer asking-rent achievability than the comps imply.
- What's the recent tenant-quality profile in this submarket — average credit score on applications, eviction rate, late-payment / NSF rate, and stable-employment percentage? A property-management company in the area should have these aggregated.
- How much new for-sale + rental construction is in the pipeline within 1–3 miles? Heavy new supply typically softens prices + rents 12–24 months out; constrained supply supports both.
Investment metrics
- 1% rule
- 0.99% ✗
- Cap rate
- 6.94%
- Cash-on-cash
- 2.33%
- DSCR
- 1.10
- GRM
- 8.4
CMA / ARV
- ARV (median comp)
- $358,254
- List price
- $180,000
- Delta
- -49.76%
- Verdict
- UNDERPRICED
- Comps
- 20 within 1.0 mi
Show comp detail 12 sales within ~0.75 mi
| Address | Dist | Beds/Ba | Sqft | Sold | Price | $/sf | Match |
|---|---|---|---|---|---|---|---|
| 124 E Lafayette St | 0.00mi | 4/2.0 (+1) | 1,527 (0%) | 0mo | $140,000 | $92 | 95 |
| 519 S Main St | 0.04mi | 3/2.0 | 1,472 (-4%) | 5mo | $389,900 | $265 | 88 |
| 119 2nd St | 0.03mi | 3/2.0 | 1,314 (-14%) | 8mo | $325,000 | $247 | 68 |
| 531 Atlantic St | 0.44mi | 3/1.0 | 1,585 (+4%) | 3mo | $340,000 | $215 | 67 |
| 124 Oakland St | 0.07mi | 3/2.0 | 1,745 (+14%) | 7mo | $450,000 | $258 | 67 |
| 344 Bennett St | 0.70mi | 3/2.0 | 1,535 (+0%) | 11mo | $389,000 | $253 | 57 |
| 323 Franklin St | 0.41mi | 3/1.0 | 1,334 (-13%) | 1mo | $337,000 | $253 | 55 |
| 1202 Garden Rd | 0.61mi | 3/2.5 | 1,666 (+9%) | 4mo | $450,000 | $270 | 51 |
| 226 Hickory St | 0.46mi | 4/2.0 (+1) | 1,740 (+14%) | 2mo | $505,000 | $290 | 49 |
| 999 Byron Dr | 0.33mi | 3/1.5 | 1,308 (-14%) | 12mo | $335,000 | $256 | 48 |
| 316 Crystal St | 0.74mi | 3/2.0 | 1,610 (+5%) | 15mo | $350,000 | $217 | 44 |
| 220 Crystal St | 0.71mi | 3/2.0 | 1,729 (+13%) | 13mo | $450,000 | $260 | 34 |
Match score weights: distance 35% · size 25% · config 20% · recency 20%. Top-matched comps best support the ARV.
Projected returns pro-forma
-3.0% appreciation · 3.0% rent growth · sell at horizon
- IRR
- -12.6%
- Equity multiple
- 0.55×
- Total profit
- $-22,879
- Equity at exit
- $26,839
- IRR
- -3.5%
- Equity multiple
- 0.77×
- Total profit
- $-11,643
- Equity at exit
- $15,563
Cash invested: $50,400 (down + closing). Projections, not guarantees.
Landlord ↔ Tenant lean methodology
- Overall (STATE)
- 62 Landlord-Friendly
- State Michigan
- 62 Landlord-Friendly · EVEN
- County
- — inherits STATE
- City
- — inherits STATE
ZIP-level market 48381
- Active inventory
- 180
- Price-to-rent
- 8.4×
Monthly cashflow live
- Estimated rent
- $1,779 medium interval (Pro) →
- Mortgage (P&I)
- −$944
- Tax from tax record
- −$288 /mo · $3,461/yr
- Insurance
- −$75
- HOA
- −$0
- Vacancy / Maint / Mgmt
- −$374
- Net cashflow
- $98
Break-even live
UW: 25.0% down · 7.5% · 30yr · 1.5% tax · 5.0% vac · 8.0% maint · 8.0% mgmt
Financing live
Cash to close
- Down payment
- $45,000
- Closing costs
- $5,400
- Reserves months
- —
- Total cash needed
- —
Loan-product check · same deal, 3 products live
Conventional
25% down · 7.5% · 30yr
- Down + closing
- —
- Monthly P&I
- —
- Monthly cashflow
- —
- DSCR
- —
- Eligible?
- —
Personal DTI + credit; lowest rate.
DSCR
20% down · 8.5% · 30yr
- Down + closing
- —
- Monthly P&I
- —
- Monthly cashflow
- —
- DSCR
- —
- Eligible?
- —
No personal income docs; deal must DSCR.
Hard money
10% down · 12.0% · 12mo
- Down + closing
- —
- Monthly P&I
- —
- Monthly cashflow
- —
- DSCR
- —
- Eligible?
- —
Short-term bridge; refi at stabilization.
Listing history 2 events
-
2026-05-02$199,900 Active 724-char remark
Show marketing remark (704 chars)
Investors, flippers, builders - and savvy buyers looking to create instant equity - this is an opportunity you don't see often in the highly desirable Village of Milford, part of an estate offering. This former owner occupied home is in need of updating and repairs and presents strong potential for renovation or redevelopment. Please note: MOLD IS BELIEVED TO BE PRESENT IN THE HOME AND IS BEING SOLD STRICTLY AS IS. ENTER AT YOUR OWN RISK. A signed Release and Hold Harmless Agreement (Mold Disclosure and Property Entry) is required for every individual prior to entering the home. All information is deemed reliable but not guaranteed and should be independently verified by Buyer and Buyer's agent.
-
2026-05-02$199,900 Active 704-char remark
Show marketing remark (704 chars)
Investors, flippers, builders - and savvy buyers looking to create instant equity - this is an opportunity you don't see often in the highly desirable Village of Milford, part of an estate offering. This former owner occupied home is in need of updating and repairs and presents strong potential for renovation or redevelopment. Please note: MOLD IS BELIEVED TO BE PRESENT IN THE HOME AND IS BEING SOLD STRICTLY AS IS. ENTER AT YOUR OWN RISK. A signed Release and Hold Harmless Agreement (Mold Disclosure and Property Entry) is required for every individual prior to entering the home. All information is deemed reliable but not guaranteed and should be independently verified by Buyer and Buyer's agent.
ⓘ Source: listings_history table (triggers on properties + properties_extension) + one-shot
backfill from property_details.listing_events for pre-trigger history.
Tax reassessment forecast MI · Partial reset (capped growth)
- Current annual tax
- $3,461 · $288/mo
- Projected year-2 tax
- $3,461 · $288/mo
- Expected delta
- $0/yr ($0/mo · 0.0%)
ⓘ Screening estimate from a state-policy table — verify with the county assessor before closing.
Climate risk First Street
- Flood 1/10 Low FEMA zone X (unshaded) · 0% chance over 30 yrs
- Wildfire 3/10 Moderate
- Heat 2/10 Low 7 d/yr ≥95°F today · 15 d/yr by 30 yrs out
- Wind 2/10 Low
- Air quality 2/10 Low 1 unhealthy d/yr today · 3 by 30 yrs out
Nearby sold comps map
Loading sold comps map…
Walkable amenities ~0.75 mi
Loading nearby amenities…
Taxation est. · year 1
- Rental income
- $21,343
- − Mortgage interest
- −$10,083
- − Property taxes
- −$3,461
- − Insurance
- −$900
- − Repairs & maintenance
- −$1,707
- − Management
- −$1,707
- − Depreciation
- −$5,236
- Taxable loss
- −$1,752
- Est. tax savings @ 24.0%
- +$421
- After-tax cash flow
- $1,593/yr
For passive investors: Depreciation is non-cash, so a rental often shows a tax loss while cash-flowing — sheltering income. Rental losses are passive: they offset passive income freely, and up to $25,000/yr can offset ordinary (W-2) income if you actively participate and your MAGI is under $100k (phasing out to $0 by $150k); unused losses carry forward. On sale, claimed depreciation is recaptured at up to 25%, and gains may owe capital-gains tax (a 1031 exchange can defer both). Figures are a year-1 estimate at your 24.0% rate — not tax advice; consult a CPA.
Schools (NCES district)
- District
- Huron Valley Schools
- NCES district ID
- 2618990
- Math proficiency
- 42% ▼ -8.00%
- Reading proficiency
- 56% ▼ -3.00%
- Median HH income
- $76,011
- Composite
- 44.39/100
- National rank
- #2815
- State rank
- #87 of 540 in MI
Livability — Milford
- Score
- 87/100
- State rank
- #17
- US rank
- #275
Category grades
Schools grade is shown separately in the Schools card above.
Census & demographics
- Census place
- Milford, MI
- Population (ZIP)
- 13,737
Population outlook (Oakland County) Hauer SSP2
- Today (2025)
- 1,335,747 people
- By 2030
- 1,375,100 · +2.9%
- By 2040
- 1,435,385 · +7.5%
- By 2050
- 1,469,250 · +10.0%
- By 2075
- 1,531,946 · +14.7%
- By 2100
- 1,450,485 · +8.6%
Race, ethnicity, and origin ACS 2023
- Neighborhood character
- Predominantly White (89%)
- Race & ethnicity
- White 89% Two or more races 7% Hispanic / Latino 4% Asian 1%
- Common ancestry
- Romanian 11% Iranian 4% Slovak 3%
- Foreign-born
- 3% · Canada, China
- Languages at home
- 96% English-only · Other Indo-European 1% Spanish 1% German/W. Germanic 1%
Political lean MEDSL · Oakland
- 2024 margin
- D (+10.6) · D 54.4% · R 43.8% · Other 1.9%
- 2008→2024 swing
- -3.9pp toward R · 2008: 14.5pp · 2024: 10.6pp
- All cycles
- 2024: D+10.6 2020: D+14.1 2016: D+8.1 2012: D+8.1 2008: D+14.5
Not yet ingested
- Civics
- —
Market trends
- HPI YoY
- ▼ -303.22%
- Current HPI
- 200.4953
- Rent YoY
- —
- Metro
- —
- State GDP YoY
- ▲ 1.37%
- F500 in state
- 28
Industry mix (Fortune 500 HQ in MI)
| Industry | F500 HQs | Revenue |
|---|---|---|
| Automotive Parts | 3 | $48B |
|
||
| Automotive | 2 | $372B |
|
||
| Chemicals | 1 | $45B |
|
||
| Automotive Retail | 1 | $29B |
|
||
| Healthcare / Medical Devices | 1 | $23B |
|
||
| Automotive Technology | 1 | $20B |
|
||
Price history
-30.0% since first listed8 events — show timeline
- 2026-06-08 Sold (MLS) $140,000 REALCOMP
- 2026-06-08 Sold (MLS) $140,000 MiRealSource-MiMLS
- 2026-05-26 Pending — MiRealSource-MiMLS
- 2026-05-26 Pending — REALCOMP
- 2026-05-21 Price Changed $180,000 MiRealSource-MiMLS
- 2026-05-21 Price Changed $180,000 REALCOMP
- 2026-05-02 Listed $199,900 REALCOMP
- 2026-05-02 Listed $199,900 MiRealSource-MiMLS
Property tax history
+2.4%/yrLatest (2025): $3,461 · +2.7% YoY. Source: county tax records.
Cash-flow waterfall
monthlySold comps — $/sqft
last 12 mo · ≤1 miLoading sold comps…