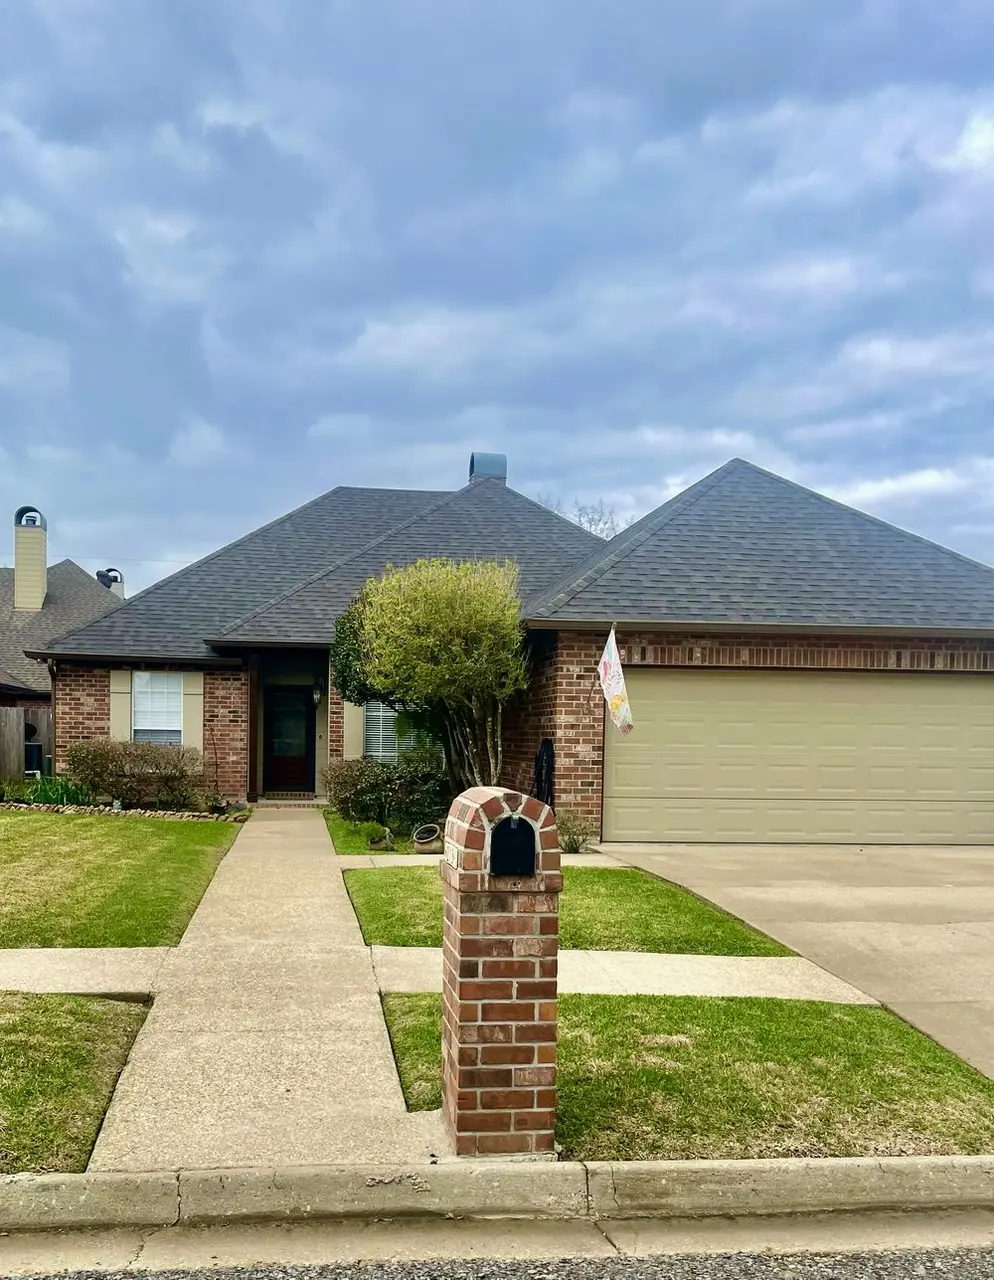
203 Commons Dr · Lafayette, LA
Flood risk 1/10 · Minimal
- FEMA flood zone
- X (unshaded)
- Chance of flooding over 30 yrs
- 0.0%
- Est. flood insurance / yr
- $507 – $1,088
Fire risk 1/10 · Minimal
- Est. fire insurance / yr
- $1,269 – $2,357
Heat risk 9/10 · Severe
- Hot days now (above 109°F)
- 7 days/yr
- Hot days in 30 yrs
- 21 days/yr
Wind risk 9/10 · Severe
- Chance of severe wind over 30 yrs
- 99.0%
Air-quality risk 2/10 · Minimal
- Unhealthy air days now
- 0 days/yr
- Unhealthy air days in 30 yrs
- 1 days/yr
Risk factors via First Street. Map © Google.
Why this score? — see what drove the D- grade
The composite is a weighted blend of 9 inputs, each scored 0–100. Each bar is that input's sub-score; the figure is the points it added to the 100-point composite (weight × sub-score).
- Cash flow +12.6/30.0
- ARV discount +7.7/15.0
- DSCR +3.8/10.0
- Schools +3.6/10.0
- Livability +3.5/5.0
- 1% rule +2.9/10.0
- Rent growth +2.8/5.0
- Condition / age +2.5/5.0
- Appreciation +0.0/10.0
$270,000
🖨 Deal sheet 📄 Offer letter ✓ Due diligence
Listing remarks
READY TO SALE This home is not in a flood zone. Please view on-line for many more photos. Open living/dining area with high ceilings, large crown moldings, wood floors, and fireplace. Kitchen/Breakfast area have vaulted ceilings, lots of cabinets, granite countertops, travertine floors. Master suite has tray ceilings, wood floors, and 2 large walk in closets. Master bath has dual vanities, large soaker tub, and separate shower. Granite in both bathrooms. Large laundry room with sink and plenty of extra storage. Double car garage with storage room. Landscaped yard with sprinkler system. Roof changed in 2023 A/C changed in 2021. Home is in like new condition. Non smokers. Located in quiet cal
Key facts
- Master suite
- Quiet cal-de-sac
- Large laundry room
Tags
Neighborhood map
What this means for you Summary
Snapshot
- This is a 3-bed/2.0-bath single-family listed at $270k.
Deal economics
- At list price, monthly cash flow is $-33 ($-401/yr) — negative.
- To cash-flow at today's rent, offer at most $264k (2.2% below list).
- To meet the 1% rule (rent ≥ 1% of price), the offer needs to be $214k (20.7% below list).
- Recommended offer: $214k (20.7% below list) — sets the bar for 1% rule.
- Cap rate 6.1% vs local median 4.7% in Lafayette — top-decile yield for the area; either an underpriced asset or a hidden risk that comps aren't pricing in. Stress-test before assuming the spread holds.
Location & tenants
- Location reads 70/100 on livability (#63 in LA) — a middle-class / working-renter tenant base. Strengths: cost of living A+, housing A+, health & safety A+; Watch: amenities C-, employment C-, crime F.
- Lafayette Parish (urban): math 38% / reading 46% proficiency, ranked #19 of 98 in LA (top 19%) — families likely to look elsewhere, expect single-tenant / working-renter base with shorter leases.
- Market conditions: Rents rising (+1.2%/yr); 464 active listings in the ZIP; 4 comparable units currently listed for rent nearby; rentals lingering (median 44d on market — plan ~5-8 weeks vacancy on turnover, expect pricing pressure); 75% of comp listings sitting > 30 days — soft ceiling on asking rent; solid renter incomes; 1,585 units permitted in Lafayette Parish in 2024 (10 in 5+ unit buildings).
Forward outlook
- Local home prices are declining (-3.0%/yr); year-one equity from $2k of loan paydown is wiped out by about $8k of value loss. Plan a longer hold.
- Lafayette County population projected at +34% by 2050 — long-run rental-demand tailwind backs the buy-and-hold thesis.
Negotiation context
- Only 9 days on market — expect competitive offers; lowballing is unlikely to land.
- 4 sale attempts since 28y ago with the ask held roughly flat each time — persistent listings suggest the price (not the market) is what's stuck; bring a comps-based counter.
- Current owner paid $220k; 23% above their basis — modest negotiation headroom, anchor on the comps not their cost.
Risks & watch-outs
- Climate carrying-cost: severe wind risk, 99% chance of damaging wind over 30y; extreme-heat days projected 7→21/yr by 2055 (HVAC capex compounding) — expect insurance premiums to compound above CPI over the hold.
Questions for the listing agent
- What do current leases actually rent for vs. the listed asking? Can we see a recent rent roll and the last 12 months of T-12 income?
- Is there a deadline driving the sale (1031 exchange, divorce, estate, relocation)? That informs how much negotiation room exists.
- Schools are B-rated — typically a magnet for longer-tenancy family renters. What's the average tenant stay here, and is there a school-zone premium baked into asking?
- Crime grade is F in this area — have there been break-ins, vandalism, or insurance claims at this property in the last 3 years? What carrier currently insures it and at what premium?
- The area grade is low — what's the realistic commute time and amenity access for the typical tenant pool here? Any planned neighborhood developments (good or bad) we should know about?
- What's the average days-on-market for RENTAL listings here right now (not sales)? A rising rental-DOM trend means longer vacancies and softer asking-rent achievability than the comps imply.
- What's the recent tenant-quality profile in this submarket — average credit score on applications, eviction rate, late-payment / NSF rate, and stable-employment percentage? A property-management company in the area should have these aggregated.
- How much new for-sale + rental construction is in the pipeline within 1–3 miles? Heavy new supply typically softens prices + rents 12–24 months out; constrained supply supports both.
Investment metrics
- 1% rule
- 0.79% ✗
- Cap rate
- 6.14%
- Cash-on-cash
- -0.53%
- DSCR
- 0.98
- GRM
- 10.5
CMA / ARV
- ARV (median comp)
- $271,283
- List price
- $270,000
- Delta
- -0.47%
- Verdict
- FAIR
- Comps
- 20 within 1.0 mi
Show comp detail 10 sales within ~0.75 mi
| Address | Dist | Beds/Ba | Sqft | Sold | Price | $/sf | Match |
|---|---|---|---|---|---|---|---|
| 219 Rosemary Pl | 0.29mi | 3/2.0 | 1,710 (-5%) | 1mo | $235,000 | $137 | 77 |
| 100 Lacebark Dr | 0.17mi | 3/2.5 | 1,940 (+8%) | 2mo | $269,900 | $139 | 76 |
| 313 Rosemary Pl | 0.15mi | 3/2.0 | 1,642 (-9%) | 11mo | $233,000 | $142 | 69 |
| 106 Brookview Pl | 0.09mi | 3/2.0 | 1,642 (-9%) | 14mo | $240,000 | $146 | 69 |
| 224 Rosemary Pl | 0.26mi | 3/2.0 | 1,690 (-6%) | 13mo | $245,000 | $145 | 67 |
| 1208 S Hugh Wallis Rd | 0.30mi | 4/2.0 (+1) | 1,900 (+5%) | 10mo | $195,000 | $103 | 64 |
| 202 Shady Ridge Dr | 0.08mi | 4/2.0 (+1) | 1,906 (+6%) | 22mo | $268,000 | $141 | 63 |
| 551 Esplanade Dr | 0.52mi | 2/2.0 (-1) | 1,829 (+1%) | 6mo | $253,000 | $138 | 63 |
| 223 Rosemary Pl | 0.27mi | 3/2.0 | 1,720 (-5%) | 22mo | $258,000 | $150 | 61 |
| 207 Rosemary Pl | 0.34mi | 3/2.0 | 1,729 (-4%) | 24mo | $250,000 | $145 | 58 |
Match score weights: distance 35% · size 25% · config 20% · recency 20%. Top-matched comps best support the ARV.
Projected returns pro-forma
-3.0% appreciation · 1.23% rent growth · sell at horizon
- IRR
- -19.0%
- Equity multiple
- 0.34×
- Total profit
- $-49,678
- Equity at exit
- $40,258
- IRR
- -15.4%
- Equity multiple
- 0.19×
- Total profit
- $-61,053
- Equity at exit
- $23,345
Cash invested: $75,600 (down + closing). Projections, not guarantees.
Landlord ↔ Tenant lean methodology
- Overall (STATE)
- 90 Strongly Landlord-Friendly
- State Louisiana
- 90 Strongly Landlord-Friendly · R+12
- County
- — inherits STATE
- City
- — inherits STATE
ZIP-level market 70508
- Home prices YoY
- -34.7%
- Rents YoY
- 1.2%
- Active inventory
- 464
- Price-to-rent
- 10.5×
Monthly cashflow live
- Estimated rent
- $2,140 medium interval (Pro) →
- Mortgage (P&I)
- −$1,416
- Tax from tax record
- −$196 /mo · $2,351/yr
- Insurance
- −$112
- HOA
- −$0
- Vacancy / Maint / Mgmt
- −$449
- Net cashflow
- $-33
Break-even live
UW: 25.0% down · 7.5% · 30yr · 1.5% tax · 5.0% vac · 8.0% maint · 8.0% mgmt
Financing live
Cash to close
- Down payment
- $67,500
- Closing costs
- $8,100
- Reserves months
- —
- Total cash needed
- —
Loan-product check · same deal, 3 products live
Conventional
25% down · 7.5% · 30yr
- Down + closing
- —
- Monthly P&I
- —
- Monthly cashflow
- —
- DSCR
- —
- Eligible?
- —
Personal DTI + credit; lowest rate.
DSCR
20% down · 8.5% · 30yr
- Down + closing
- —
- Monthly P&I
- —
- Monthly cashflow
- —
- DSCR
- —
- Eligible?
- —
No personal income docs; deal must DSCR.
Hard money
10% down · 12.0% · 12mo
- Down + closing
- —
- Monthly P&I
- —
- Monthly cashflow
- —
- DSCR
- —
- Eligible?
- —
Short-term bridge; refi at stabilization.
Rent comps 4 comps
| Address | Beds | Baths | Sqft | Rent | $/sqft | DOM | Units | Dist |
|---|---|---|---|---|---|---|---|---|
| 131 Fanny St Lafayette, LA | 3.0 | 2.0 | 1906 | $2,200 | $1.15 | 43d | 1 | 1.19mi |
| 502 Highland Oaks Ln Unit A Lafayette, LA | 3.0 | 2.5 | 1500 | $2,750 | $1.83 | 43d | 1 | 1.29mi |
| 404 Highland Oaks Ln Lafayette, LA | 2.0 | 2.5 | 1387 | $1,895 | $1.37 | 43d | 1 | 1.29mi |
| 418 Marguerite Blvd Lafayette, LA | 3.0 | 2.0 | 2107 | $2,400 | $1.14 | 21d | 1 | 1.35mi |
Listing history 23 events
-
2026-06-18days on market $270,000 Active 9 DOM
-
2026-06-17days on market $270,000 Active 8 DOM
-
2026-06-16days on market $270,000 Active 7 DOM
-
2026-06-15days on market $270,000 Active 6 DOM
-
2026-06-14days on market $270,000 Active 4 DOM
-
2026-06-13days on market $270,000 Active 3 DOM
-
2026-06-10days on market $270,000 Active 1 DOM
-
2026-06-09days on market $270,000 Active 83 DOM
-
2026-06-08days on market $270,000 Active 82 DOM
-
2026-06-07days on market $270,000 Active 81 DOM
-
2026-06-05pricedays on market $270,000 Active 78 DOM
-
2026-06-03days on market $300,000 Active 77 DOM
-
2026-06-02days on market $300,000 Active 76 DOM
-
2026-06-01days on market $300,000 Active 75 DOM
-
2026-05-31days on market $300,000 Active 74 DOM
-
2026-05-30days on market $300,000 Active 73 DOM
-
2026-03-18$300,000 Active 726-char remark
-
2015-09-19$237,000
-
2014-12-08soldstatus $220,000
-
1999-10-15soldstatus $144,800
-
1998-10-24$142,500
-
1998-10-19soldstatus $21,200
-
1998-03-20$21,200
ⓘ Source: listings_history table (triggers on properties + properties_extension) + one-shot
backfill from property_details.listing_events for pre-trigger history.
Tax reassessment forecast LA · Resets to sale price
- Current annual tax
- $2,351 · $196/mo
- Projected year-2 tax
- $2,351 · $196/mo
- Expected delta
- $0/yr ($0/mo · 0.0%)
ⓘ Screening estimate from a state-policy table — verify with the county assessor before closing.
Climate risk First Street
- Flood 1/10 Low FEMA zone X (unshaded) · 0% chance over 30 yrs
- Wildfire 1/10 Low
- Heat 9/10 Extreme 7 d/yr ≥109°F today · 21 d/yr by 30 yrs out
- Wind 9/10 Extreme 99% chance of damaging wind over 30 yrs
- Air quality 2/10 Low 0 unhealthy d/yr today · 1 by 30 yrs out
Nearby sold comps map
Loading sold comps map…
Walkable amenities ~0.75 mi
Loading nearby amenities…
Taxation est. · year 1
- Rental income
- $25,685
- − Mortgage interest
- −$15,124
- − Property taxes
- −$2,351
- − Insurance
- −$1,350
- − Repairs & maintenance
- −$2,055
- − Management
- −$2,055
- − Depreciation
- −$7,855
- Taxable loss
- −$5,104
- Est. tax savings @ 24.0%
- +$1,225
- After-tax cash flow
- $824/yr
For passive investors: Depreciation is non-cash, so a rental often shows a tax loss while cash-flowing — sheltering income. Rental losses are passive: they offset passive income freely, and up to $25,000/yr can offset ordinary (W-2) income if you actively participate and your MAGI is under $100k (phasing out to $0 by $150k); unused losses carry forward. On sale, claimed depreciation is recaptured at up to 25%, and gains may owe capital-gains tax (a 1031 exchange can defer both). Figures are a year-1 estimate at your 24.0% rate — not tax advice; consult a CPA.
Schools (NCES district)
- District
- Lafayette Parish
- NCES district ID
- 2200870
- Math proficiency
- 38% ▼ -32.00%
- Reading proficiency
- 46% ▼ -24.00%
- Median HH income
- $50,238
- Composite
- 36.15/100
- National rank
- #4741
- State rank
- #19 of 98 in LA
Livability — Lafayette
- Score
- 70/100
- State rank
- #63
- US rank
- #8133
Category grades
Schools grade is shown separately in the Schools card above.
Census & demographics
- Census place
- Lafayette, LA
- County
- Lafayette Parish · 207,544 people
- City population
- 158,114
- Metro
- Lafayette, LA
- Population (ZIP)
- 40,592
- Household income
- $86,005
- Rent vs Own
- Severe rent burden
- 1860.0
Population outlook (Lafayette County) Hauer SSP2
- Today (2025)
- 280,930 people
- By 2030
- 301,092 · +7.2%
- By 2040
- 339,456 · +20.8%
- By 2050
- 375,156 · +33.5%
- By 2075
- 451,672 · +60.8%
- By 2100
- 497,203 · +77.0%
Race, ethnicity, and origin ACS 2023
- Neighborhood character
- Predominantly White (75%)
- Race & ethnicity
- White 75% Black 13% Two or more races 7% Hispanic / Latino 5% Asian 3%
- Common ancestry
- Lithuanian 20% Slovak 2% Italian 1%
- Foreign-born
- 5% · Canada, China
- Languages at home
- 91% English-only · Spanish 3% French/Haitian/Cajun 2% Other Indo-European 1%
Political lean MEDSL · Lafayette
- 2024 margin
- Solid R (+31.4) · D 33.5% · R 64.8% · Other 1.7%
- 2008→2024 swing
- -0.1pp no change · 2008: -31.3pp · 2024: -31.4pp
- All cycles
- 2024: R+31.4 2020: R+28.7 2016: R+33.6 2012: R+33.7 2008: R+31.3
Not yet ingested
- Civics
- —
Market trends
- HPI YoY
- ▼ -76.28%
- Current HPI
- 143.6305
- Rent YoY
- ▲ 1.23%
- Metro
- Lafayette, LA
- State GDP YoY
- ▲ 3.29%
- F500 in state
- 10
Industry mix (Fortune 500 HQ in LA)
| Industry | F500 HQs | Revenue |
|---|---|---|
| Telecommunications | 2 | $23B |
|
||
| Utilities | 1 | $12B |
|
||
| Wholesale / Distribution | 1 | $5B |
|
||
| Advertising | 1 | $2B |
|
||
Price history
+1173.6% since first listed7 events — show timeline
- 2026-06-09 Listed $270,000 FSBO.com
- 2015-09-19 Listed $237,000 AcadianaMLS
- 2014-12-08 Sold (Public Records) $220,000 Public Records
- 1999-10-15 Sold (MLS) $144,800 AcadianaMLS
- 1998-10-24 Listed $142,500 AcadianaMLS
- 1998-10-19 Sold (MLS) $21,200 AcadianaMLS
- 1998-03-20 Listed $21,200 AcadianaMLS
Property tax history
+6.2%/yrLatest (2025): $2,351 · -1.1% YoY. Source: county tax records.
Cash-flow waterfall
monthlySold comps — $/sqft
last 12 mo · ≤1 miLoading sold comps…