 Triplex
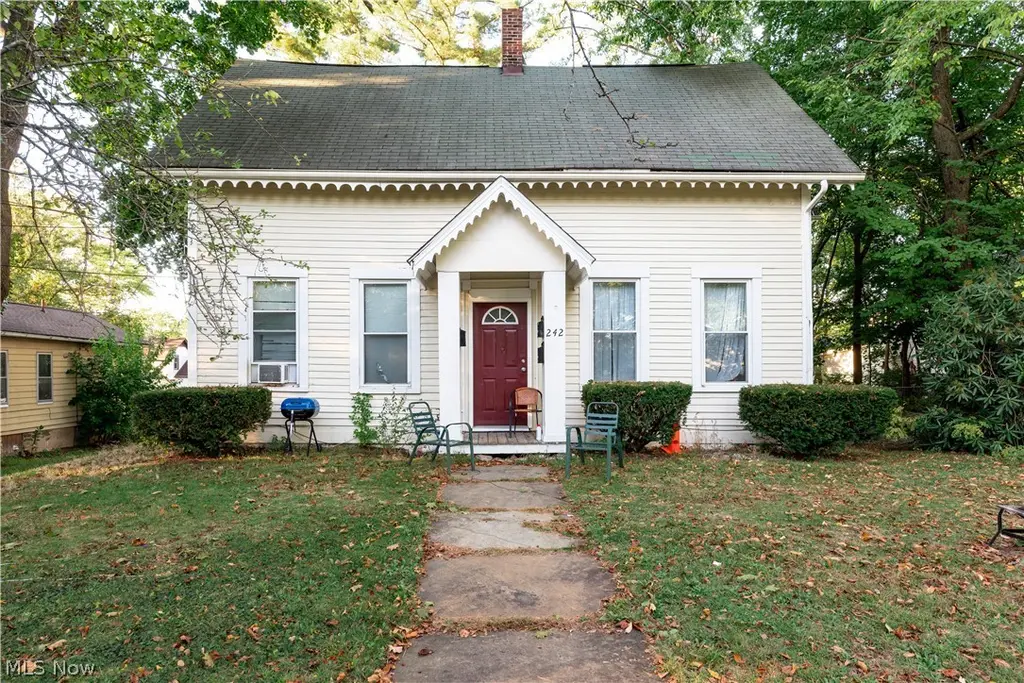
242 W Highland Ave · Ravenna, OH
Flood risk 1/10 · Minimal
- FEMA flood zone
- X (unshaded)
- Chance of flooding over 30 yrs
- 0.0%
- Est. flood insurance / yr
- $473 – $860
Fire risk 1/10 · Minimal
- Est. fire insurance / yr
- $713 – $1,323
Heat risk 3/10 · Minor
- Hot days now (above 96°F)
- 7 days/yr
- Hot days in 30 yrs
- 17 days/yr
Wind risk 1/10 · Minimal
- Chance of severe wind over 30 yrs
- —
Air-quality risk 3/10 · Minor
- Unhealthy air days now
- 2 days/yr
- Unhealthy air days in 30 yrs
- 5 days/yr
Risk factors via First Street. Map © Google.
Why this score? — see what drove the B- grade
The composite is a weighted blend of 9 inputs, each scored 0–100. Each bar is that input's sub-score; the figure is the points it added to the 100-point composite (weight × sub-score).
- Cash flow +30.0/30.0
- DSCR +10.0/10.0
- 1% rule +8.6/10.0
- ARV discount +7.5/15.0
- Livability +3.7/5.0
- Schools +3.0/10.0
- Rent growth +2.5/5.0
- Condition / age +2.5/5.0
- Appreciation +0.0/10.0
$220,000
🖨 Deal sheet 📄 Offer letter ✓ Due diligence
Multi-family units
County records classify this as Multi-Family (2-4 Unit). Listing-text estimate: 3 units. confirmed
Listing remarks MLS
Attention investors! Wonderful three unit building priced to sell. Great investment opportunity does need some TLC. Can be purchased as a package deal with mls # 1383053(1233 Overbrook a duplex in Kent), will look at offers on package deal.
Key facts
- Solid rental history
- 0.28 acre lot
- Built 1890
Tags
Property features AI
Finance
- Financial info: Gross income reported as $2,500; Owner pays sewer, trash collection, and water; Tenant pays cable TV, electricity, and gas
Exterior
- Parking: No garage
- Utilities: Public water; Public sewer
- Home design: 2-story building; Above-grade finished living area approximately 2,571
- Construction: Wood siding; Asphalt roof; Built per public records
- Exterior features: Gravel and off-street parking areas; Parking lot
Interior
- Bathrooms: 3 full bathrooms
- Heating & cooling: Forced air heating (gas)
- Interior features: 12 total rooms; Basement with exterior entry (unfinished)
Neighborhood map
What this means for you Summary
Snapshot
- This is a 1×3bd/1.0ba + 2×1bd/1.0ba units multifamily listed at $220k.
Deal economics
- At list price, monthly cash flow is $960 ($12k/yr) — positive. Per door: $320/mo.
- The deal already cash-flows at list — no discount required.
- Meets the 1% rule at list price ($3k rent vs $220k).
- Recommended offer: $217k (1.5% below list) — sets the bar for market timing.
- Cap rate 11.5% vs local median 3.0% in Ravenna — top-decile yield for the area; either an underpriced asset or a hidden risk that comps aren't pricing in. Stress-test before assuming the spread holds.
Location & tenants
- Location reads 73/100 on livability (#323 in OH) — a middle-class / working-renter tenant base. Strengths: cost of living A+, health & safety A+, housing A-; Watch: amenities F, commute F, employment F.
- Ravenna City (suburban): math 31% / reading 41% proficiency, ranked #559 of 656 in OH (top 85%) — families likely to look elsewhere, expect single-tenant / working-renter base with shorter leases.
- Market conditions: 159 active listings in the ZIP; 196 units permitted in Portage County in 2024 (10 in 5+ unit buildings).
- At $2,996/mo this rent would consume 55% of the median local household income ($65k/yr) (locally 1468% of renters already pay >50% of income on rent) — very limited rent-growth headroom before tenants either downsize or default.
Forward outlook
- Local home prices are declining (-3.0%/yr); year-one equity from $2k of loan paydown is wiped out by about $7k of value loss. Plan a longer hold.
- At projected returns (-3.0% appreciation + 3.0% rent growth), your $62k cash investment doubles in ~7 years — after that, you're playing with house money.
Negotiation context
- It's been on market 22 days — a 2% lower offer ($217k) is reasonable based on typical stale-listing flexibility.
- 4 sale attempts since 21y ago with the ask held roughly flat each time — persistent listings suggest the price (not the market) is what's stuck; bring a comps-based counter.
- Current owner paid $84k; list at $220k implies a 162% gain — meaningful room to come down on a strong offer.
Risks & watch-outs
- Watch-outs: built in 1890 — expect roof / HVAC / electrical / plumbing capex.
Questions for the listing agent
- Can we see the unit-by-unit rent roll, current vacancy, and any below-market leases? What's the average tenancy length?
- What capital expenditures (roof, boiler, parking lot, exteriors) have been made in the last 5 years, and what's planned in the next 2?
- Built in 1890 — when were the roof, HVAC, electrical panel, plumbing, and water heater last replaced?
- Is there a deadline driving the sale (1031 exchange, divorce, estate, relocation)? That informs how much negotiation room exists.
- What's the average days-on-market for RENTAL listings here right now (not sales)? A rising rental-DOM trend means longer vacancies and softer asking-rent achievability than the comps imply.
- What's the recent tenant-quality profile in this submarket — average credit score on applications, eviction rate, late-payment / NSF rate, and stable-employment percentage? A property-management company in the area should have these aggregated.
- How much new apartment / multifamily construction is in the pipeline within 1–3 miles? Heavy new supply (>2% of stock underway) typically softens rents 12–24 months out; light construction supports rent growth.
Investment metrics
- 1% rule
- 1.36% ✓
- Cap rate
- 11.53%
- Cash-on-cash
- 18.70%
- DSCR
- 1.83
- GRM
- 6.1
CMA / ARV
No comps found within radius.
Projected returns pro-forma
-3.0% appreciation · 3.0% rent growth · sell at horizon
- IRR
- 10.5%
- Equity multiple
- 1.41×
- Total profit
- $25,470
- Equity at exit
- $32,803
- IRR
- 19.5%
- Equity multiple
- 2.64×
- Total profit
- $100,811
- Equity at exit
- $19,022
Cash invested: $61,600 (down + closing). Projections, not guarantees.
Landlord ↔ Tenant lean methodology
- Overall (STATE)
- 73 Landlord-Friendly
- State Ohio
- 73 Landlord-Friendly · R+6
- County
- — inherits STATE
- City
- — inherits STATE
ZIP-level market 44266
- Active inventory
- 159
- Price-to-rent
- 16.9×
Monthly cashflow live
- Estimated rent
- $2,996 medium interval (Pro) →
- Mortgage (P&I)
- −$1,154
- Tax from tax record
- −$161 /mo · $1,937/yr
- Insurance
- −$92
- HOA
- −$0
- Vacancy / Maint / Mgmt
- −$629
- Net cashflow
- $960
Break-even live
3-unit breakdown (identical units grouped — click to expand)
| Units | Beds | Baths | Est. rent |
|---|---|---|---|
| 1× unit | 3 | 1 | $1,088 |
| 2× units | 1 | 1 | $1,908 |
| #2 | 1 | 1 | $954 |
| #3 | 1 | 1 | $954 |
| Total (3 units) | $2,996 | ||
UW: 25.0% down · 7.5% · 30yr · 1.5% tax · 5.0% vac · 8.0% maint · 8.0% mgmt
Financing live
Cash to close
- Down payment
- $55,000
- Closing costs
- $6,600
- Reserves months
- —
- Total cash needed
- —
Loan-product check · same deal, 3 products live
Conventional
25% down · 7.5% · 30yr
- Down + closing
- —
- Monthly P&I
- —
- Monthly cashflow
- —
- DSCR
- —
- Eligible?
- —
Personal DTI + credit; lowest rate.
DSCR
20% down · 8.5% · 30yr
- Down + closing
- —
- Monthly P&I
- —
- Monthly cashflow
- —
- DSCR
- —
- Eligible?
- —
No personal income docs; deal must DSCR.
Hard money
10% down · 12.0% · 12mo
- Down + closing
- —
- Monthly P&I
- —
- Monthly cashflow
- —
- DSCR
- —
- Eligible?
- —
Short-term bridge; refi at stabilization.
Listing history 24 events
-
2026-06-18days on market $220,000 Active 22 DOM
-
2026-06-17days on market $220,000 Active 21 DOM
-
2026-06-16days on market $220,000 Active 20 DOM
-
2026-06-15days on market $220,000 Active 19 DOM
-
2026-06-14days on market $220,000 Active 17 DOM
-
2026-06-10days on market $220,000 Active 14 DOM
-
2026-06-09days on market $220,000 Active 13 DOM
-
2026-06-08days on market $220,000 Active 12 DOM
-
2026-06-07days on market $220,000 Active 11 DOM
-
2026-06-05days on market $220,000 Active 8 DOM
-
2026-06-03days on market $220,000 Active 7 DOM
-
2026-06-02days on market $220,000 Active 6 DOM
-
2026-06-01days on market $220,000 Active 5 DOM
-
2026-05-31days on market $220,000 Active 4 DOM
-
2026-05-31days on market $220,000 Active 3 DOM
-
2026-05-26$220,000 Active
-
2026-04-01historical
-
2026-03-04status Active
-
2026-03-04price $240,000
-
2026-02-02status Pending
-
2025-10-09$250,000 Active
-
2006-04-27soldstatus $84,000 240-char remark
Show marketing remark (240 chars)
Attention investors! Wonderful three unit building priced to sell. Great investment opportunity does need some TLC. Can be purchased as a package deal with mls # 1383053(1233 Overbrook a duplex in Kent), will look at offers on package deal.
-
2006-04-27soldstatus $84,000
Show marketing remark (240 chars)
Attention investors! Wonderful three unit building priced to sell. Great investment opportunity does need some TLC. Can be purchased as a package deal with mls # 1383053(1233 Overbrook a duplex in Kent), will look at offers on package deal.
-
2005-12-07$90,000 240-char remark
Show marketing remark (240 chars)
Attention investors! Wonderful three unit building priced to sell. Great investment opportunity does need some TLC. Can be purchased as a package deal with mls # 1383053(1233 Overbrook a duplex in Kent), will look at offers on package deal.
ⓘ Source: listings_history table (triggers on properties + properties_extension) + one-shot
backfill from property_details.listing_events for pre-trigger history.
Tax reassessment forecast OH · Partial reset (capped growth)
- Current annual tax
- $1,937 · $161/mo
- Projected year-2 tax
- $2,685 · $224/mo
- Expected delta
- +$747/yr (+$62/mo · 38.6%)
ⓘ Screening estimate from a state-policy table — verify with the county assessor before closing.
Climate risk First Street
- Flood 1/10 Low FEMA zone X (unshaded) · 0% chance over 30 yrs
- Wildfire 1/10 Low
- Heat 3/10 Moderate 7 d/yr ≥96°F today · 17 d/yr by 30 yrs out
- Wind 1/10 Low
- Air quality 3/10 Moderate 2 unhealthy d/yr today · 5 by 30 yrs out
Nearby sold comps map
Loading sold comps map…
Walkable amenities ~0.75 mi
Loading nearby amenities…
Taxation est. · year 1
- Rental income
- $35,952
- − Mortgage interest
- −$12,323
- − Property taxes
- −$1,937
- − Insurance
- −$1,100
- − Repairs & maintenance
- −$2,876
- − Management
- −$2,876
- − Depreciation
- −$6,400
- Taxable income
- $8,439
- Est. tax owed @ 24.0%
- −$2,025
- After-tax cash flow
- $9,495/yr
For passive investors: Depreciation is non-cash, so a rental often shows a tax loss while cash-flowing — sheltering income. Rental losses are passive: they offset passive income freely, and up to $25,000/yr can offset ordinary (W-2) income if you actively participate and your MAGI is under $100k (phasing out to $0 by $150k); unused losses carry forward. On sale, claimed depreciation is recaptured at up to 25%, and gains may owe capital-gains tax (a 1031 exchange can defer both). Figures are a year-1 estimate at your 24.0% rate — not tax advice; consult a CPA.
Schools (NCES district)
- District
- Ravenna City
- NCES district ID
- 3904468
- Math proficiency
- 31% ▼ -22.00%
- Reading proficiency
- 41% ▼ -13.00%
- Median HH income
- $40,018
- Composite
- 30.19/100
- National rank
- #6314
- State rank
- #559 of 656 in OH
Livability — Ravenna
- Score
- 73/100
- State rank
- #323
- US rank
- #5309
Category grades
Schools grade is shown separately in the Schools card above.
Census & demographics
- Census place
- Ravenna, OH
- County
- Portage County · 70,400 people
- City population
- 32,612
- Metro
- Akron, OH
- Population (ZIP)
- 32,612
- Household income
- $64,918
- Rent vs Own
- Severe rent burden
- 1468.0
Population outlook (Portage County) Hauer SSP2
- Today (2025)
- 166,109 people
- By 2030
- 167,752 · +1.0%
- By 2040
- 168,640 · +1.5%
- By 2050
- 167,469 · +0.8%
- By 2075
- 170,131 · +2.4%
- By 2100
- 167,958 · +1.1%
Race, ethnicity, and origin ACS 2023
- Neighborhood character
- Predominantly White (87%)
- Race & ethnicity
- White 87% Black 6% Two or more races 4% Hispanic / Latino 2%
- Common ancestry
- Romanian 3% Italian 2% Slovak 2%
- Foreign-born
- 1% · Canada
- Languages at home
- 98% English-only · Spanish 1%
Political lean MEDSL · Portage
- 2024 margin
- R (+15.5) · D 41.8% · R 57.3%
- 2008→2024 swing
- -24.5pp toward R · 2008: 9.0pp · 2024: -15.5pp
- All cycles
- 2024: R+15.5 2020: R+12.5 2016: R+10.2 2012: D+4.9 2008: D+9.0
Not yet ingested
- Civics
- —
Market trends
- HPI YoY
- ▼ -146.76%
- Current HPI
- 196.8027
- Rent YoY
- —
- Metro
- Akron, OH
- State GDP YoY
- ▲ 1.98%
- F500 in state
- 48
Industry mix (Fortune 500 HQ in OH)
| Industry | F500 HQs | Revenue |
|---|---|---|
| Insurance | 3 | $145B |
|
||
| Industrial Machinery | 3 | $49B |
|
||
| Financial Services | 3 | $24B |
|
||
| Consumer Goods | 2 | $93B |
|
||
| Aerospace / Defense | 2 | $47B |
|
||
| Utilities | 2 | $33B |
|
||
Price history
+144.4% since first listed9 events — show timeline
- 2026-05-26 Listed $220,000 MLSNOW
- 2026-04-01 Listing Removed — MLSNOW
- 2026-03-04 Relisted — MLSNOW
- 2026-03-04 Price Changed $240,000 MLSNOW
- 2026-02-02 Pending — MLSNOW
- 2025-10-09 Listed $250,000 MLSNOW
- 2006-04-27 Sold (Public Records) $84,000 Public Records
- 2006-04-27 Sold (MLS) $84,000 MLSNOW
- 2005-12-07 Listed $90,000 MLSNOW
Property tax history
+5.0%/yrLatest (2025): $1,937 · +17.3% YoY. Source: county tax records.
Cash-flow waterfall
monthlySold comps — $/sqft
last 12 mo · ≤1 miLoading sold comps…