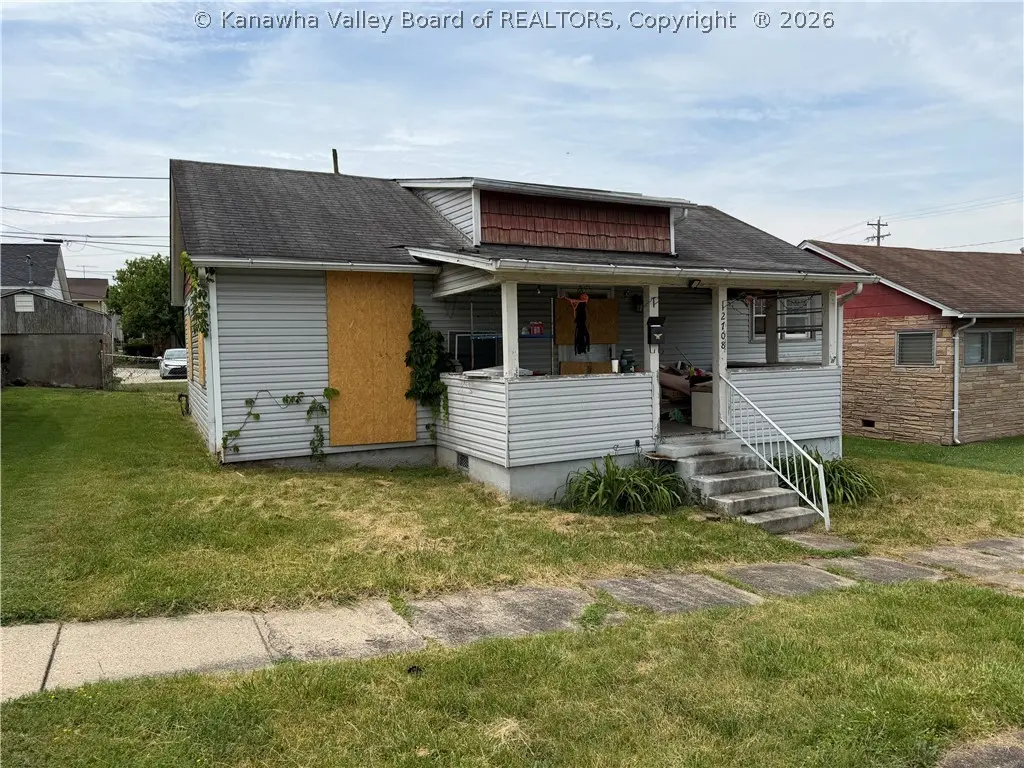
2708 27th St · Nitro, WV
Flood risk 9/10 · Severe
- FEMA flood zone
- X (shaded)
- Chance of flooding over 30 yrs
- 0.99%
- Est. flood insurance / yr
- $507 – $1,088
Fire risk 4/10 · Minor
- Est. fire insurance / yr
- $787 – $1,461
Heat risk 6/10 · Moderate
- Hot days now (above 101°F)
- 7 days/yr
- Hot days in 30 yrs
- 20 days/yr
Wind risk 2/10 · Minimal
- Chance of severe wind over 30 yrs
- 1.0%
Air-quality risk 2/10 · Minimal
- Unhealthy air days now
- 0 days/yr
- Unhealthy air days in 30 yrs
- 1 days/yr
Risk factors via First Street. Map © Google.
Why this score? — see what drove the B- grade
The composite is a weighted blend of 9 inputs, each scored 0–100. Each bar is that input's sub-score; the figure is the points it added to the 100-point composite (weight × sub-score).
- Cash flow +30.0/30.0
- 1% rule +10.0/10.0
- DSCR +10.0/10.0
- ARV discount +7.5/15.0
- Livability +3.4/5.0
- Schools +2.9/10.0
- Rent growth +2.5/5.0
- Condition / age +2.5/5.0
- Appreciation +0.0/10.0
$25,000
🖨 Deal sheet 📄 Offer letter ✓ Due diligence
Listing remarks MLS
FIX and FLIP, great opportunity for investors to renovate to rent or sell, convenient location in established neighborhood, includes storage building.
Key facts
- Listed 5 days
Property features AI
Finance
- Other: Directions: From Nitro, take 27th Street to the property
- Financial info: Annual property tax approximately $1,483
Exterior
- Home design: Single-family residential property
- Construction: Vinyl siding
- Exterior features: Lot dimensions approximately 40 x 40 x 60 x 60
Interior
- Bathrooms: 1 full bathroom
- Heating & cooling: Has heating; Other type of heating
- Interior features: No basement; Total of 4 rooms
Neighborhood map
What this means for you Summary
Snapshot
- This is a 2-bed/1.0-bath single-family listed at $25k.
Deal economics
- At list price, monthly cash flow is $440 ($5k/yr) — positive.
- The deal already cash-flows at list — no discount required.
- Meets the 1% rule at list price ($860 rent vs $25k).
- Cap rate 30.6% vs local median 5.2% in Nitro — top-decile yield for the area; either an underpriced asset or a hidden risk that comps aren't pricing in. Stress-test before assuming the spread holds.
Location & tenants
- Location reads 67/100 on livability (#97 in WV) — a middle-class / working-renter tenant base. Strengths: cost of living A+, housing A+; Watch: crime C-, amenities C-, employment D.
- Kanawha County Schools (suburban): math 29% / reading 40% proficiency, ranked #17 of 55 in WV (top 31%) — families likely to look elsewhere, expect single-tenant / working-renter base with shorter leases.
- Zoned schools: Nitro Elementary School (math 27% / reading 37%, grade F, #191 of 377 statewide, top 56%, 364 students, 0% FRL); Andrew Jackson Middle School (math 23% / reading 41%, grade F, #46 of 109 statewide, top 46%, 512 students, 0% FRL); Nitro High School (math 22% / reading 57%, grade F, #21 of 110 statewide, top 26%, 827 students, 0% FRL) — zoned schools average 0% FRL vs 46% district-wide (46 pts lower); this property's tenant base skews higher-income than the district average.
- Market conditions: 39 active listings in the ZIP; 103 units permitted in Kanawha County in 2024 (0 in 5+ unit buildings).
Forward outlook
- Local home prices are declining (-3.0%/yr); year-one equity from $173 of loan paydown is wiped out by about $750 of value loss. Plan a longer hold.
- Kanawha County population projected at -17% by 2050 — secular population decline; favor cash flow + early exit over multi-decade hold.
- At projected returns (-3.0% appreciation + 3.0% rent growth), your $7k cash investment doubles in ~2 years — after that, you're playing with house money.
Negotiation context
- Only 5 days on market — expect competitive offers; lowballing is unlikely to land.
- 2 sale attempts since 8y ago with the ask held roughly flat each time — persistent listings suggest the price (not the market) is what's stuck; bring a comps-based counter.
- Current owner paid $15k; list at $25k implies a 67% gain — meaningful room to come down on a strong offer.
Risks & watch-outs
- Watch-outs: flood insurance adds $66/mo; built in 1918 — expect roof / HVAC / electrical / plumbing capex.
- Climate carrying-cost: severe flood risk; extreme-heat days projected 7→20/yr by 2055 (HVAC capex compounding) — expect insurance premiums to compound above CPI over the hold.
Questions for the listing agent
- Built in 1918 — when were the roof, HVAC, electrical panel, plumbing, and water heater last replaced?
- What's the actual annual flood-insurance premium (NFIP or private), and is the property in a SFHA with mandatory coverage?
- Is there a deadline driving the sale (1031 exchange, divorce, estate, relocation)? That informs how much negotiation room exists.
- Schools are F-rated, which usually means shorter tenancies and higher turnover. Who's the typical renter profile here, and what's been the actual vacancy rate?
- What's the average days-on-market for RENTAL listings here right now (not sales)? A rising rental-DOM trend means longer vacancies and softer asking-rent achievability than the comps imply.
- What's the recent tenant-quality profile in this submarket — average credit score on applications, eviction rate, late-payment / NSF rate, and stable-employment percentage? A property-management company in the area should have these aggregated.
- How much new for-sale + rental construction is in the pipeline within 1–3 miles? Heavy new supply typically softens prices + rents 12–24 months out; constrained supply supports both.
Investment metrics
- 1% rule
- 3.44% ✓
- Cap rate
- 30.62%
- Cash-on-cash
- 86.87%
- DSCR
- 4.87
- GRM
- 2.4
CMA / ARV
- ARV (on-the-fly)
- $141,696
- Comps found
- 3
Show comp detail 3 sales within ~0.75 mi
| Address | Dist | Beds/Ba | Sqft | Sold | Price | $/sf | Match |
|---|---|---|---|---|---|---|---|
| 3013 30th St | 0.13mi | 2/1.0 | 925 (+7%) | 19mo | $25,000 | $27 | 66 |
| 1210 12th St | 0.61mi | 2/1.0 | 825 (-4%) | 4mo | $135,000 | $164 | 60 |
| 1226 12th St | 0.62mi | 3/1.0 (+1) | 935 (+8%) | 6mo | $164,000 | $175 | 47 |
Match score weights: distance 35% · size 25% · config 20% · recency 20%. Top-matched comps best support the ARV.
Projected returns pro-forma
-3.0% appreciation · 3.0% rent growth · sell at horizon
- IRR
- 75.4%
- Equity multiple
- 4.44×
- Total profit
- $24,045
- Equity at exit
- $3,728
- IRR
- 79.2%
- Equity multiple
- 9.18×
- Total profit
- $57,266
- Equity at exit
- $2,162
Cash invested: $7,000 (down + closing). Projections, not guarantees.
Landlord ↔ Tenant lean methodology
- Overall (STATE)
- 83 Strongly Landlord-Friendly
- State West Virginia
- 83 Strongly Landlord-Friendly · R+22
- County
- — inherits STATE
- City
- — inherits STATE
ZIP-level market 25143
- Home prices YoY
- -19.2%
- Active inventory
- 39
- Price-to-rent
- 2.4×
Monthly cashflow live
- Estimated rent
- $860 medium interval (Pro) →
- Mortgage (P&I)
- −$131
- Tax est. 1.5%
- −$31 /mo · $375/yr
- Insurance
- −$10
- Flood insurance flood zone
- −$66 /mo · $798/yr
- HOA
- −$0
- Vacancy / Maint / Mgmt
- −$181
- Net cashflow
- $440
Break-even live
UW: 25.0% down · 7.5% · 30yr · 1.5% tax · 5.0% vac · 8.0% maint · 8.0% mgmt
Financing live
Cash to close
- Down payment
- $6,250
- Closing costs
- $750
- Reserves months
- —
- Total cash needed
- —
Loan-product check · same deal, 3 products live
Conventional
25% down · 7.5% · 30yr
- Down + closing
- —
- Monthly P&I
- —
- Monthly cashflow
- —
- DSCR
- —
- Eligible?
- —
Personal DTI + credit; lowest rate.
DSCR
20% down · 8.5% · 30yr
- Down + closing
- —
- Monthly P&I
- —
- Monthly cashflow
- —
- DSCR
- —
- Eligible?
- —
No personal income docs; deal must DSCR.
Hard money
10% down · 12.0% · 12mo
- Down + closing
- —
- Monthly P&I
- —
- Monthly cashflow
- —
- DSCR
- —
- Eligible?
- —
Short-term bridge; refi at stabilization.
Listing history 5 events
-
2026-06-16status $25,000 Pending 5 DOM
-
2026-06-15days on market $25,000 Active 5 DOM
-
2026-06-14days on market $25,000 Active 3 DOM
-
2026-06-12remarks 687-char remark
-
2026-06-12$25,000 Active 2 DOM
ⓘ Source: listings_history table (triggers on properties + properties_extension) + one-shot
backfill from property_details.listing_events for pre-trigger history.
Climate risk First Street
- Flood 9/10 Extreme FEMA zone X (shaded) · 99% chance over 30 yrs
- Wildfire 4/10 Moderate
- Heat 6/10 Major 7 d/yr ≥101°F today · 20 d/yr by 30 yrs out
- Wind 2/10 Low 100% chance of damaging wind over 30 yrs
- Air quality 2/10 Low 0 unhealthy d/yr today · 1 by 30 yrs out
Nearby sold comps map
Loading sold comps map…
Walkable amenities ~0.75 mi
Loading nearby amenities…
Taxation est. · year 1
- Rental income
- $10,322
- − Mortgage interest
- −$1,400
- − Property taxes
- −$375
- − Insurance
- −$922
- − Repairs & maintenance
- −$826
- − Management
- −$826
- − Depreciation
- −$727
- Taxable income
- $5,245
- Est. tax owed @ 24.0%
- −$1,259
- After-tax cash flow
- $4,025/yr
For passive investors: Depreciation is non-cash, so a rental often shows a tax loss while cash-flowing — sheltering income. Rental losses are passive: they offset passive income freely, and up to $25,000/yr can offset ordinary (W-2) income if you actively participate and your MAGI is under $100k (phasing out to $0 by $150k); unused losses carry forward. On sale, claimed depreciation is recaptured at up to 25%, and gains may owe capital-gains tax (a 1031 exchange can defer both). Figures are a year-1 estimate at your 24.0% rate — not tax advice; consult a CPA.
Schools (NCES district)
- District
- Kanawha County Schools
- NCES district ID
- 5400600
- Math proficiency
- 29% ▼ -13.00%
- Reading proficiency
- 40% ▼ -7.00%
- Median HH income
- $44,329
- Composite
- 29.35/100
- National rank
- #6540
- State rank
- #17 of 55 in WV
Livability — Nitro
- Score
- 67/100
- State rank
- #97
- US rank
- #10940
Category grades
Schools grade is shown separately in the Schools card above.
Census & demographics
- Census place
- Nitro, WV
- Population (ZIP)
- 9,185
Population outlook (Kanawha County) Hauer SSP2
- Today (2025)
- 178,946 people
- By 2030
- 172,906 · -3.4%
- By 2040
- 159,874 · -10.7%
- By 2050
- 148,148 · -17.2%
- By 2075
- 123,257 · -31.1%
- By 2100
- 96,454 · -46.1%
Race, ethnicity, and origin ACS 2023
- Neighborhood character
- Predominantly White (90%)
- Race & ethnicity
- White 90% Two or more races 8% Hispanic / Latino 1% Black 1%
- Common ancestry
- Italian 3% Serbian 2% Slovak 2%
- Foreign-born
- 0%
- Languages at home
- 99% English-only · French/Haitian/Cajun 1% Other Indo-European 1%
Political lean MEDSL · Kanawha
- 2024 margin
- R (+17.4) · D 40.2% · R 57.6% · Other 2.2%
- 2008→2024 swing
- -17.0pp toward R · 2008: -0.4pp · 2024: -17.4pp
- All cycles
- 2024: R+17.4 2020: R+14.7 2016: R+20.6 2012: R+11.9 2008: R+0.4
Not yet ingested
- Civics
- —
Market trends
- HPI YoY
- ▼ -48.75%
- Current HPI
- 205.6038
- Rent YoY
- —
- Metro
- —
- State GDP YoY
- —
- F500 in state
- 0
Price history
+25.0% since first listed4 events — show timeline
- 2026-06-10 Listed $25,000 KVBOR
- 2019-03-25 Sold (MLS) $15,000 KVBOR
- 2018-09-12 Listed $19,950 KVBOR
- 2011-06-01 Sold (Public Records) $20,000 Public Records
Property tax history
+2.1%/yrLatest (2025): $1,482 · -0.1% YoY. Source: county tax records.
Cash-flow waterfall
monthlySold comps — $/sqft
last 12 mo · ≤1 miLoading sold comps…