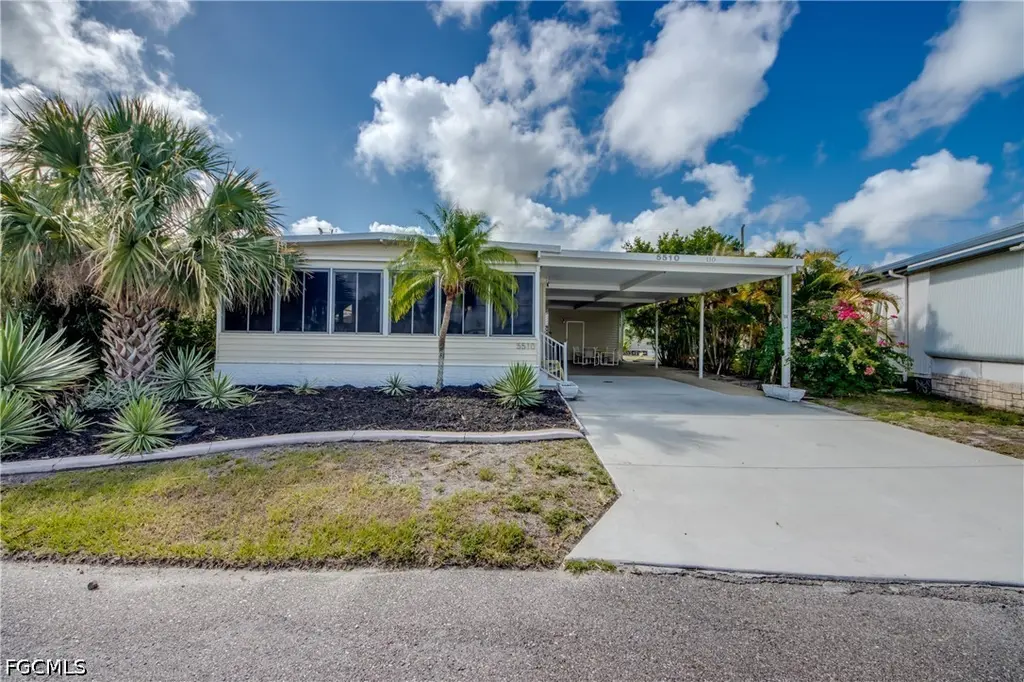
5510 Back Bay Bnd · North Fort Myers, FL
Flood risk 7/10 · Major
- FEMA flood zone
- AE
- Chance of flooding over 30 yrs
- 0.75%
- Est. flood insurance / yr
- $1,737 – $8,500
Fire risk 1/10 · Minimal
- Est. fire insurance / yr
- $947 – $1,759
Heat risk 10/10 · Severe
- Hot days now (above 107°F)
- 7 days/yr
- Hot days in 30 yrs
- 30 days/yr
Wind risk 10/10 · Severe
- Chance of severe wind over 30 yrs
- 99.0%
Air-quality risk 2/10 · Minimal
- Unhealthy air days now
- 1 days/yr
- Unhealthy air days in 30 yrs
- 1 days/yr
Risk factors via First Street. Map © Google.
Why this score? — see what drove the B- grade
The composite is a weighted blend of 9 inputs, each scored 0–100. Each bar is that input's sub-score; the figure is the points it added to the 100-point composite (weight × sub-score).
- Cash flow +26.6/30.0
- 1% rule +10.0/10.0
- DSCR +9.1/10.0
- ARV discount +7.5/15.0
- Schools +4.1/10.0
- Livability +3.7/5.0
- Rent growth +3.2/5.0
- Condition / age +2.5/5.0
- Appreciation +0.0/10.0
$114,900
🖨 Deal sheet (PDF) 📄 Offer letter ✓ Due diligence
Listing remarks
This fully Furnished and Turnkey Home is available today! Grab your belongings and move right in to this 55 and Older Gulf Access Community and enjoy the Florida Lifestyle today! This home has 2 Bedrooms/ 2 Baths and comes fully remodeled in 2023. Nice open floorpan with light and bright kitchen, new floors, New A/C System, New Roof, elegant finishes and upgraded bathroom all done during the remodel. The exterior has an enclosed porch in the front and a 2 Car Carport to the side with Storage Shed and Laundry area! This place will need nothing to be done as this seller handled it all!! This property is located in the desirable Gulf Access Community of Old Bridge Village. Old Bridge Village i
Key facts
- 2 car carport
- Fully remodeled
- Laundry area
Tags
Property features AI
Finance
- Financial info: Pets not allowed
- HOA & community: Homeowners association with a $342 monthly fee; HOA covers legal/accounting, grounds maintenance, security and trash; Community amenities include clubhouse, pool, park, playground, picnic area, barbecue, tennis courts, pickleball, boat dock/boat ramp/boat slip, and on-site management; Approximately 700 units in the community
Exterior
- Parking: Attached carport; 2 covered spaces; Driveway (paved)
- Security: Gated community; Community management
- Utilities: Public water; Public sewer; Cable available
- Home design: Manufactured home with vinyl siding; One story; Resale property; Faces north; Entry at level 1
- Construction: Shingle roof
- Exterior features: Storage; Community pool; Irregular lot; South exposure
Interior
- Kitchen: Microwave; Range; Refrigerator
- Bedrooms: Florida room; Great room
- Flooring: Carpet; Laminate
- Bathrooms: 2 full bathrooms
- Heating & cooling: Central heating (electric); Central air conditioning (electric)
- Interior features: Kitchen island; Open living/dining area; Separate shower; Shower only; Cable TV; Window treatments; Single-hung windows; Shutters; Furnished
- Laundry & utility: Washer; Dryer; Laundry located in garage
Neighborhood map
What this means for you Summary
Snapshot
- This is a 2-bed/2.0-bath condo listed at $115k.
Deal economics
- At list price, monthly cash flow is $-117 ($-1k/yr) — negative.
- To cash-flow at today's rent, offer at most $94k (18.0% below list).
- Meets the 1% rule at list price ($2k rent vs $115k).
- Recommended offer: $94k (18.0% below list) — sets the bar for cash-flow.
- Cap rate 9.5% vs local median 3.6% in North Fort Myers — top-decile yield for the area; either an underpriced asset or a hidden risk that comps aren't pricing in. Stress-test before assuming the spread holds.
Location & tenants
- Location reads 74/100 on livability (#269 in FL, #4,409 nationally) — a middle-class / working-renter tenant base. Strengths: cost of living A+, housing A+, health & safety A+; Watch: employment C-, amenities F, commute F.
- Lee (suburban): math 47% / reading 50% proficiency, ranked #42 of 73 in FL (top 58%) — families likely to look elsewhere, expect single-tenant / working-renter base with shorter leases.
- Zoned schools: Diplomat Elementary School (math 67% / reading 60%, grade B, #564 of 2,144 statewide, top 27%, 1,069 students, 56% FRL); Mariner Middle School (math 50% / reading 47%, grade C-, #274 of 571 statewide, top 50%, 1,001 students, 53% FRL); Ida S. Baker High School (math 44% / reading 47%, grade D-, #223 of 667 statewide, top 34%, 1,933 students, 39% FRL).
- Market conditions: Rents rising (+2.6%/yr); 846 active listings in the ZIP; 30 comparable units currently listed for rent nearby; rentals at typical pace (median 22d on market — plan ~3-4 weeks tenant-placement turnaround); 15,411 units permitted in Lee County in 2024 (4,686 in 5+ unit buildings).
- This rent runs 38% of the median local income ($55k/yr) — at the standard rent-burdened threshold; future hikes will face affordability resistance.
Forward outlook
- Local home prices are declining (-3.0%/yr); year-one equity from $794 of loan paydown is wiped out by about $3k of value loss. Plan a longer hold.
- Lee County population projected at +44% by 2050 — long-run rental-demand tailwind backs the buy-and-hold thesis.
Negotiation context
- It's been on market 28 days — a 2% lower offer ($113k) is reasonable based on typical stale-listing flexibility.
- 5 sale attempts since 7y ago; this cycle's ask has dropped $10k (8%) from the opening price — seller is motivated, your offer sets the floor, not the list.
- Current owner paid $77k; 49% above their basis — modest negotiation headroom, anchor on the comps not their cost.
Risks & watch-outs
- Watch-outs: flood insurance adds $427/mo.
- Climate carrying-cost: in FEMA flood zone AE (mandatory federal flood insurance); severe wind risk, 99% chance of damaging wind over 30y; extreme-heat days projected 7→30/yr by 2055 (HVAC capex compounding) — expect insurance premiums to compound above CPI over the hold.
Questions for the listing agent
- What do current leases actually rent for vs. the listed asking? Can we see a recent rent roll and the last 12 months of T-12 income?
- Built in 1973 — when were the roof, HVAC, electrical panel, plumbing, and water heater last replaced?
- What's the actual annual flood-insurance premium (NFIP or private), and is the property in a SFHA with mandatory coverage?
- What does the HOA fee cover, when was the last increase, and are there any pending special assessments or reserve-fund shortfalls?
- Any open or pending special assessments — roof, HVAC, plumbing, elevator, façade? What's the per-unit balance and payoff schedule, and is the seller paying it off at close or rolling it to the buyer?
- Is there a deadline driving the sale (1031 exchange, divorce, estate, relocation)? That informs how much negotiation room exists.
- What's the average days-on-market for RENTAL listings here right now (not sales)? A rising rental-DOM trend means longer vacancies and softer asking-rent achievability than the comps imply.
- What's the recent tenant-quality profile in this submarket — average credit score on applications, eviction rate, late-payment / NSF rate, and stable-employment percentage? A property-management company in the area should have these aggregated.
- How much new apartment / multifamily construction is in the pipeline within 1–3 miles? Heavy new supply (>2% of stock underway) typically softens rents 12–24 months out; light construction supports rent growth.
Investment metrics
- 1% rule
- 1.51% ✓
- Cap rate
- 9.52%
- Cash-on-cash
- 11.53%
- DSCR
- 1.51
- GRM
- 5.5
CMA / ARV
No comps found within radius.
Projected returns pro-forma
-3.0% appreciation · 2.63% rent growth · sell at horizon
- IRR
- -23.9%
- Equity multiple
- 0.18×
- Total profit
- $-26,286
- Equity at exit
- $17,132
- IRR
- -19.7%
- Equity multiple
- -0.03×
- Total profit
- $-33,297
- Equity at exit
- $9,934
Cash invested: $32,172 (down + closing). Projections, not guarantees.
Landlord ↔ Tenant lean methodology
- Overall (STATE)
- 87 Strongly Landlord-Friendly
- State Florida
- 87 Strongly Landlord-Friendly · R+3
- County
- — inherits STATE
- City
- — inherits STATE
ZIP-level market 33917
- Home prices YoY
- -30.2%
- Rents YoY
- 2.6%
- Active inventory
- 846
- Price-to-rent
- 5.5×
Monthly cashflow live
- Estimated rent
- $1,739 high interval (Pro) →
- Mortgage (P&I)
- −$603
- Tax from tax record
- −$72 /mo · $870/yr
- Insurance
- −$48
- Flood insurance flood zone
- −$427 /mo · $5,118/yr
- HOA
- −$342
- Vacancy / Maint / Mgmt
- −$365
- Net cashflow
- $-117
Break-even live
Sensitivity live
| Price | -10% $-52 | -5% $-85 | +0% $-117 | +5% $-150 | +10% $-182 |
|---|---|---|---|---|---|
| Rent | -10% $-255 | -5% $-186 | +0% $-117 | +5% $-49 | +10% $20 |
| Rate | -1.0pp $-60 | -0.5pp $-88 | base $-117 | +0.5pp $-147 | +1.0pp $-177 |
UW: 25.0% down · 7.5% · 30yr · 1.5% tax · 5.0% vac · 8.0% maint · 8.0% mgmt
Financing live
Cash to close
- Down payment
- $28,725
- Closing costs
- $3,447
- Reserves months
- —
- Total cash needed
- —
Loan-product check · same deal, 3 products live
Conventional
25% down · 7.5% · 30yr
- Down + closing
- —
- Monthly P&I
- —
- Monthly cashflow
- —
- DSCR
- —
- Eligible?
- —
Personal DTI + credit; lowest rate.
DSCR
20% down · 8.5% · 30yr
- Down + closing
- —
- Monthly P&I
- —
- Monthly cashflow
- —
- DSCR
- —
- Eligible?
- —
No personal income docs; deal must DSCR.
Hard money
10% down · 12.0% · 12mo
- Down + closing
- —
- Monthly P&I
- —
- Monthly cashflow
- —
- DSCR
- —
- Eligible?
- —
Short-term bridge; refi at stabilization.
Rent comps 30 comps
| Address | Beds | Baths | Sqft | Rent | $/sqft | DOM | Units | Dist |
|---|---|---|---|---|---|---|---|---|
| 1056 Old Bridge Rd North Fort Myers, FL | 2.0 | 1.0 | 1100 | $1,350 | $1.23 | 25d | 1 | 0.21mi |
| 257 Poe Ave North Fort Myers, FL | 2.0 | 1.0 | 870 | $1,175 | $1.35 | 5d | 1 | 0.33mi |
| 7050 Nantucket Cir #6 North Fort Myers, FL | 2.0 | 2.0 | 950 | $3,000 | $3.16 | 18d | 1 | 0.49mi |
| 7050 Nantucket Cir North Fort Myers, FL | 2.0 | 2.0 | 950 | $3,000 | $3.16 | 25d | 1 | 0.49mi |
| 5713 Foxlake Dr #5 North Fort Myers, FL | 2.0 | 2.0 | 830 | $1,400 | $1.69 | 21d | 1 | 0.51mi |
| 1275 Gramac Dr North Fort Myers, FL | 3.0 | 2.0 | 1013 | $1,550 | $1.53 | 5d | 1 | 0.59mi |
| 1275 Gramac Dr North Fort Myers, FL | 3.0 | 2.0 | 1013 | $1,575 | $1.55 | 25d | 1 | 0.59mi |
| 5707 Foxlake Dr #2 North Fort Myers, FL | 2.0 | 2.0 | 1114 | $1,500 | $1.35 | 25d | 1 | 0.59mi |
| 15427 Crystal Lake Dr North Fort Myers, FL | 2.0 | 2.0 | 1021 | $3,200 | $3.13 | 25d | 1 | 0.67mi |
| 15610 Crystal Lake Dr #101 North Fort Myers, FL | 2.0 | 2.0 | 998 | $1,900 | $1.90 | 25d | 1 | 0.77mi |
| 15610 Crystal Lake Dr North Fort Myers, FL | 2.0 | 2.0 | 968 | $1,850 | $1.91 | 25d | 1 | 0.77mi |
| 69 E Mariana Ave Unit B North Fort Myers, FL | 3.0 | 1.0 | 1000 | $1,795 | $1.79 | 5d | 1 | 0.99mi |
| 1916 Flamingo Dr North Fort Myers, FL | 2.0 | 1.0 | 852 | $1,275 | $1.50 | 25d | 1 | 1.05mi |
| 1916 Flamingo Dr North Fort Myers, FL | 2.0 | 1.0 | 852 | $1,250 | $1.47 | 5d | 1 | 1.05mi |
| 137 Lantern Pl North Fort Myers, FL | 1.0 | 1.0 | 580 | $975 | $1.68 | 4d | 1 | 1.10mi |
| 137 Lantern Pl Unit A North Fort Myers, FL | 2.0 | 1.0 | 1080 | $1,200 | $1.11 | 4d | 1 | 1.10mi |
| 112 Crescent Lake Dr North Fort Myers, FL | 2.0 | 1.0 | 980 | $1,700 | $1.73 | 25d | 1 | 1.11mi |
| 21 Crescent Lake Dr Unit 21 North Fort Myers, FL | 2.0 | 1.0 | 900 | $1,550 | $1.72 | 25d | 1 | 1.13mi |
| 234 Lamplighter Ln North Fort Myers, FL | 2.0 | 2.0 | 864 | $895 | $1.04 | 16d | 1 | 1.21mi |
| 226 Lamplighter Ln North Fort Myers, FL | 2.0 | 1.0 | 900 | $899 | $1.00 | 25d | 1 | 1.23mi |
| 121 Coachlight Ln North Fort Myers, FL | 1.0 | 1.0 | 552 | $795 | $1.44 | 25d | 1 | 1.23mi |
| 1846 Powell Dr Unit 28 North Fort Myers, FL | 1.0 | 1.0 | 850 | $1,500 | $1.76 | 5d | 1 | 1.25mi |
| 1526 Wood Rd North Fort Myers, FL | 1.0 | 1.0 | 912 | $1,500 | $1.64 | 5d | 1 | 1.25mi |
| 106 Gaslight Ave North Fort Myers, FL | 2.0 | 2.0 | 1056 | $1,400 | $1.33 | 5d | 1 | 1.26mi |
| 280 Flame Ln North Fort Myers, FL | 2.0 | 2.0 | 980 | $1,350 | $1.38 | 5d | 1 | 1.27mi |
| 7306 Coon Rd North Fort Myers, FL | 2.0 | 1.0 | 1000 | $1,300 | $1.30 | 13d | 1 | 1.28mi |
| 249 Fireball Ln North Fort Myers, FL | 2.0 | 1.5 | 624 | $1,350 | $2.16 | 5d | 1 | 1.35mi |
| 92 Oak St North Fort Myers, FL | 2.0 | 2.0 | 1008 | $2,000 | $1.98 | 5d | 1 | 1.42mi |
| 947 Strongbox Ln North Fort Myers, FL | 2.0 | 2.0 | 1000 | $1,300 | $1.30 | 25d | 1 | 1.42mi |
| 3225 E Riverside Dr Fort Myers, FL | 1.0 | 1.0 | 560 | $1,800 | $3.21 | 25d | 1 | 1.48mi |
HOA detail condo
- Monthly dues
- $342 · $4,104/yr
- Assessments
- None detected in remarks — confirm with the listing agent.
Listing history 34 events
-
2026-06-17status $114,900 Pending 28 DOM
-
2026-06-17days on market $114,900 Active 28 DOM
-
2026-06-16days on market $114,900 Active 27 DOM
-
2026-06-15price $114,900 Active 26 DOM
-
2026-06-15days on market $124,900 Active 26 DOM
-
2026-06-13days on market $124,900 Active 24 DOM
-
2026-06-10days on market $124,900 Active 21 DOM
-
2026-06-09days on market $124,900 Active 20 DOM
-
2026-06-08days on market $124,900 Active 19 DOM
-
2026-06-07days on market $124,900 Active 18 DOM
-
2026-06-03days on market $124,900 Active 14 DOM
-
2026-06-02days on market $124,900 Active 13 DOM
-
2026-06-01days on market $124,900 Active 12 DOM
-
2026-05-31days on market $124,900 Active 11 DOM
-
2026-05-20$124,900 Active
-
2024-01-01historical
-
2023-11-02price $169,900
-
2023-10-30price $159,898
-
2023-08-02price $159,900
-
2023-07-10price $164,750
-
2023-06-08status Active
-
2023-05-28status Pending
-
2023-04-28price $164,900
-
2023-04-13$174,900 Active
-
2022-12-13historical
-
2022-12-02price $49,000
-
2022-11-19$58,000 Active
-
2019-11-07soldstatus $77,000 Closed
-
2019-11-05status Pending
-
2019-11-02historical
-
2019-10-17status Pending
-
2019-09-18status Pending
-
2019-08-02$79,900 Active
-
2002-07-19soldstatus $30,000,000
ⓘ Source: listings_history table (triggers on properties + properties_extension) + one-shot
backfill from property_details.listing_events for pre-trigger history.
Tax reassessment forecast FL · Resets to sale price
- Current annual tax
- $870 · $72/mo
- Projected year-2 tax
- $954 · $79/mo
- Expected delta
- +$84/yr (+$7/mo · 9.7%)
ⓘ Screening estimate from a state-policy table — verify with the county assessor before closing.
Climate risk First Street
- Flood 7/10 Severe FEMA zone AE · 75% chance over 30 yrs
- Wildfire 1/10 Low
- Heat 10/10 Extreme 7 d/yr ≥107°F today · 30 d/yr by 30 yrs out
- Wind 10/10 Extreme 99% chance of damaging wind over 30 yrs
- Air quality 2/10 Low 1 unhealthy d/yr today · 1 by 30 yrs out
Nearby sold comps map
Loading sold comps map…
Walkable amenities ~0.75 mi
Loading nearby amenities…
Taxation est. · year 1
- Rental income
- $20,871
- − Mortgage interest
- −$6,436
- − Property taxes
- −$870
- − Insurance
- −$5,693
- − Repairs & maintenance
- −$1,670
- − Management
- −$1,670
- − HOA
- −$4,104
- − Depreciation
- −$3,343
- Taxable loss
- −$2,913
- Est. tax savings @ 24.0%
- +$699
- After-tax cash flow
- $-710/yr
For passive investors: Depreciation is non-cash, so a rental often shows a tax loss while cash-flowing — sheltering income. Rental losses are passive: they offset passive income freely, and up to $25,000/yr can offset ordinary (W-2) income if you actively participate and your MAGI is under $100k (phasing out to $0 by $150k); unused losses carry forward. On sale, claimed depreciation is recaptured at up to 25%, and gains may owe capital-gains tax (a 1031 exchange can defer both). Figures are a year-1 estimate at your 24.0% rate — not tax advice; consult a CPA.
Schools (NCES district)
- District
- Lee
- NCES district ID
- 1201080
- Math proficiency
- 47% ▼ -11.00%
- Reading proficiency
- 50% ▼ -4.00%
- Median HH income
- $49,518
- Composite
- 41.49/100
- National rank
- #3458
- State rank
- #42 of 73 in FL
Livability — North Fort Myers
- Score
- 74/100
- State rank
- #269
- US rank
- #4409
Category grades
Schools grade is shown separately in the Schools card above.
Census & demographics
- Census place
- North Fort Myers, FL
- County
- Lee County · 788,662 people
- City population
- 57,035
- Metro
- Cape Coral-Fort Myers, FL
- Population (ZIP)
- 33,380
- Household income
- $55,000
- Rent vs Own
- Severe rent burden
- 775.0
Population outlook (Lee County) Hauer SSP2
- Today (2025)
- 871,946 people
- By 2030
- 955,468 · +9.6%
- By 2040
- 1,113,587 · +27.7%
- By 2050
- 1,256,891 · +44.1%
- By 2075
- 1,560,270 · +78.9%
- By 2100
- 1,726,848 · +98.0%
Race, ethnicity, and origin ACS 2023
- Neighborhood character
- Predominantly White (85%)
- Race & ethnicity
- White 85% Hispanic / Latino 10% Two or more races 7% Asian 1% Black 1%
- Hispanic origin (detail)
- Mexican 2% Puerto Rican 1% Cuban 3%
- Common ancestry
- Lithuanian 3% Romanian 3% Slovak 2%
- Foreign-born
- 10% · Canada
- Languages at home
- 88% English-only · Spanish 9% Other Indo-European 1% Russian/Polish/Slavic 1%
Political lean MEDSL · Lee
- 2024 margin
- Strong R (+28.4) · D 35.5% · R 63.9%
- 2008→2024 swing
- -18.0pp toward R · 2008: -10.4pp · 2024: -28.4pp
- All cycles
- 2024: R+28.4 2020: R+19.2 2016: R+20.4 2012: R+16.6 2008: R+10.4
Not yet ingested
- Civics
- —
Market trends
- HPI YoY
- ▼ -122.28%
- Current HPI
- 282.2895
- Rent YoY
- ▲ 2.63%
- Metro
- Cape Coral-Fort Myers, FL
- State GDP YoY
- ▲ 3.28%
- F500 in state
- 36
Industry mix (Fortune 500 HQ in FL)
| Industry | F500 HQs | Revenue |
|---|---|---|
| Industrial Technology | 2 | $29B |
|
||
| Insurance | 2 | $17B |
|
||
| Retail | 1 | $60B |
|
||
| Technology Distribution | 1 | $58B |
|
||
| Homebuilding | 1 | $35B |
|
||
| Technology Manufacturing | 1 | $35B |
|
||
Price history
-99.6% since first listed20 events — show timeline
- 2026-05-20 Listed $124,900 FORTMLS
- 2024-01-01 Listing Removed — FORTMLS
- 2023-11-02 Price Changed $169,900 FORTMLS
- 2023-10-30 Price Changed $159,898 FORTMLS
- 2023-08-02 Price Changed $159,900 FORTMLS
- 2023-07-10 Price Changed $164,750 FORTMLS
- 2023-06-08 Relisted — FORTMLS
- 2023-05-28 Pending — FORTMLS
- 2023-04-28 Price Changed $164,900 FORTMLS
- 2023-04-13 Listed $174,900 FORTMLS
- 2022-12-13 Listing Removed — FORTMLS
- 2022-12-02 Price Changed $49,000 FORTMLS
- 2022-11-19 Listed $58,000 FORTMLS
- 2019-11-07 Sold (MLS) $77,000 FORTMLS
- 2019-11-05 Pending — FORTMLS
- 2019-11-02 Listing Removed — FORTMLS
- 2019-10-17 Pending — FORTMLS
- 2019-09-18 Pending — FORTMLS
- 2019-08-02 Listed $79,900 FORTMLS
- 2002-07-19 Sold (Public Records) $30,000,000 Public Records
Property tax history
+7.9%/yrLatest (2025): $870 · +13.6% YoY. Source: county tax records.
Cash-flow waterfall
monthlySold comps — $/sqft
last 12 mo · ≤1 miLoading sold comps…