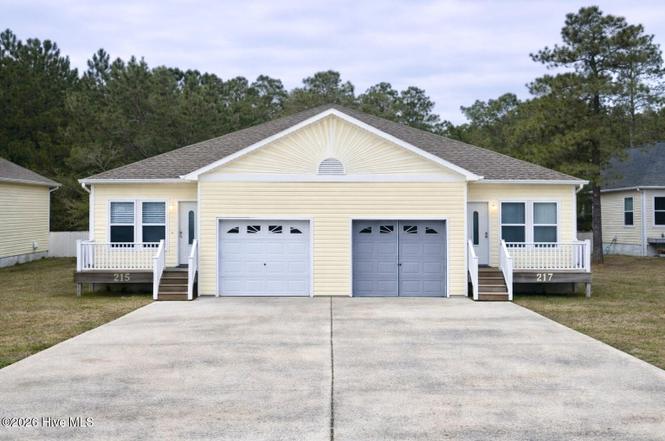
 Duplex
215/217 Lloyd St · Holly Ridge, NC
Flood risk 1/10 · Minimal
- FEMA flood zone
- X (unshaded)
- Chance of flooding over 30 yrs
- 0.0%
- Est. flood insurance / yr
- $507 – $1,088
Fire risk 6/10 · Moderate
- Est. fire insurance / yr
- $906 – $1,684
Heat risk 9/10 · Severe
- Hot days now (above 104°F)
- 7 days/yr
- Hot days in 30 yrs
- 21 days/yr
Wind risk 9/10 · Severe
- Chance of severe wind over 30 yrs
- 99.0%
Air-quality risk 2/10 · Minimal
- Unhealthy air days now
- 1 days/yr
- Unhealthy air days in 30 yrs
- 1 days/yr
Risk factors via First Street. Map © Google.
Why this score? — see what drove the D+ grade
The composite is a weighted blend of 9 inputs, each scored 0–100. Each bar is that input's sub-score; the figure is the points it added to the 100-point composite (weight × sub-score).
- Cash flow +17.2/30.0
- ARV discount +7.5/15.0
- DSCR +5.4/10.0
- 1% rule +4.7/10.0
- Condition / age +4.0/5.0
- Schools +3.9/10.0
- Livability +3.7/5.0
- Rent growth +3.4/5.0
- Appreciation +0.0/10.0
$399,995
🖨 Deal sheet (PDF) 📄 Offer letter ✓ Due diligence
Multi-family units
County records classify this as Multi-Family (2-4 Unit). Listing-text estimate: 2 units. confirmed
Listing remarks
Turnkey investment opportunity generating $2,500 per month in rental income with long-term tenants in place. This fully occupied duplex offers immediate income from day one and strong rental stability in a growing coastal market! Located in the heart of Holly Ridge, just minutes from Surf City beaches and conveniently positioned between Jacksonville and Wilmington, this property sits in one of Eastern North Carolina's steadily growing areas! Easy access to Hwy 17 makes commuting simple while still enjoying the relaxed coastal lifestyle that continues to draw residents to the area! Home includes a partial private fenced-in yard, adding tenant appeal and functional outdoor space! With c
Key facts
- 0.48 acre lot
- 2 garage spots
- Built 2009
Tags
Property features AI
Finance
- Other: Zoned R-15A; Lot approximately 0.48 acres (dimensions: 263.59 x 80 x 263.61 x 80); Subdivision: Sholar Estates
- Financial info: Multiple units with current rents (examples): $1,300; $1,200; $1,300; $1,200; $1,300; $1,200 (unit rents vary by unit)
Exterior
- Parking: Attached 2-car garage; On-site paved parking with 4 open spaces (6 total parking spaces)
- Security: Smoke detector(s); Security lights
- Utilities: Public water; Electricity connected; Sewer connected; Water connected
- Home design: Duplex (residential income); One level
- Construction: Vinyl siding with frame construction; Crawl space foundation; Built with shingle roof
- Exterior features: Deck; Front porch; Back yard fencing; Shingle roof; Has a view; City street and state road frontage
Interior
- Kitchen: Electric oven; Electric cooktop; Refrigerator
- Bedrooms: Multiple 3-bedroom units (each unit is a 3 bedroom)
- Flooring: Carpet; Vinyl
- Heating & cooling: Heat pump heating; Electric heating; Central air conditioning
- Interior features: Ceiling fan(s); Smoke detector(s); Security lights
- Laundry & utility: Washer; Dryer; Laundry closet; Electric water heater
Neighborhood map
What this means for you Summary
Snapshot
- This is a 2 × 3-bed/2.0-bath units multifamily listed at $400k. Condition is rated good.
Deal economics
- At list price, monthly cash flow is $289 ($3k/yr) — positive. Per door: $145/mo.
- The deal already cash-flows at list — no discount required.
- To meet the 1% rule (rent ≥ 1% of price), the offer needs to be $386k (3.4% below list).
- Recommended offer: $364k (9.0% below list) — sets the bar for market timing.
- Cap rate 7.2% vs local median 3.0% in Holly Ridge — top-decile yield for the area; either an underpriced asset or a hidden risk that comps aren't pricing in. Stress-test before assuming the spread holds.
Location & tenants
- Location reads 73/100 on livability (#78 in NC) — a middle-class / working-renter tenant base. Strengths: crime A+, employment A+, housing A+; Watch: health & safety D, amenities F, commute F.
- Onslow County Schools (other): math 42% / reading 49% proficiency, ranked #84 of 178 in NC (top 47%) — families likely to look elsewhere, expect single-tenant / working-renter base with shorter leases.
- Zoned schools: Coastal Elementary (822 students, 31% FRL); Dixon Middle (math 49% / reading 53%, grade C, #106 of 475 statewide, top 22%, 948 students, 39% FRL); Dixon High (math 62% / reading 72%, grade B, #142 of 535 statewide, top 28%, 1,149 students, 33% FRL) — zoned schools at 34% FRL track the district average.
- Zoned-school proficiency averages 59% at this address vs 46% district-wide (+14 pts) — the actual schools serving this property are materially stronger than the Onslow County Schools average implies; a family-tenant draw the district grade alone would hide.
- Market conditions: Rents rising (+3.5%/yr); 457 active listings in the ZIP; solid renter incomes; 1,246 units permitted in Onslow County in 2024 (0 in 5+ unit buildings).
- At $3,865/mo this rent would consume 55% of the median local household income ($84k/yr) (locally 131% of renters already pay >50% of income on rent) — very limited rent-growth headroom before tenants either downsize or default.
Forward outlook
- Local home prices are declining (-3.0%/yr); year-one equity from $3k of loan paydown is wiped out by about $12k of value loss. Plan a longer hold.
Negotiation context
- It's been on market 112 days — a 9% lower offer ($364k) is reasonable based on typical stale-listing flexibility.
Risks & watch-outs
- Climate carrying-cost: severe wind risk, 99% chance of damaging wind over 30y; major wildfire risk; extreme-heat days projected 7→21/yr by 2055 (HVAC capex compounding) — expect insurance premiums to compound above CPI over the hold.
Questions for the listing agent
- It's been on market 112 days. Have you received any prior offers? Is the seller open to a 9% concession, seller financing, or rate buy-down credit?
- Can we see the unit-by-unit rent roll, current vacancy, and any below-market leases? What's the average tenancy length?
- What capital expenditures (roof, boiler, parking lot, exteriors) have been made in the last 5 years, and what's planned in the next 2?
- Why hasn't it sold? Are there any deal-killer items the seller is aware of (foundation, flood, title, zoning, code violations)?
- Is there a deadline driving the sale (1031 exchange, divorce, estate, relocation)? That informs how much negotiation room exists.
- Schools are D-rated, which usually means shorter tenancies and higher turnover. Who's the typical renter profile here, and what's been the actual vacancy rate?
- The area grade is low — what's the realistic commute time and amenity access for the typical tenant pool here? Any planned neighborhood developments (good or bad) we should know about?
- What's the average days-on-market for RENTAL listings here right now (not sales)? A rising rental-DOM trend means longer vacancies and softer asking-rent achievability than the comps imply.
- What's the recent tenant-quality profile in this submarket — average credit score on applications, eviction rate, late-payment / NSF rate, and stable-employment percentage? A property-management company in the area should have these aggregated.
- How much new apartment / multifamily construction is in the pipeline within 1–3 miles? Heavy new supply (>2% of stock underway) typically softens rents 12–24 months out; light construction supports rent growth.
Investment metrics
- 1% rule
- 0.97% ✗
- Cap rate
- 7.16%
- Cash-on-cash
- 3.10%
- DSCR
- 1.14
- GRM
- 8.6
CMA / ARV
No comps found within radius.
Projected returns pro-forma
-3.0% appreciation · 3.53% rent growth · sell at horizon
- IRR
- -10.8%
- Equity multiple
- 0.60×
- Total profit
- $-44,275
- Equity at exit
- $59,641
- IRR
- -0.8%
- Equity multiple
- 0.95×
- Total profit
- $-6,015
- Equity at exit
- $34,584
Cash invested: $111,999 (down + closing). Projections, not guarantees.
Landlord ↔ Tenant lean methodology
- Overall (STATE)
- 85 Strongly Landlord-Friendly
- State North Carolina
- 85 Strongly Landlord-Friendly · R+3
- County
- — inherits STATE
- City
- — inherits STATE
ZIP-level market 28445
- Rents YoY
- 3.5%
- Active inventory
- 457
- Price-to-rent
- 17.2×
Monthly cashflow live
- Estimated rent
- $3,865 medium interval (Pro) →
- Mortgage (P&I)
- −$2,098
- Tax est. 1.5%
- −$500 /mo · $6,000/yr
- Insurance
- −$167
- HOA
- −$0
- Vacancy / Maint / Mgmt
- −$812
- Net cashflow
- $289
Break-even live
Sensitivity live
| Price | -10% $566 | -5% $427 | +0% $289 | +5% $151 | +10% $13 |
|---|---|---|---|---|---|
| Rent | -10% $-16 | -5% $136 | +0% $289 | +5% $442 | +10% $594 |
| Rate | -1.0pp $491 | -0.5pp $391 | base $289 | +0.5pp $185 | +1.0pp $80 |
2-unit breakdown (identical units grouped — click to expand)
| Units | Beds | Baths | Est. rent |
|---|---|---|---|
| 2× units | 3 | 2 | $3,864 |
| #1 | 3 | 2 | $1,932 |
| #2 | 3 | 2 | $1,932 |
| Total (2 units) | $3,865 | ||
UW: 25.0% down · 7.5% · 30yr · 1.5% tax · 5.0% vac · 8.0% maint · 8.0% mgmt
Financing live
Cash to close
- Down payment
- $99,999
- Closing costs
- $12,000
- Reserves months
- —
- Total cash needed
- —
Loan-product check · same deal, 3 products live
Conventional
25% down · 7.5% · 30yr
- Down + closing
- —
- Monthly P&I
- —
- Monthly cashflow
- —
- DSCR
- —
- Eligible?
- —
Personal DTI + credit; lowest rate.
DSCR
20% down · 8.5% · 30yr
- Down + closing
- —
- Monthly P&I
- —
- Monthly cashflow
- —
- DSCR
- —
- Eligible?
- —
No personal income docs; deal must DSCR.
Hard money
10% down · 12.0% · 12mo
- Down + closing
- —
- Monthly P&I
- —
- Monthly cashflow
- —
- DSCR
- —
- Eligible?
- —
Short-term bridge; refi at stabilization.
Listing history 15 events
-
2026-06-21days on market $399,995 Active 112 DOM
-
2026-06-19days on market $399,995 Active 110 DOM
-
2026-06-18days on market $399,995 Active 109 DOM
-
2026-06-17days on market $399,995 Active 108 DOM
-
2026-06-16days on market $399,995 Active 107 DOM
-
2026-06-15days on market $399,995 Active 106 DOM
-
2026-06-14days on market $399,995 Active 104 DOM
-
2026-06-13days on market $399,995 Active 103 DOM
-
2026-06-10days on market $399,995 Active 101 DOM
-
2026-06-09days on market $399,995 Active 100 DOM
-
2026-06-09days on market $399,995 Active 99 DOM
-
2026-06-07pricedays on market $399,995 Active 98 DOM
-
2026-05-30days on market $414,000 Active 97 DOM
-
2026-04-13price $414,000
-
2026-02-23$418,995 Active
ⓘ Source: listings_history table (triggers on properties + properties_extension) + one-shot
backfill from property_details.listing_events for pre-trigger history.
Climate risk First Street
- Flood 1/10 Low FEMA zone X (unshaded) · 0% chance over 30 yrs
- Wildfire 6/10 Major
- Heat 9/10 Extreme 7 d/yr ≥104°F today · 21 d/yr by 30 yrs out
- Wind 9/10 Extreme 99% chance of damaging wind over 30 yrs
- Air quality 2/10 Low 1 unhealthy d/yr today · 1 by 30 yrs out
Nearby sold comps map
Loading sold comps map…
Walkable amenities ~0.75 mi
Loading nearby amenities…
Taxation est. · year 1
- Rental income
- $46,380
- − Mortgage interest
- −$22,406
- − Property taxes
- −$6,000
- − Insurance
- −$2,000
- − Repairs & maintenance
- −$3,710
- − Management
- −$3,710
- − Depreciation
- −$11,636
- Taxable loss
- −$3,083
- Est. tax savings @ 24.0%
- +$740
- After-tax cash flow
- $4,209/yr
For passive investors: Depreciation is non-cash, so a rental often shows a tax loss while cash-flowing — sheltering income. Rental losses are passive: they offset passive income freely, and up to $25,000/yr can offset ordinary (W-2) income if you actively participate and your MAGI is under $100k (phasing out to $0 by $150k); unused losses carry forward. On sale, claimed depreciation is recaptured at up to 25%, and gains may owe capital-gains tax (a 1031 exchange can defer both). Figures are a year-1 estimate at your 24.0% rate — not tax advice; consult a CPA.
Condition & rehab AI · 13 photos
This fully occupied, well-maintained duplex is turnkey and ready for immediate rental income. It offers a good condition score with minimal repairs needed, making it an attractive investment opportunity.
Value-add opportunities
- Both Painting exterior siding — Enhances curb appeal and value
- Both Landscaping and shrubbery — Improves curb appeal and rental appeal
- Both New flooring in bathrooms — Enhances resale and rental appeal
- Both New kitchen appliances — Enhances resale and rental appeal
Renovation cost estimate screening
Value-add ROI direction
- Both Painting exterior siding — Enhances curb appeal and value ↑
- Both Landscaping and shrubbery — Improves curb appeal and rental appeal ↑
- Both New flooring in bathrooms — Enhances resale and rental appeal ↑
- Both New kitchen appliances — Enhances resale and rental appeal ↑
ⓘ Cost ranges are severity-bucket heuristics (US national rule-of-thumb). Get contractor quotes + a written scope before underwriting a rehab budget.
Schools (NCES district)
- District
- Onslow County Schools
- NCES district ID
- 3703450
- Math proficiency
- 42% ▲ 6.00%
- Reading proficiency
- 49% ▲ 5.00%
- Median HH income
- $46,076
- Composite
- 38.66/100
- National rank
- #4148
- State rank
- #84 of 178 in NC
Livability — Holly Ridge
- Score
- 73/100
- State rank
- #78
- US rank
- #5549
Category grades
Schools grade is shown separately in the Schools card above.
Census & demographics
- Census place
- Holly Ridge, NC
- County
- Onslow County · 164,453 people
- City population
- 10,797
- Metro
- Jacksonville, NC
- Population (ZIP)
- 10,797
- Household income
- $84,016
- Rent vs Own
- Severe rent burden
- 131.0
Population outlook (Onslow County) Hauer SSP2
- Today (2025)
- 189,789 people
- By 2030
- 194,463 · +2.5%
- By 2040
- 193,629 · +2.0%
- By 2050
- 193,248 · +1.8%
- By 2075
- 196,995 · +3.8%
- By 2100
- 201,513 · +6.2%
Race, ethnicity, and origin ACS 2023
- Neighborhood character
- Predominantly White (87%)
- Race & ethnicity
- White 87% Two or more races 6% Hispanic / Latino 4% Black 3% Native American 1%
- Common ancestry
- Slovak 6% Serbian 3% Iranian 2%
- Foreign-born
- 3% · Canada, South Korea
- Languages at home
- 97% English-only · Spanish 2%
Political lean MEDSL · Onslow
- 2024 margin
- Solid R (+35.9) · D 31.5% · R 67.5% · Other 1.0%
- 2008→2024 swing
- -14.5pp toward R · 2008: -21.5pp · 2024: -35.9pp
- All cycles
- 2024: R+35.9 2020: R+30.2 2016: R+34.6 2012: R+27.0 2008: R+21.5
Not yet ingested
- Civics
- —
Market trends
- HPI YoY
- ▼ -291.92%
- Current HPI
- 193.9949
- Rent YoY
- ▲ 3.53%
- Metro
- Jacksonville, NC
- State GDP YoY
- ▲ 3.28%
- F500 in state
- 26
Industry mix (Fortune 500 HQ in NC)
| Industry | F500 HQs | Revenue |
|---|---|---|
| Financial Services | 2 | $213B |
|
||
| Retail | 2 | $95B |
|
||
| Industrial Conglomerate | 1 | $38B |
|
||
| Metals / Steel | 1 | $35B |
|
||
| Utilities | 1 | $30B |
|
||
| Industrial Machinery | 1 | $19B |
|
||
Price history
-1.2% since first listed2 events — show timeline
- 2026-04-13 Price Changed $414,000 Hive MLS
- 2026-02-23 Listed $418,995 Hive MLS
Cash-flow waterfall
monthlySold comps — $/sqft
last 12 mo · ≤1 miLoading sold comps…