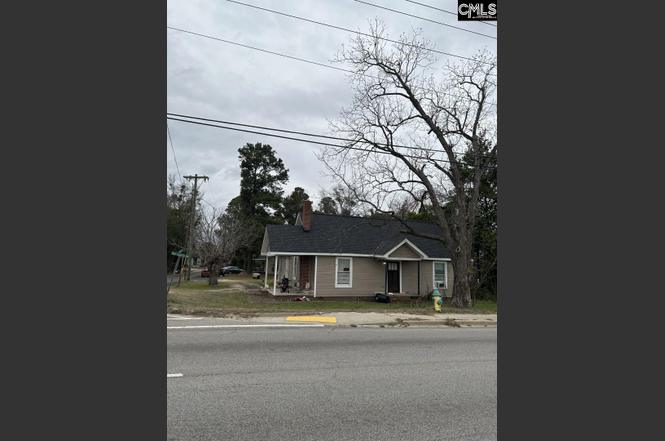
2128 Old Edisto Dr · Edisto, SC
Flood risk 1/10 · Minimal
- FEMA flood zone
- X (unshaded)
- Chance of flooding over 30 yrs
- 0.0%
- Est. flood insurance / yr
- $507 – $1,088
Fire risk 4/10 · Minor
- Est. fire insurance / yr
- $783 – $1,453
Heat risk 7/10 · Major
- Hot days now (above 107°F)
- 7 days/yr
- Hot days in 30 yrs
- 17 days/yr
Wind risk 8/10 · Major
- Chance of severe wind over 30 yrs
- 80.0%
Air-quality risk 3/10 · Minor
- Unhealthy air days now
- 3 days/yr
- Unhealthy air days in 30 yrs
- 3 days/yr
Risk factors via First Street. Map © Google.
Why this score? — see what drove the D grade
The composite is a weighted blend of 9 inputs, each scored 0–100. Each bar is that input's sub-score; the figure is the points it added to the 100-point composite (weight × sub-score).
- Cash flow +13.4/30.0
- ARV discount +7.5/15.0
- Schools +5.0/10.0
- DSCR +4.1/10.0
- Livability +2.9/5.0
- 1% rule +2.7/10.0
- Rent growth +2.5/5.0
- Condition / age +2.5/5.0
- Appreciation +0.0/10.0
$159,000
🖨 Deal sheet 📄 Offer letter ✓ Due diligence
Listing remarks
Welcome home to this beautifully updated 4 bedroom, 2 bath rental offering the perfect blend of space, comfort, and convenience. Ideally located just minutes from local schools, dining, shopping, and grocery stores, you'll enjoy quick access to everything you need. Spend your weekends exploring the scenic beauty of Edisto Memorial Gardens or take advantage of the convenience of nearby Walmart for all your household essentials. Whether you're commuting, running errands, or enjoying a night out, this home's prime location keeps you close to it all while offering the comfort of a quiet residential setting. Or if you an investor looking to add a cash flowing rental to your portfolio. Don't miss
Key facts
- Updated rental
- Prime location
- 0.41 acre lot
Tags
Property features AI
Finance
- Other: Paved road access; Approximately 0.41-acre lot
Exterior
- Utilities: Public water; Public sewer
- Home design: Single-story home
- Construction: Vinyl exterior; Crawlspace foundation
- Exterior features: Covered front porch; Additional covered porch
Interior
- Kitchen: Main-level kitchen
- Bedrooms: Master and all bedrooms located on the main level (4 bedrooms on main)
- Bathrooms: Two full bathrooms
- Heating & cooling: Central heating; Central cooling
- Interior features: Main-level layout (all primary living areas on the main floor)
- Laundry & utility: Washer and dryer located on the main level
Neighborhood map
What this means for you Summary
Snapshot
- This is a 2-bed/1.0-bath single-family listed at $159k.
Deal economics
- At list price, monthly cash flow is $4 ($53/yr) — positive.
- The deal already cash-flows at list — no discount required.
- To meet the 1% rule (rent ≥ 1% of price), the offer needs to be $123k (22.6% below list).
- Recommended offer: $123k (22.6% below list) — sets the bar for 1% rule.
Location & tenants
- Location reads 57/100 on livability (#270 in SC) — a working-class tenant base; expect higher turnover. Strengths: cost of living A+, crime B+; Watch: schools C-, amenities F, commute F.
- Market conditions: 226 active listings in the ZIP; 87 units permitted in Orangeburg County in 2024 (0 in 5+ unit buildings).
Forward outlook
- Local home prices are declining (-3.0%/yr); year-one equity from $1k of loan paydown is wiped out by about $5k of value loss. Plan a longer hold.
- Orangeburg County population projected at -27% by 2050 — secular population decline; favor cash flow + early exit over multi-decade hold.
Negotiation context
- It's been on market 109 days — a 9% lower offer ($145k) is reasonable based on typical stale-listing flexibility.
- 2 sale attempts; this cycle's ask has dropped $21k (12%) from the opening price — seller is motivated, your offer sets the floor, not the list.
Risks & watch-outs
- Watch-outs: built in 1951 — expect roof / HVAC / electrical / plumbing capex.
- Climate carrying-cost: severe wind risk, 80% chance of damaging wind over 30y; extreme-heat days projected 7→17/yr by 2055 (HVAC capex compounding) — expect insurance premiums to compound above CPI over the hold.
Questions for the listing agent
- It's been on market 109 days. Have you received any prior offers? Is the seller open to a 23% concession, seller financing, or rate buy-down credit?
- Built in 1951 — when were the roof, HVAC, electrical panel, plumbing, and water heater last replaced?
- Why hasn't it sold? Are there any deal-killer items the seller is aware of (foundation, flood, title, zoning, code violations)?
- Is there a deadline driving the sale (1031 exchange, divorce, estate, relocation)? That informs how much negotiation room exists.
- The area grade is low — what's the realistic commute time and amenity access for the typical tenant pool here? Any planned neighborhood developments (good or bad) we should know about?
- What's the average days-on-market for RENTAL listings here right now (not sales)? A rising rental-DOM trend means longer vacancies and softer asking-rent achievability than the comps imply.
- What's the recent tenant-quality profile in this submarket — average credit score on applications, eviction rate, late-payment / NSF rate, and stable-employment percentage? A property-management company in the area should have these aggregated.
- How much new for-sale + rental construction is in the pipeline within 1–3 miles? Heavy new supply typically softens prices + rents 12–24 months out; constrained supply supports both.
Investment metrics
- 1% rule
- 0.77% ✗
- Cap rate
- 6.33%
- Cash-on-cash
- 0.12%
- DSCR
- 1.01
- GRM
- 10.8
CMA / ARV
- ARV (on-the-fly)
- $66,082
- Comps found
- 1
Show comp detail 1 sale within ~0.75 mi
| Address | Dist | Beds/Ba | Sqft | Sold | Price | $/sf | Match |
|---|---|---|---|---|---|---|---|
| 515 Rosewood Dr | 0.66mi | 3/1.0 (+1) | 1,890 (+6%) | 6mo | $70,000 | $37 | 49 |
Match score weights: distance 35% · size 25% · config 20% · recency 20%. Top-matched comps best support the ARV.
Projected returns pro-forma
-3.0% appreciation · 3.0% rent growth · sell at horizon
- IRR
- -16.2%
- Equity multiple
- 0.43×
- Total profit
- $-25,548
- Equity at exit
- $23,707
- IRR
- -7.9%
- Equity multiple
- 0.50×
- Total profit
- $-22,141
- Equity at exit
- $13,747
Cash invested: $44,520 (down + closing). Projections, not guarantees.
Landlord ↔ Tenant lean methodology
- Overall (STATE)
- 90 Strongly Landlord-Friendly
- State South Carolina
- 90 Strongly Landlord-Friendly · R+6
- County
- — inherits STATE
- City
- — inherits STATE
ZIP-level market 29115
- Home prices YoY
- -27.3%
- Active inventory
- 226
- Price-to-rent
- 10.8×
Monthly cashflow live
- Estimated rent
- $1,230 medium interval (Pro) →
- Mortgage (P&I)
- −$834
- Tax from tax record
- −$67 /mo · $806/yr
- Insurance
- −$66
- HOA
- −$0
- Vacancy / Maint / Mgmt
- −$258
- Net cashflow
- $4
Break-even live
UW: 25.0% down · 7.5% · 30yr · 1.5% tax · 5.0% vac · 8.0% maint · 8.0% mgmt
Financing live
Cash to close
- Down payment
- $39,750
- Closing costs
- $4,770
- Reserves months
- —
- Total cash needed
- —
Loan-product check · same deal, 3 products live
Conventional
25% down · 7.5% · 30yr
- Down + closing
- —
- Monthly P&I
- —
- Monthly cashflow
- —
- DSCR
- —
- Eligible?
- —
Personal DTI + credit; lowest rate.
DSCR
20% down · 8.5% · 30yr
- Down + closing
- —
- Monthly P&I
- —
- Monthly cashflow
- —
- DSCR
- —
- Eligible?
- —
No personal income docs; deal must DSCR.
Hard money
10% down · 12.0% · 12mo
- Down + closing
- —
- Monthly P&I
- —
- Monthly cashflow
- —
- DSCR
- —
- Eligible?
- —
Short-term bridge; refi at stabilization.
Listing history 20 events
-
2026-06-19days on market $159,000 Active 109 DOM
-
2026-06-18price $159,000 Active 108 DOM
-
2026-06-18days on market $180,000 Active 108 DOM
-
2026-06-17days on market $180,000 Active 107 DOM
-
2026-06-16days on market $180,000 Active 106 DOM
-
2026-06-15days on market $180,000 Active 105 DOM
-
2026-06-14days on market $180,000 Active 103 DOM
-
2026-06-12days on market $180,000 Active 102 DOM
-
2026-06-09days on market $180,000 Active 99 DOM
-
2026-06-08days on market $180,000 Active 98 DOM
-
2026-06-07days on market $180,000 Active 97 DOM
-
2026-06-07days on market $180,000 Active 96 DOM
-
2026-06-04days on market $180,000 Active 93 DOM
-
2026-06-02days on market $180,000 Active 92 DOM
-
2026-06-01days on market $180,000 Active 91 DOM
-
2026-05-31days on market $180,000 Active 90 DOM
-
2026-05-31days on market $180,000 Active 89 DOM
-
2026-03-02$180,000 Active
-
2025-06-01historical
-
2025-02-14$180,000 Active
ⓘ Source: listings_history table (triggers on properties + properties_extension) + one-shot
backfill from property_details.listing_events for pre-trigger history.
Tax reassessment forecast SC · Resets to sale price
- Current annual tax
- $806 · $67/mo
- Projected year-2 tax
- $906 · $76/mo
- Expected delta
- +$100/yr (+$8/mo · 12.4%)
ⓘ Screening estimate from a state-policy table — verify with the county assessor before closing.
Climate risk First Street
- Flood 1/10 Low FEMA zone X (unshaded) · 0% chance over 30 yrs
- Wildfire 4/10 Moderate
- Heat 7/10 Severe 7 d/yr ≥107°F today · 17 d/yr by 30 yrs out
- Wind 8/10 Severe 80% chance of damaging wind over 30 yrs
- Air quality 3/10 Moderate 3 unhealthy d/yr today · 3 by 30 yrs out
Nearby sold comps map
Loading sold comps map…
Walkable amenities ~0.75 mi
Loading nearby amenities…
Taxation est. · year 1
- Rental income
- $14,759
- − Mortgage interest
- −$8,906
- − Property taxes
- −$806
- − Insurance
- −$795
- − Repairs & maintenance
- −$1,181
- − Management
- −$1,181
- − Depreciation
- −$4,625
- Taxable loss
- −$2,736
- Est. tax savings @ 24.0%
- +$657
- After-tax cash flow
- $709/yr
For passive investors: Depreciation is non-cash, so a rental often shows a tax loss while cash-flowing — sheltering income. Rental losses are passive: they offset passive income freely, and up to $25,000/yr can offset ordinary (W-2) income if you actively participate and your MAGI is under $100k (phasing out to $0 by $150k); unused losses carry forward. On sale, claimed depreciation is recaptured at up to 25%, and gains may owe capital-gains tax (a 1031 exchange can defer both). Figures are a year-1 estimate at your 24.0% rate — not tax advice; consult a CPA.
Schools (NCES district)
No district data.
Livability — Edisto
- Score
- 57/100
- State rank
- #270
- US rank
- #21693
Category grades
Schools grade is shown separately in the Schools card above.
Census & demographics
- Census place
- Edisto, SC
- Population (ZIP)
- 27,179
Population outlook (Orangeburg County) Hauer SSP2
- Today (2025)
- 82,698 people
- By 2030
- 78,615 · -4.9%
- By 2040
- 69,308 · -16.2%
- By 2050
- 60,629 · -26.7%
- By 2075
- 42,678 · -48.4%
- By 2100
- 28,136 · -66.0%
Race, ethnicity, and origin ACS 2023
- Neighborhood character
- Predominantly Black (76%)
- Race & ethnicity
- Black 76% White 20% Hispanic / Latino 2% Two or more races 2%
- Foreign-born
- 2% · Canada
- Languages at home
- 97% English-only · Spanish 2%
Political lean MEDSL · Orangeburg
- 2024 margin
- Strong D (+24.6) · D 61.8% · R 37.2% · Other 1.1%
- 2008→2024 swing
- -13.5pp toward R · 2008: 38.1pp · 2024: 24.6pp
- All cycles
- 2024: D+24.6 2020: D+33.2 2016: D+37.0 2012: D+43.5 2008: D+38.1
Not yet ingested
- Civics
- —
Market trends
- HPI YoY
- ▼ -56.65%
- Current HPI
- 150.823
- Rent YoY
- —
- Metro
- —
- State GDP YoY
- ▲ 4.51%
- F500 in state
- 2
Industry mix (Fortune 500 HQ in SC)
| Industry | F500 HQs | Revenue |
|---|---|---|
| Packaging | 1 | $7B |
|
||
Price history
+0.0% since first listed3 events — show timeline
- 2026-03-02 Listed $180,000 Consolidated MLS
- 2025-06-01 Delisted — Consolidated MLS
- 2025-02-14 Listed $180,000 Consolidated MLS
Property tax history
+0.6%/yrLatest (2024): $806 · +17.7% YoY. Source: county tax records.
Cash-flow waterfall
monthlySold comps — $/sqft
last 12 mo · ≤1 miLoading sold comps…