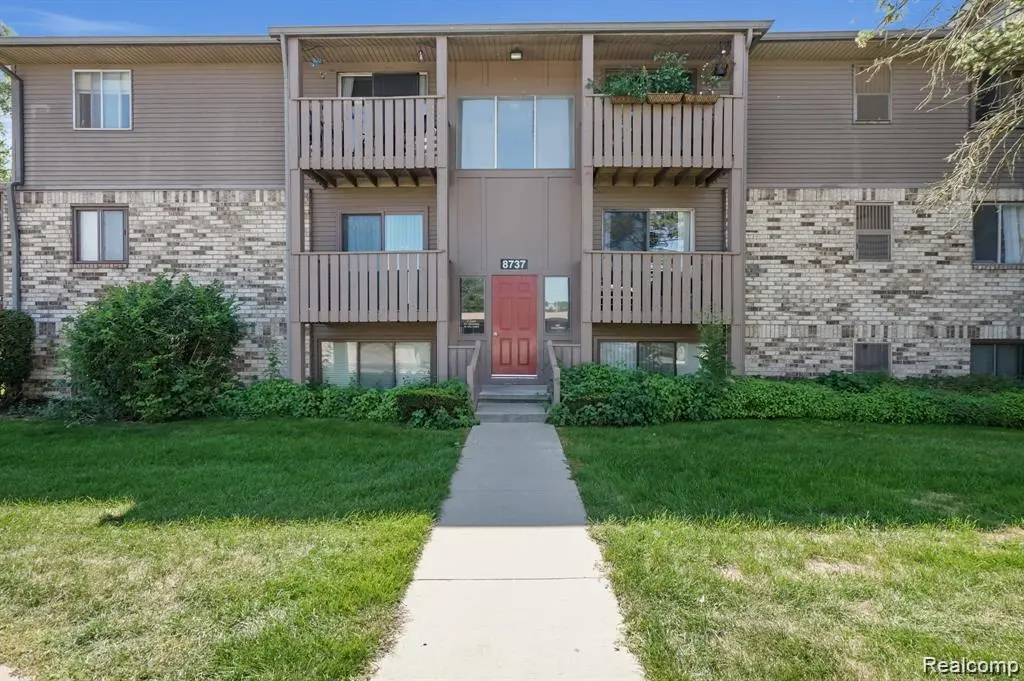
8737 Green Willow St #9 · Brighton, MI
Flood risk 1/10 · Minimal
- FEMA flood zone
- X (unshaded)
- Chance of flooding over 30 yrs
- 0.0%
- Est. flood insurance / yr
- $507 – $1,088
Fire risk 1/10 · Minimal
- Est. fire insurance / yr
- $784 – $1,456
Heat risk 3/10 · Minor
- Hot days now (above 96°F)
- 7 days/yr
- Hot days in 30 yrs
- 15 days/yr
Wind risk 2/10 · Minimal
- Chance of severe wind over 30 yrs
- —
Air-quality risk 2/10 · Minimal
- Unhealthy air days now
- 1 days/yr
- Unhealthy air days in 30 yrs
- 2 days/yr
Risk factors via First Street. Map © Google.
Why this score? — see what drove the B grade
The composite is a weighted blend of 9 inputs, each scored 0–100. Each bar is that input's sub-score; the figure is the points it added to the 100-point composite (weight × sub-score).
- Cash flow +30.0/30.0
- 1% rule +10.0/10.0
- DSCR +10.0/10.0
- ARV discount +7.5/15.0
- Schools +5.8/10.0
- Livability +3.9/5.0
- Rent growth +2.5/5.0
- Condition / age +2.5/5.0
- Appreciation +0.0/10.0
$85,000
🖨 Deal sheet 📄 Offer letter ✓ Due diligence
Listing remarks MLS
Perfect for investors or handy buyers looking to add value! This upper-level unit overlooking the pond offers 2-bedrooms, 1-bath, a private balcony and is ideally located in the heart of downtown Brighton. Association fees cover exterior maintenance, snow removal, garbage, water, sewer, and access to the common-area laundry facilities for added convenience. Enjoy a prime location just minutes from Main Street restaurants and shops, Mt. Brighton Ski Resort, and easy highway access. Great potential for rental income, renovation, or affordable homeownership opportunity!
Key facts
- Private balcony
- Prime location
- $278 HOA
Tags
Property features AI
Finance
- Other: Pets allowed (number limit applies)
- Financial info: Annual property tax reported
- HOA & community: Homeowners association with monthly fee of $278; HOA covers grounds and structure maintenance, sewer, snow removal, trash, and water
Exterior
- Parking: No garage; Carport
- Utilities: Public water; Public sewer
- Home design: Condominium; One story; Ground-level entry with steps; Hidden Harbor Condo subdivision; Faces unspecified
- Construction: Brick and wood siding exterior; Asphalt roof; Slab foundation; Built area above grade: 733 (units recorded in source)
- Exterior features: Paved private road with private maintenance; Sidewalks
Interior
- Bathrooms: 1 full bathroom
- Heating & cooling: Central air conditioning; Forced air heating; Natural gas heating
- Interior features: 5 total rooms; Deck
- Laundry & utility: Common area laundry
Neighborhood map
What this means for you Summary
Snapshot
- This is a 2-bed/1.0-bath condo listed at $85k.
Deal economics
- At list price, monthly cash flow is $677 ($8k/yr) — positive.
- The deal already cash-flows at list — no discount required.
- Meets the 1% rule at list price ($2k rent vs $85k).
- Cap rate 15.9% vs local median 3.2% in Brighton — top-decile yield for the area; either an underpriced asset or a hidden risk that comps aren't pricing in. Stress-test before assuming the spread holds.
Location & tenants
- Location reads 78/100 on livability (#108 in MI, #2,621 nationally) — a middle-class / working-renter tenant base. Strengths: cost of living A+, housing A+, health & safety A+; Watch: amenities F, commute F.
- Brighton Area Schools (suburban): math 59% / reading 69% proficiency, ranked #22 of 540 in MI (top 4%) — acceptable for families but not a draw, mixed tenant base, ~2y average lease; only 10% free/reduced lunch — higher-income household profile.
- Market conditions: 178 active listings in the ZIP; 6 comparable units currently listed for rent nearby; rentals at typical pace (median 17d on market — plan ~3-4 weeks tenant-placement turnaround); solid renter incomes; 488 units permitted in Livingston County in 2024 (0 in 5+ unit buildings).
Forward outlook
- Local home prices are declining (-3.0%/yr); year-one equity from $588 of loan paydown is wiped out by about $3k of value loss. Plan a longer hold.
- Livingston County population projected at +7% by 2050 — modest demand growth; plan on rents tracking national, not racing it.
- At projected returns (-3.0% appreciation + 3.0% rent growth), your $24k cash investment doubles in ~4 years — after that, you're playing with house money.
Negotiation context
- Only 14 days on market — expect competitive offers; lowballing is unlikely to land.
- 2 sale attempts with the ask held roughly flat each time — persistent listings suggest the price (not the market) is what's stuck; bring a comps-based counter.
Questions for the listing agent
- Built in 1978 — when were the roof, HVAC, electrical panel, plumbing, and water heater last replaced?
- What does the HOA fee cover, when was the last increase, and are there any pending special assessments or reserve-fund shortfalls?
- Any open or pending special assessments — roof, HVAC, plumbing, elevator, façade? What's the per-unit balance and payoff schedule, and is the seller paying it off at close or rolling it to the buyer?
- Is there a deadline driving the sale (1031 exchange, divorce, estate, relocation)? That informs how much negotiation room exists.
- Schools are A-rated — typically a magnet for longer-tenancy family renters. What's the average tenant stay here, and is there a school-zone premium baked into asking?
- What's the average days-on-market for RENTAL listings here right now (not sales)? A rising rental-DOM trend means longer vacancies and softer asking-rent achievability than the comps imply.
- What's the recent tenant-quality profile in this submarket — average credit score on applications, eviction rate, late-payment / NSF rate, and stable-employment percentage? A property-management company in the area should have these aggregated.
- How much new apartment / multifamily construction is in the pipeline within 1–3 miles? Heavy new supply (>2% of stock underway) typically softens rents 12–24 months out; light construction supports rent growth.
Investment metrics
- 1% rule
- 2.24% ✓
- Cap rate
- 15.85%
- Cash-on-cash
- 34.14%
- DSCR
- 2.52
- GRM
- 3.7
CMA / ARV
No comps found within radius.
Projected returns pro-forma
-3.0% appreciation · 3.0% rent growth · sell at horizon
- IRR
- 29.6%
- Equity multiple
- 2.24×
- Total profit
- $29,526
- Equity at exit
- $12,674
- IRR
- 37.0%
- Equity multiple
- 4.44×
- Total profit
- $81,957
- Equity at exit
- $7,349
Cash invested: $23,800 (down + closing). Projections, not guarantees.
Landlord ↔ Tenant lean methodology
- Overall (STATE)
- 62 Landlord-Friendly
- State Michigan
- 62 Landlord-Friendly · EVEN
- County
- — inherits STATE
- City
- — inherits STATE
ZIP-level market 48116
- Active inventory
- 178
- Price-to-rent
- 3.7×
Monthly cashflow live
- Estimated rent
- $1,905 high interval (Pro) →
- Mortgage (P&I)
- −$446
- Tax from tax record
- −$69 /mo · $828/yr
- Insurance
- −$35
- HOA
- −$278
- Vacancy / Maint / Mgmt
- −$400
- Net cashflow
- $677
Break-even live
UW: 25.0% down · 7.5% · 30yr · 1.5% tax · 5.0% vac · 8.0% maint · 8.0% mgmt
Financing live
Cash to close
- Down payment
- $21,250
- Closing costs
- $2,550
- Reserves months
- —
- Total cash needed
- —
Loan-product check · same deal, 3 products live
Conventional
25% down · 7.5% · 30yr
- Down + closing
- —
- Monthly P&I
- —
- Monthly cashflow
- —
- DSCR
- —
- Eligible?
- —
Personal DTI + credit; lowest rate.
DSCR
20% down · 8.5% · 30yr
- Down + closing
- —
- Monthly P&I
- —
- Monthly cashflow
- —
- DSCR
- —
- Eligible?
- —
No personal income docs; deal must DSCR.
Hard money
10% down · 12.0% · 12mo
- Down + closing
- —
- Monthly P&I
- —
- Monthly cashflow
- —
- DSCR
- —
- Eligible?
- —
Short-term bridge; refi at stabilization.
Rent comps 6 comps
| Address | Beds | Baths | Sqft | Rent | $/sqft | DOM | Units | Dist |
|---|---|---|---|---|---|---|---|---|
| 700 N 2nd St Brighton, MI | 1.0–3.0 | 1.0–2.0 | 1039 | $2,550 | $2.45 | 1d | 1 | 0.06mi |
| 8719 Meadowbrook Dr Brighton, MI | 1.0 | 1.0 | 566 | $1,075 | $1.90 | 16d | 1 | 0.08mi |
| 8699 Meadowbrook Dr Brighton, MI | 1.0–2.0 | 1.0 | 700 | $1,450 | $2.07 | 1d | 8 | 0.12mi |
| 619 Flint Rd Apt 1 Brighton, MI | 1.0 | 1.0 | 700 | $1,145 | $1.64 | 43d | 1 | 0.16mi |
| 898 E Grand River Ave Brighton, MI | 1.0–2.0 | 1.0 | 740 | $1,295 | $1.75 | 1d | 1 | 1.16mi |
| 8145 W Grand River Ave Unit 2 Brighton, MI | 1.0 | 1.0 | 750 | $1,300 | $1.73 | 23d | 1 | 1.27mi |
HOA detail condo
- Monthly dues
- $278 · $3,336/yr
- Likely covers
- watersewertrashsnow removalexterior maint.
- Assessments
- None detected in remarks — confirm with the listing agent.
Listing history 9 events
-
2026-06-08status $85,000 Pending 14 DOM
-
2026-06-07days on market $85,000 Active 14 DOM
-
2026-06-04days on market $85,000 Active 11 DOM
-
2026-06-03days on market $85,000 Active 10 DOM
-
2026-06-02days on market $85,000 Active 9 DOM
-
2026-06-01days on market $85,000 Active 8 DOM
-
2026-05-31days on market $85,000 Active 7 DOM
-
2026-05-24$85,000 Active
Show marketing remark (573 chars)
Perfect for investors or handy buyers looking to add value! This upper-level unit overlooking the pond offers 2-bedrooms, 1-bath, a private balcony and is ideally located in the heart of downtown Brighton. Association fees cover exterior maintenance, snow removal, garbage, water, sewer, and access to the common-area laundry facilities for added convenience. Enjoy a prime location just minutes from Main Street restaurants and shops, Mt. Brighton Ski Resort, and easy highway access. Great potential for rental income, renovation, or affordable homeownership opportunity!
-
2026-05-24$85,000 Active 573-char remark
Show marketing remark (573 chars)
Perfect for investors or handy buyers looking to add value! This upper-level unit overlooking the pond offers 2-bedrooms, 1-bath, a private balcony and is ideally located in the heart of downtown Brighton. Association fees cover exterior maintenance, snow removal, garbage, water, sewer, and access to the common-area laundry facilities for added convenience. Enjoy a prime location just minutes from Main Street restaurants and shops, Mt. Brighton Ski Resort, and easy highway access. Great potential for rental income, renovation, or affordable homeownership opportunity!
ⓘ Source: listings_history table (triggers on properties + properties_extension) + one-shot
backfill from property_details.listing_events for pre-trigger history.
Tax reassessment forecast MI · Partial reset (capped growth)
- Current annual tax
- $828 · $69/mo
- Projected year-2 tax
- $1,068 · $89/mo
- Expected delta
- +$241/yr (+$20/mo · 29.1%)
ⓘ Screening estimate from a state-policy table — verify with the county assessor before closing.
Climate risk First Street
- Flood 1/10 Low FEMA zone X (unshaded) · 0% chance over 30 yrs
- Wildfire 1/10 Low
- Heat 3/10 Moderate 7 d/yr ≥96°F today · 15 d/yr by 30 yrs out
- Wind 2/10 Low
- Air quality 2/10 Low 1 unhealthy d/yr today · 2 by 30 yrs out
Nearby sold comps map
Loading sold comps map…
Walkable amenities ~0.75 mi
Loading nearby amenities…
Taxation est. · year 1
- Rental income
- $22,864
- − Mortgage interest
- −$4,761
- − Property taxes
- −$828
- − Insurance
- −$425
- − Repairs & maintenance
- −$1,829
- − Management
- −$1,829
- − HOA
- −$3,336
- − Depreciation
- −$2,473
- Taxable income
- $7,383
- Est. tax owed @ 24.0%
- −$1,772
- After-tax cash flow
- $6,353/yr
For passive investors: Depreciation is non-cash, so a rental often shows a tax loss while cash-flowing — sheltering income. Rental losses are passive: they offset passive income freely, and up to $25,000/yr can offset ordinary (W-2) income if you actively participate and your MAGI is under $100k (phasing out to $0 by $150k); unused losses carry forward. On sale, claimed depreciation is recaptured at up to 25%, and gains may owe capital-gains tax (a 1031 exchange can defer both). Figures are a year-1 estimate at your 24.0% rate — not tax advice; consult a CPA.
Schools (NCES district)
- District
- Brighton Area Schools
- NCES district ID
- 2606870
- Math proficiency
- 59% ▼ -3.00%
- Reading proficiency
- 69% ▼ -2.00%
- Median HH income
- $84,114
- Composite
- 57.62/100
- National rank
- #1062
- State rank
- #22 of 540 in MI
Livability — Brighton
- Score
- 78/100
- State rank
- #108
- US rank
- #2621
Category grades
Schools grade is shown separately in the Schools card above.
Census & demographics
- Census place
- Brighton, MI
- County
- Livingston County · 121,626 people
- City population
- 27,289
- Metro
- Detroit-Warren-Dearborn, MI
- Population (ZIP)
- 27,289
- Household income
- $106,763
- Rent vs Own
- Severe rent burden
- 495.0
Population outlook (Livingston County) Hauer SSP2
- Today (2025)
- 202,920 people
- By 2030
- 209,173 · +3.1%
- By 2040
- 216,878 · +6.9%
- By 2050
- 217,485 · +7.2%
- By 2075
- 217,590 · +7.2%
- By 2100
- 197,095 · -2.9%
Race, ethnicity, and origin ACS 2023
- Neighborhood character
- Predominantly White (93%)
- Race & ethnicity
- White 93% Two or more races 4% Hispanic / Latino 2% Asian 1%
- Common ancestry
- Romanian 12% Italian 6% Lithuanian 4%
- Foreign-born
- 4% · Canada, China
- Languages at home
- 96% English-only · Other Indo-European 1% German/W. Germanic 1% Russian/Polish/Slavic 1%
Political lean MEDSL · Livingston
- 2024 margin
- Strong R (+23.9) · D 37.4% · R 61.3% · Other 1.3%
- 2008→2024 swing
- -10.7pp toward R · 2008: -13.3pp · 2024: -23.9pp
- All cycles
- 2024: R+23.9 2020: R+22.6 2016: R+29.6 2012: R+23.3 2008: R+13.3
Not yet ingested
- Civics
- —
Market trends
- HPI YoY
- ▼ -300.62%
- Current HPI
- 183.6902
- Rent YoY
- —
- Metro
- Detroit-Warren-Dearborn, MI
- State GDP YoY
- ▲ 1.37%
- F500 in state
- 28
Industry mix (Fortune 500 HQ in MI)
| Industry | F500 HQs | Revenue |
|---|---|---|
| Automotive Parts | 3 | $48B |
|
||
| Automotive | 2 | $372B |
|
||
| Chemicals | 1 | $45B |
|
||
| Automotive Retail | 1 | $29B |
|
||
| Healthcare / Medical Devices | 1 | $23B |
|
||
| Automotive Technology | 1 | $20B |
|
||
Price history
+0.0% since first listed2 events — show timeline
- 2026-05-24 Listed $85,000 REALCOMP
- 2026-05-24 Listed $85,000 MiRealSource-MiMLS
Property tax history
+1.7%/yrLatest (2025): $828 · -5.5% YoY. Source: county tax records.
Cash-flow waterfall
monthlySold comps — $/sqft
last 12 mo · ≤1 miLoading sold comps…