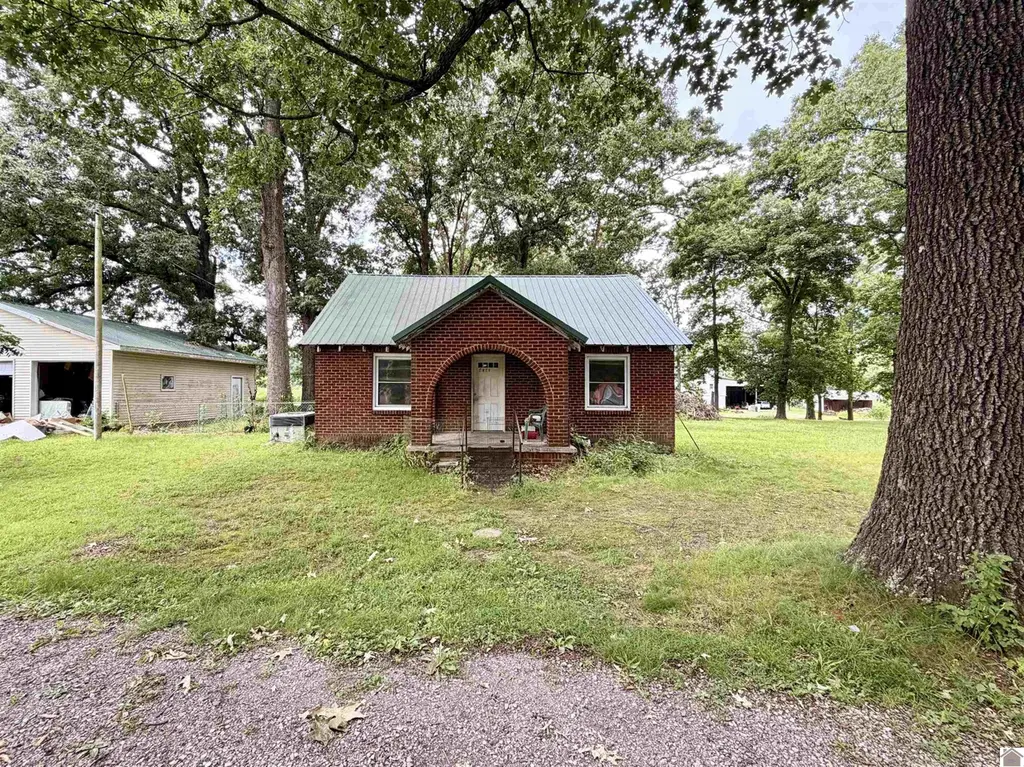
4791 Radio Rd · Dexter, KY
Flood risk 1/10 · Minimal
- FEMA flood zone
- X (unshaded)
- Chance of flooding over 30 yrs
- 0.0%
- Est. flood insurance / yr
- $507 – $1,088
Fire risk 3/10 · Minor
- Est. fire insurance / yr
- $839 – $1,559
Heat risk 6/10 · Moderate
- Hot days now (above 109°F)
- 7 days/yr
- Hot days in 30 yrs
- 20 days/yr
Wind risk 4/10 · Minor
- Chance of severe wind over 30 yrs
- 9.0%
Air-quality risk 1/10 · Minimal
- Unhealthy air days now
- 0 days/yr
- Unhealthy air days in 30 yrs
- 0 days/yr
Risk factors via First Street. Map © Google.
Why this score? — see what drove the B+ grade
The composite is a weighted blend of 9 inputs, each scored 0–100. Each bar is that input's sub-score; the figure is the points it added to the 100-point composite (weight × sub-score).
- Cash flow +30.0/30.0
- ARV discount +15.0/15.0
- DSCR +10.0/10.0
- 1% rule +9.6/10.0
- Schools +3.8/10.0
- Livability +3.0/5.0
- Appreciation +2.6/10.0
- Rent growth +2.5/5.0
- Condition / age +2.5/5.0
$75,000
🖨 Deal sheet 📄 Offer letter ✓ Due diligence
Listing remarks
Opportunity awaits with this 2-bedroom, 1-bath brick home situated on a spacious 1.13 acre lot on the outskirts of Murray! Featuring a durable brick exterior, detached 2-bay garage, and a fenced backyard, this property offers plenty of potential for investors looking to add to their portfolio or buyers looking to add their personal touch. Whether you're searching for your next investment opportunity or a home with great potential, this is worth the look!
Key facts
- Brick exterior
- Fenced backyard
- 1.13 acre lot
Tags
Property features AI
Exterior
- Parking: Detached 2-car garage
- Utilities: Public water; Septic tank; Natural gas available
- Home design: Single-family residence; Residential property
- Construction: Frame construction; Metal roof
- Exterior features: Level lot
Interior
- Kitchen: Microwave; Refrigerator; Cooktop
- Flooring: Laminate; Tile; Wood
- Bathrooms: 1 full bathroom
- Heating & cooling: Central air conditioning
- Interior features: Microwave; Refrigerator; Cooktop; Electric water heater; Crawl space basement
Neighborhood map
What this means for you Summary
Snapshot
- This is a 2-bed/1.0-bath single-family listed at $75k.
Deal economics
- At list price, monthly cash flow is $359 ($4k/yr) — positive.
- The deal already cash-flows at list — no discount required.
- Meets the 1% rule at list price ($1k rent vs $75k).
Location & tenants
- Location reads 59/100 on livability (#425 in KY) — a working-class tenant base; expect higher turnover. Strengths: cost of living A+, housing A-; Watch: employment D, schools F, amenities F.
- Calloway County (town): math 44% / reading 48% proficiency, ranked #19 of 165 in KY (top 12%) — families likely to look elsewhere, expect single-tenant / working-renter base with shorter leases.
- Market conditions: 10 active listings in the ZIP; 81 units permitted in Calloway County in 2024 (66 in 5+ unit buildings).
Forward outlook
- Local home prices are declining (-3.0%/yr); year-one equity from $519 of loan paydown is wiped out by about $2k of value loss. Plan a longer hold.
- Calloway County population projected at +18% by 2050 — long-run rental-demand tailwind backs the buy-and-hold thesis.
- At projected returns (-3.0% appreciation + 3.0% rent growth), your $21k cash investment doubles in ~6 years — after that, you're playing with house money.
Negotiation context
- Only 7 days on market — expect competitive offers; lowballing is unlikely to land.
- Current owner paid $32k; list at $75k implies a 134% gain — meaningful room to come down on a strong offer.
Risks & watch-outs
- Climate carrying-cost: extreme-heat days projected 7→20/yr by 2055 (HVAC capex compounding) — expect insurance premiums to compound above CPI over the hold.
Questions for the listing agent
- Is there a deadline driving the sale (1031 exchange, divorce, estate, relocation)? That informs how much negotiation room exists.
- Schools are F-rated, which usually means shorter tenancies and higher turnover. Who's the typical renter profile here, and what's been the actual vacancy rate?
- What's the average days-on-market for RENTAL listings here right now (not sales)? A rising rental-DOM trend means longer vacancies and softer asking-rent achievability than the comps imply.
- What's the recent tenant-quality profile in this submarket — average credit score on applications, eviction rate, late-payment / NSF rate, and stable-employment percentage? A property-management company in the area should have these aggregated.
- How much new for-sale + rental construction is in the pipeline within 1–3 miles? Heavy new supply typically softens prices + rents 12–24 months out; constrained supply supports both.
Investment metrics
- 1% rule
- 1.46% ✓
- Cap rate
- 12.03%
- Cash-on-cash
- 20.50%
- DSCR
- 1.91
- GRM
- 5.7
CMA / ARV
- ARV (on-the-fly)
- $128,352
- Comps found
- 3
Show comp detail 3 sales within ~0.75 mi
| Address | Dist | Beds/Ba | Sqft | Sold | Price | $/sf | Match |
|---|---|---|---|---|---|---|---|
| 35 Wadesboro Rd | 0.19mi | 2/1.0 | 1,404 (+5%) | 7mo | $135,000 | $96 | 77 |
| 4419 Radio Rd | 0.36mi | 3/2.0 (+1) | 1,441 (+8%) | 13mo | $185,000 | $128 | 51 |
| 278 Charley Miller Rd | 0.71mi | 2/1.0 | 1,256 (-6%) | 19mo | $102,000 | $81 | 41 |
Match score weights: distance 35% · size 25% · config 20% · recency 20%. Top-matched comps best support the ARV.
Projected returns pro-forma
-3.0% appreciation · 3.0% rent growth · sell at horizon
- IRR
- 12.8%
- Equity multiple
- 1.51×
- Total profit
- $10,710
- Equity at exit
- $11,183
- IRR
- 21.7%
- Equity multiple
- 2.85×
- Total profit
- $38,794
- Equity at exit
- $6,485
Cash invested: $21,000 (down + closing). Projections, not guarantees.
Landlord ↔ Tenant lean methodology
- Overall (STATE)
- 83 Strongly Landlord-Friendly
- State Kentucky
- 83 Strongly Landlord-Friendly · R+16
- County
- — inherits STATE
- City
- — inherits STATE
ZIP-level market 42036
- Home prices YoY
- -2.4%
- Active inventory
- 10
- Price-to-rent
- 5.7×
Monthly cashflow live
- Estimated rent
- $1,097 medium interval (Pro) →
- Mortgage (P&I)
- −$393
- Tax from tax record
- −$83 /mo · $1,000/yr
- Insurance
- −$31
- HOA
- −$0
- Vacancy / Maint / Mgmt
- −$230
- Net cashflow
- $359
Break-even live
UW: 25.0% down · 7.5% · 30yr · 1.5% tax · 5.0% vac · 8.0% maint · 8.0% mgmt
Financing live
Cash to close
- Down payment
- $18,750
- Closing costs
- $2,250
- Reserves months
- —
- Total cash needed
- —
Loan-product check · same deal, 3 products live
Conventional
25% down · 7.5% · 30yr
- Down + closing
- —
- Monthly P&I
- —
- Monthly cashflow
- —
- DSCR
- —
- Eligible?
- —
Personal DTI + credit; lowest rate.
DSCR
20% down · 8.5% · 30yr
- Down + closing
- —
- Monthly P&I
- —
- Monthly cashflow
- —
- DSCR
- —
- Eligible?
- —
No personal income docs; deal must DSCR.
Hard money
10% down · 12.0% · 12mo
- Down + closing
- —
- Monthly P&I
- —
- Monthly cashflow
- —
- DSCR
- —
- Eligible?
- —
Short-term bridge; refi at stabilization.
Listing history 7 events
-
2026-06-19days on market $75,000 Active 7 DOM
-
2026-06-18days on market $75,000 Active 6 DOM
-
2026-06-17days on market $75,000 Active 5 DOM
-
2026-06-16days on market $75,000 Active 4 DOM
-
2026-06-15days on market $75,000 Active 3 DOM
-
2026-06-12remarks 458-char remark
-
2026-06-12$75,000 Active 1 DOM
ⓘ Source: listings_history table (triggers on properties + properties_extension) + one-shot
backfill from property_details.listing_events for pre-trigger history.
Tax reassessment forecast KY · Resets to sale price
- Current annual tax
- $1,000 · $83/mo
- Projected year-2 tax
- $1,000 · $83/mo
- Expected delta
- $0/yr ($0/mo · 0.0%)
ⓘ Screening estimate from a state-policy table — verify with the county assessor before closing.
Climate risk First Street
- Flood 1/10 Low FEMA zone X (unshaded) · 0% chance over 30 yrs
- Wildfire 3/10 Moderate
- Heat 6/10 Major 7 d/yr ≥109°F today · 20 d/yr by 30 yrs out
- Wind 4/10 Moderate 9% chance of damaging wind over 30 yrs
- Air quality 1/10 Low 0 unhealthy d/yr today · 0 by 30 yrs out
Nearby sold comps map
Loading sold comps map…
Walkable amenities ~0.75 mi
Loading nearby amenities…
Taxation est. · year 1
- Rental income
- $13,165
- − Mortgage interest
- −$4,201
- − Property taxes
- −$1,000
- − Insurance
- −$375
- − Repairs & maintenance
- −$1,053
- − Management
- −$1,053
- − Depreciation
- −$2,182
- Taxable income
- $3,301
- Est. tax owed @ 24.0%
- −$792
- After-tax cash flow
- $3,514/yr
For passive investors: Depreciation is non-cash, so a rental often shows a tax loss while cash-flowing — sheltering income. Rental losses are passive: they offset passive income freely, and up to $25,000/yr can offset ordinary (W-2) income if you actively participate and your MAGI is under $100k (phasing out to $0 by $150k); unused losses carry forward. On sale, claimed depreciation is recaptured at up to 25%, and gains may owe capital-gains tax (a 1031 exchange can defer both). Figures are a year-1 estimate at your 24.0% rate — not tax advice; consult a CPA.
Schools (NCES district)
- District
- Calloway County
- NCES district ID
- 2100870
- Math proficiency
- 44% ▼ -12.00%
- Reading proficiency
- 48% ▼ -13.00%
- Median HH income
- $38,849
- Composite
- 38.39/100
- National rank
- #4208
- State rank
- #19 of 165 in KY
Livability — Dexter
- Score
- 59/100
- State rank
- #425
- US rank
- #20528
Category grades
Schools grade is shown separately in the Schools card above.
Census & demographics
- Census place
- Dexter, KY
- Population (ZIP)
- 1,289
Population outlook (Calloway County) Hauer SSP2
- Today (2025)
- 41,071 people
- By 2030
- 42,608 · +3.7%
- By 2040
- 45,435 · +10.6%
- By 2050
- 48,501 · +18.1%
- By 2075
- 56,481 · +37.5%
- By 2100
- 63,271 · +54.1%
Race, ethnicity, and origin ACS 2023
- Neighborhood character
- Predominantly White (95%)
- Race & ethnicity
- White 95% Hispanic / Latino 5%
- Common ancestry
- Italian 8% Portuguese 1% Romanian 1%
- Foreign-born
- 5% · Canada
Political lean MEDSL · Calloway
- 2024 margin
- Solid R (+38.0) · D 30.2% · R 68.1% · Other 1.7%
- 2008→2024 swing
- -19.6pp toward R · 2008: -18.4pp · 2024: -38.0pp
- All cycles
- 2024: R+38.0 2020: R+31.8 2016: R+35.0 2012: R+27.4 2008: R+18.4
Not yet ingested
- Civics
- —
Market trends
- HPI YoY
- ▼ -4.77%
- Current HPI
- 191.5
- Rent YoY
- —
- Metro
- —
- State GDP YoY
- ▲ 1.81%
- F500 in state
- 4
Industry mix (Fortune 500 HQ in KY)
| Industry | F500 HQs | Revenue |
|---|---|---|
| Healthcare | 1 | $118B |
|
||
| Food / Beverage | 1 | $7B |
|
||
Price history
+134.4% since first listed2 events — show timeline
- 2026-06-12 Listed $75,000 WKRMLS
- 1998-04-01 Sold (Public Records) $32,000 Public Records
Property tax history
+5.8%/yrLatest (2025): $1,000 · +166.5% YoY. Source: county tax records.
Cash-flow waterfall
monthlySold comps — $/sqft
last 12 mo · ≤1 miLoading sold comps…