774 Guernsey Rd · La Marque, TX
Flood risk No data
- FEMA flood zone
- —
- Chance of flooding over 30 yrs
- —
- Est. flood insurance / yr
- —
Fire risk No data
- Est. fire insurance / yr
- —
Heat risk No data
- Hot days now (above threshold)
- —
- Hot days in 30 yrs
- —
Wind risk No data
- Chance of severe wind over 30 yrs
- —
Air-quality risk No data
- Unhealthy air days now
- —
- Unhealthy air days in 30 yrs
- —
Risk factors via First Street. Map © Google.
Why this score? — see what drove the F grade
The composite is a weighted blend of 9 inputs, each scored 0–100. Each bar is that input's sub-score; the figure is the points it added to the 100-point composite (weight × sub-score).
- Cash flow +12.9/30.0
- DSCR +3.9/10.0
- Rent growth +3.5/5.0
- ARV discount +3.3/15.0
- Livability +3.0/5.0
- 1% rule +2.8/10.0
- Schools +2.6/10.0
- Condition / age +2.5/5.0
- Appreciation +0.0/10.0
$325,900
🖨 Deal sheet (PDF) 📄 Offer letter ✓ Due diligence
Listing remarks MLS
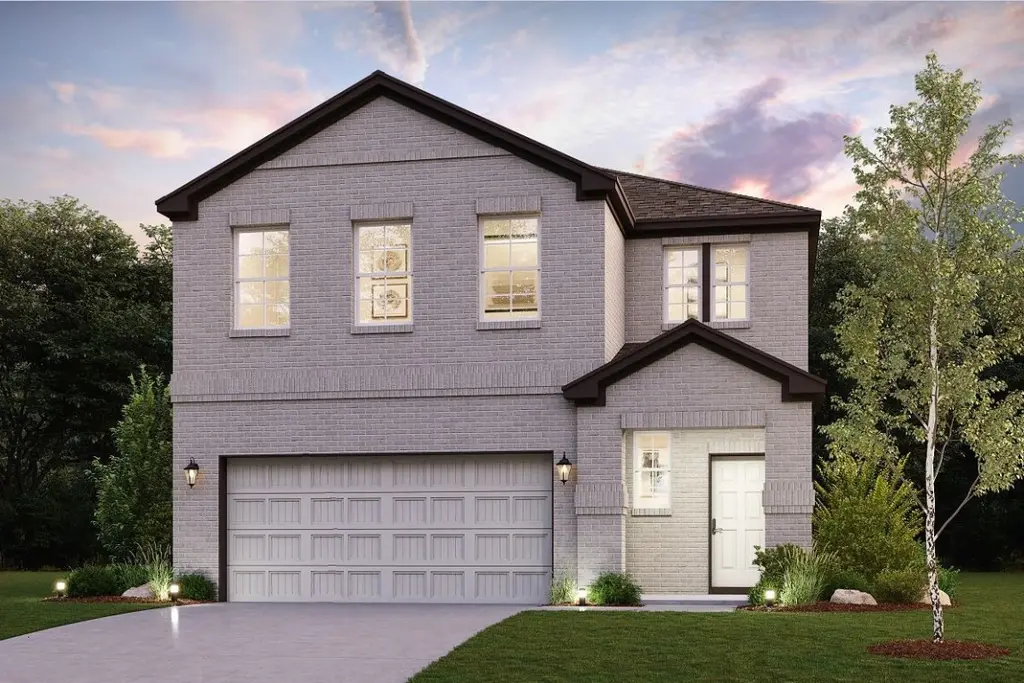
The two-story Bristol floor plan is the answer for the home buyer looking for a spacious home to meet their needs. The primary suite is privately situated on the first floor, separate from the secondary bedrooms in the home. The 5th bedroom is also located on the first floor, offering flexibility in how to use the space - if not an additional bedroom, a home office or nursery are some ideas that come to mind! Combined formals with an island kitchen make the Bristol a modern open-concept design that is so popular with today's home buyer. And the upstairs game room offers a secondary entertainment space for the home.
Key facts
- Island kitchen
- Primary suite
- Upstairs game room
Tags
Neighborhood map
What this means for you Summary
Snapshot
- This is a 5-bed/3.0-bath land listed at $326k.
Deal economics
- At list price, monthly cash flow is $-23 ($-272/yr) — negative.
- To cash-flow at today's rent, offer at most $322k (1.2% below list).
- To meet the 1% rule (rent ≥ 1% of price), the offer needs to be $255k (21.7% below list).
- Recommended offer: $255k (21.7% below list) — sets the bar for 1% rule.
Location & tenants
- Location reads 59/100 on livability (#1,136 in TX) — a working-class tenant base; expect higher turnover. Strengths: cost of living A+, housing A+; Watch: employment D, crime F, amenities F.
- Hitchcock ISD (suburban): math 28% / reading 31% proficiency, ranked #628 of 826 in TX (top 76%) — low school quality limits family demand, transient renter base, plan for 1-2y turnover; 72% free/reduced lunch — lower-income household profile, screen leases tightly.
- Zoned schools: Hitchcock Pri (453 students, 85% FRL); Crosby Middle (math 25% / reading 33%, grade F, #1,103 of 1,662 statewide, top 67%, 410 students, 84% FRL); Hitchcock H S (math 47% / reading 47%, grade D-, #591 of 1,632 statewide, top 38%, 470 students, 77% FRL).
- Market conditions: Rents rising (+4.0%/yr); 661 active listings in the ZIP; 1 comparable units currently listed for rent nearby; 3,258 units permitted in Galveston County in 2024 (0 in 5+ unit buildings).
- This rent runs 41% of the median local income ($75k/yr) — at the standard rent-burdened threshold; future hikes will face affordability resistance.
Forward outlook
- Local home prices are declining (-3.0%/yr); year-one equity from $2k of loan paydown is wiped out by about $10k of value loss. Plan a longer hold.
- Galveston County population projected at +43% by 2050 — long-run rental-demand tailwind backs the buy-and-hold thesis.
Negotiation context
- It's been on market 104 days — a 9% lower offer ($297k) is reasonable based on typical stale-listing flexibility.
- 3 sale attempts since 2y ago with the ask held roughly flat each time — persistent listings suggest the price (not the market) is what's stuck; bring a comps-based counter.
Questions for the listing agent
- What do current leases actually rent for vs. the listed asking? Can we see a recent rent roll and the last 12 months of T-12 income?
- It's been on market 104 days. Have you received any prior offers? Is the seller open to a 22% concession, seller financing, or rate buy-down credit?
- What does the HOA fee cover, when was the last increase, and are there any pending special assessments or reserve-fund shortfalls?
- Why hasn't it sold? Are there any deal-killer items the seller is aware of (foundation, flood, title, zoning, code violations)?
- Is there a deadline driving the sale (1031 exchange, divorce, estate, relocation)? That informs how much negotiation room exists.
- Schools are F-rated, which usually means shorter tenancies and higher turnover. Who's the typical renter profile here, and what's been the actual vacancy rate?
- Crime grade is F in this area — have there been break-ins, vandalism, or insurance claims at this property in the last 3 years? What carrier currently insures it and at what premium?
- The area grade is low — what's the realistic commute time and amenity access for the typical tenant pool here? Any planned neighborhood developments (good or bad) we should know about?
- What's the average days-on-market for RENTAL listings here right now (not sales)? A rising rental-DOM trend means longer vacancies and softer asking-rent achievability than the comps imply.
- What's the recent tenant-quality profile in this submarket — average credit score on applications, eviction rate, late-payment / NSF rate, and stable-employment percentage? A property-management company in the area should have these aggregated.
- How much new for-sale + rental construction is in the pipeline within 1–3 miles? Heavy new supply typically softens prices + rents 12–24 months out; constrained supply supports both.
Investment metrics
- 1% rule
- 0.78% ✗
- Cap rate
- 6.21%
- Cash-on-cash
- -0.30%
- DSCR
- 0.99
- GRM
- 10.6
CMA / ARV
- ARV (median comp)
- $298,332
- List price
- $325,900
- Delta
- 9.24%
- Verdict
- FAIR
- Comps
- 20 within 1.0 mi
Projected returns pro-forma
-3.0% appreciation · 3.95% rent growth · sell at horizon
- IRR
- -15.9%
- Equity multiple
- 0.43×
- Total profit
- $-51,885
- Equity at exit
- $48,593
- IRR
- -6.1%
- Equity multiple
- 0.59×
- Total profit
- $-37,122
- Equity at exit
- $28,178
Cash invested: $91,252 (down + closing). Projections, not guarantees.
Landlord ↔ Tenant lean methodology
- Overall (STATE)
- 87 Strongly Landlord-Friendly
- State Texas
- 87 Strongly Landlord-Friendly · R+5
- County
- — inherits STATE
- City
- — inherits STATE
ZIP-level market 77568
- Home prices YoY
- -22.7%
- Rents YoY
- 4.0%
- Active inventory
- 661
- Price-to-rent
- 10.6×
Monthly cashflow live
- Estimated rent
- $2,551 medium interval (Pro) →
- Mortgage (P&I)
- −$1,709
- Tax from tax record
- −$135 /mo · $1,617/yr
- Insurance
- −$136
- HOA
- −$58
- Vacancy / Maint / Mgmt
- −$536
- Net cashflow
- $-23
Break-even live
Sensitivity live
| Price | -10% $162 | -5% $70 | +0% $-23 | +5% $-115 | +10% $-207 |
|---|---|---|---|---|---|
| Rent | -10% $-224 | -5% $-123 | +0% $-23 | +5% $78 | +10% $179 |
| Rate | -1.0pp $141 | -0.5pp $60 | base $-23 | +0.5pp $-107 | +1.0pp $-193 |
UW: 25.0% down · 7.5% · 30yr · 1.5% tax · 5.0% vac · 8.0% maint · 8.0% mgmt
Financing live
Cash to close
- Down payment
- $81,475
- Closing costs
- $9,777
- Reserves months
- —
- Total cash needed
- —
Loan-product check · same deal, 3 products live
Conventional
25% down · 7.5% · 30yr
- Down + closing
- —
- Monthly P&I
- —
- Monthly cashflow
- —
- DSCR
- —
- Eligible?
- —
Personal DTI + credit; lowest rate.
DSCR
20% down · 8.5% · 30yr
- Down + closing
- —
- Monthly P&I
- —
- Monthly cashflow
- —
- DSCR
- —
- Eligible?
- —
No personal income docs; deal must DSCR.
Hard money
10% down · 12.0% · 12mo
- Down + closing
- —
- Monthly P&I
- —
- Monthly cashflow
- —
- DSCR
- —
- Eligible?
- —
Short-term bridge; refi at stabilization.
Rent comps 1 comps
| Address | Beds | Baths | Sqft | Rent | $/sqft | DOM | Units | Dist |
|---|---|---|---|---|---|---|---|---|
| 14403 Daniel Shores Dr La Marque, TX | 4.0 | 3.0–3.5 | 1872 | $2,600 | $1.39 | 0d | 12 | 1.49mi |
HOA detail
- Monthly dues
- $58 · $696/yr
Listing history 19 events
-
2026-06-21days on market $325,900 Active 104 DOM
-
2026-06-18days on market $325,900 Active 101 DOM
-
2026-06-17days on market $325,900 Active 100 DOM
-
2026-06-16days on market $325,900 Active 99 DOM
-
2026-06-15days on market $325,900 Active 98 DOM
-
2026-06-13days on market $325,900 Active 96 DOM
-
2026-06-13days on market $325,900 Active 95 DOM
-
2026-06-09days on market $325,900 Active 92 DOM
-
2026-06-08days on market $325,900 Active 91 DOM
-
2026-06-07days on market $325,900 Active 90 DOM
-
2026-06-04days on market $325,900 Active 87 DOM
-
2026-06-03days on market $325,900 Active 86 DOM
-
2026-06-02days on market $325,900 Active 85 DOM
-
2026-06-01days on market $325,900 Active 84 DOM
-
2026-05-31days on market $325,900 Active 83 DOM
-
2026-03-09$325,900 Active 622-char remark
Show marketing remark (622 chars)
The two-story Bristol floor plan is the answer for the home buyer looking for a spacious home to meet their needs. The primary suite is privately situated on the first floor, separate from the secondary bedrooms in the home. The 5th bedroom is also located on the first floor, offering flexibility in how to use the space - if not an additional bedroom, a home office or nursery are some ideas that come to mind! Combined formals with an island kitchen make the Bristol a modern open-concept design that is so popular with today's home buyer. And the upstairs game room offers a secondary entertainment space for the home.
-
2026-02-07$325,900 Active 621-char remark
Show marketing remark (621 chars)
The two-story Bristol floor plan is the answer for the home buyer looking for a spacious home to meet their needs. The primary suite is privately situated on the first floor, separate from the secondary bedrooms in the home. The 5th bedroom is also located on the first floor, offering flexibility in how to use the space - if not an additional bedroom, a home office or nursery are some ideas that come to mind! Combined formals with an island kitchen make the Bristol a modern open-concept design that is so popular with today's home buyer. And the upstairs gameroom offers a secondary entertainment space for the home.
-
2024-12-30historical
-
2024-06-10$317,990 Active
ⓘ Source: listings_history table (triggers on properties + properties_extension) + one-shot
backfill from property_details.listing_events for pre-trigger history.
Tax reassessment forecast TX · Resets to sale price
- Current annual tax
- $1,617 · $135/mo
- Projected year-2 tax
- $5,964 · $497/mo
- Expected delta
- +$4,347/yr (+$362/mo · 268.8%)
ⓘ Screening estimate from a state-policy table — verify with the county assessor before closing.
Nearby sold comps map
Loading sold comps map…
Walkable amenities ~0.75 mi
Loading nearby amenities…
Taxation est. · year 1
- Rental income
- $30,607
- − Mortgage interest
- −$18,255
- − Property taxes
- −$1,617
- − Insurance
- −$1,630
- − Repairs & maintenance
- −$2,449
- − Management
- −$2,449
- − HOA
- −$696
- − Depreciation
- −$9,481
- Taxable loss
- −$5,969
- Est. tax savings @ 24.0%
- +$1,433
- After-tax cash flow
- $1,161/yr
For passive investors: Depreciation is non-cash, so a rental often shows a tax loss while cash-flowing — sheltering income. Rental losses are passive: they offset passive income freely, and up to $25,000/yr can offset ordinary (W-2) income if you actively participate and your MAGI is under $100k (phasing out to $0 by $150k); unused losses carry forward. On sale, claimed depreciation is recaptured at up to 25%, and gains may owe capital-gains tax (a 1031 exchange can defer both). Figures are a year-1 estimate at your 24.0% rate — not tax advice; consult a CPA.
Schools (NCES district)
- District
- Hitchcock ISD
- NCES district ID
- 4823310
- Math proficiency
- 28% ▼ -2.00%
- Reading proficiency
- 31% ▼ -4.00%
- Median HH income
- $47,041
- Composite
- 25.5/100
- National rank
- #7439
- State rank
- #628 of 826 in TX
Livability — La Marque
- Score
- 59/100
- State rank
- #1136
- US rank
- #20037
Category grades
Schools grade is shown separately in the Schools card above.
Census & demographics
- Census place
- La Marque, TX
- County
- Galveston County · 357,330 people
- City population
- 23,083
- Metro
- Houston-The Woodlands-Sugar Land, TX
- Population (ZIP)
- 23,083
- Household income
- $74,694
- Rent vs Own
- Severe rent burden
- 700.0
Population outlook (Galveston County) Hauer SSP2
- Today (2025)
- 390,640 people
- By 2030
- 425,226 · +8.9%
- By 2040
- 493,765 · +26.4%
- By 2050
- 559,698 · +43.3%
- By 2075
- 719,260 · +84.1%
- By 2100
- 819,628 · +109.8%
Race, ethnicity, and origin ACS 2023
- Neighborhood character
- Highly diverse neighborhood (Simpson 0.71)
- Race & ethnicity
- White 37% Hispanic / Latino 29% Black 26% Two or more races 17% Asian 3%
- Hispanic origin (detail)
- Mexican 22% Puerto Rican 1%
- Common ancestry
- Lithuanian 1% Italian 1% Serbian 1%
- Foreign-born
- 8% · Canada
- Languages at home
- 77% English-only · Spanish 21% Tagalog/Filipino 1% Other Asian/Pacific 1%
Political lean MEDSL · Galveston
- 2024 margin
- Strong R (+27.4) · D 35.7% · R 63.1% · Other 1.2%
- 2008→2024 swing
- -7.9pp toward R · 2008: -19.5pp · 2024: -27.4pp
- All cycles
- 2024: R+27.4 2020: R+22.6 2016: R+22.6 2012: R+26.9 2008: R+19.5
Not yet ingested
- Civics
- —
Market trends
- HPI YoY
- ▼ -69.39%
- Current HPI
- 236.0239
- Rent YoY
- ▲ 3.95%
- Metro
- Houston-The Woodlands-Sugar Land, TX
- State GDP YoY
- ▲ 3.95%
- F500 in state
- 110
Industry mix (Fortune 500 HQ in TX)
| Industry | F500 HQs | Revenue |
|---|---|---|
| Energy | 16 | $1,198B |
|
||
| Technology | 5 | $198B |
|
||
| Engineering / Construction | 4 | $72B |
|
||
| Energy Services | 3 | $60B |
|
||
| Utilities | 3 | $41B |
|
||
| Healthcare | 2 | $330B |
|
||
Price history
+2.5% since first listed4 events — show timeline
- 2026-03-09 Listed $325,900 HARMLS
- 2026-02-07 Listed $325,900 Zillow
- 2024-12-30 Listing Removed — HARMLS
- 2024-06-10 Listed $317,990 HARMLS
Property tax history
-0.9%/yrLatest (2025): $1,617 · -0.9% YoY. Source: county tax records.
Cash-flow waterfall
monthlySold comps — $/sqft
last 12 mo · ≤1 miLoading sold comps…