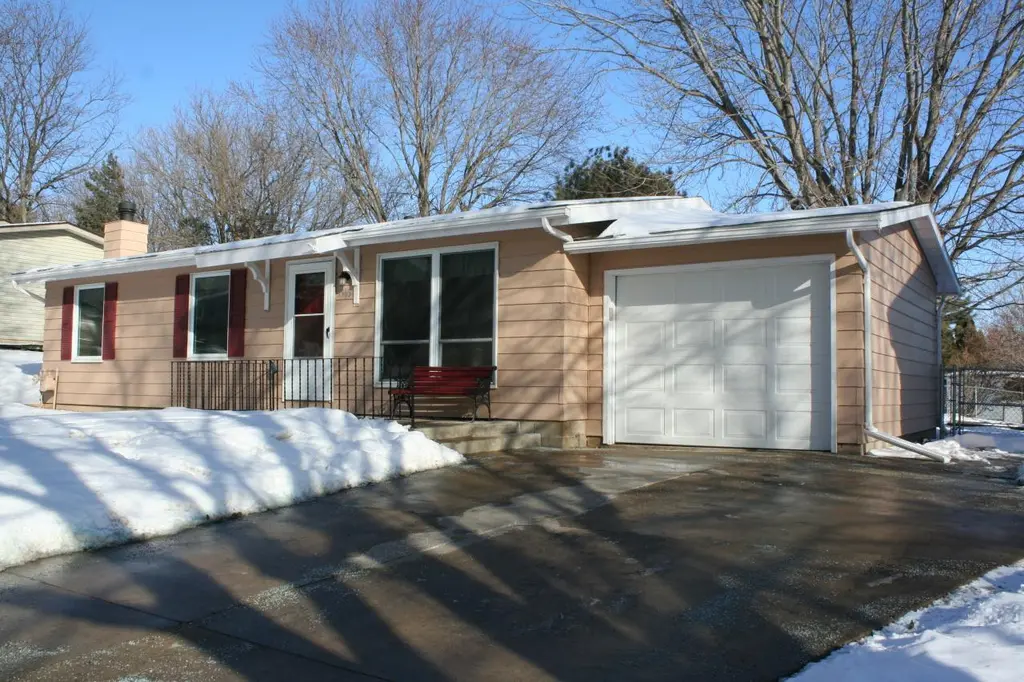
3960 Willow Heights Dr SW · Rochester, MN
Flood risk 1/10 · Minimal
- FEMA flood zone
- X (unshaded)
- Chance of flooding over 30 yrs
- 0.0%
- Est. flood insurance / yr
- $473 – $860
Fire risk 1/10 · Minimal
- Est. fire insurance / yr
- $888 – $1,650
Heat risk 2/10 · Minimal
- Hot days now (above 97°F)
- 7 days/yr
- Hot days in 30 yrs
- 15 days/yr
Wind risk 2/10 · Minimal
- Chance of severe wind over 30 yrs
- —
Air-quality risk 2/10 · Minimal
- Unhealthy air days now
- 1 days/yr
- Unhealthy air days in 30 yrs
- 1 days/yr
Risk factors via First Street. Map © Google.
Why this score? — see what drove the C grade
The composite is a weighted blend of 9 inputs, each scored 0–100. Each bar is that input's sub-score; the figure is the points it added to the 100-point composite (weight × sub-score).
- Cash flow +22.9/30.0
- ARV discount +7.5/15.0
- DSCR +7.3/10.0
- 1% rule +5.8/10.0
- Livability +4.6/5.0
- Schools +4.1/10.0
- Rent growth +2.9/5.0
- Condition / age +2.5/5.0
- Appreciation +0.0/10.0
$230,000
🖨 Deal sheet 📄 Offer letter ✓ Due diligence
Listing remarks
This 3 bedroom home has a great fenced yard and is ready to move into! Enjoy the mature trees on your deck this summer. Great location on the edge of town with super easy access to the main thoroughfares to get you anywhere in town quickly! All three bedrooms are located on the main floor along with the open concept living room, dining area, and kitchen that opens up to the deck. The main floor also has a full bathroom and plenty of storage space. Brand new flooring in the living areas and bedrooms - the entire main floor except the bathroom! The basement is unfinished and includes space for storage and the laundry area.
Key facts
- Plenty of storage
- Fenced yard
- Open concept
Tags
Neighborhood map
What this means for you Summary
Snapshot
- This is a 3-bed/1.0-bath single-family listed at $230k.
Deal economics
- At list price, monthly cash flow is $403 ($5k/yr) — positive.
- The deal already cash-flows at list — no discount required.
- Meets the 1% rule at list price ($2k rent vs $230k).
- Recommended offer: $223k (3.0% below list) — sets the bar for market timing.
- Cap rate 8.4% vs local median 3.5% in Rochester — top-decile yield for the area; either an underpriced asset or a hidden risk that comps aren't pricing in. Stress-test before assuming the spread holds.
Location & tenants
- Location reads 92/100 on livability (#1 in MN, #27 nationally) — a professional / high-income tenant draw. Strengths: amenities A+, commute A+, employment A+.
- Rochester Public School District (urban): math 40% / reading 51% proficiency, ranked #152 of 301 in MN (top 50%) — families likely to look elsewhere, expect single-tenant / working-renter base with shorter leases.
- Market conditions: Rents rising (+1.6%/yr); 387 active listings in the ZIP; 4 comparable units currently listed for rent nearby; rentals leasing fast (median 13d on market — plan ~1-2 weeks tenant-placement turnaround); high-income renter base; 1,267 units permitted in Olmsted County in 2024 (915 in 5+ unit buildings).
Forward outlook
- Local home prices are declining (-3.0%/yr); year-one equity from $2k of loan paydown is wiped out by about $7k of value loss. Plan a longer hold.
- Olmsted County population projected at +16% by 2050 — long-run rental-demand tailwind backs the buy-and-hold thesis.
Negotiation context
- It's been on market 39 days — a 3% lower offer ($223k) is reasonable based on typical stale-listing flexibility.
- 8 sale attempts since 15y ago; this cycle's ask is 13429% above the opening price — seller raised mid-cycle; expect resistance to lowballs.
- Current owner paid $106k; list at $230k implies a 117% gain — meaningful room to come down on a strong offer.
Questions for the listing agent
- It's been on market 39 days. Have you received any prior offers? Is the seller open to a 3% concession, seller financing, or rate buy-down credit?
- Built in 1977 — when were the roof, HVAC, electrical panel, plumbing, and water heater last replaced?
- Is there a deadline driving the sale (1031 exchange, divorce, estate, relocation)? That informs how much negotiation room exists.
- Schools are A-rated — typically a magnet for longer-tenancy family renters. What's the average tenant stay here, and is there a school-zone premium baked into asking?
- What's the average days-on-market for RENTAL listings here right now (not sales)? A rising rental-DOM trend means longer vacancies and softer asking-rent achievability than the comps imply.
- What's the recent tenant-quality profile in this submarket — average credit score on applications, eviction rate, late-payment / NSF rate, and stable-employment percentage? A property-management company in the area should have these aggregated.
- How much new for-sale + rental construction is in the pipeline within 1–3 miles? Heavy new supply typically softens prices + rents 12–24 months out; constrained supply supports both.
Investment metrics
- 1% rule
- 1.08% ✓
- Cap rate
- 8.40%
- Cash-on-cash
- 7.52%
- DSCR
- 1.33
- GRM
- 7.7
CMA / ARV
No comps found within radius.
Projected returns pro-forma
-3.0% appreciation · 1.55% rent growth · sell at horizon
- IRR
- -6.4%
- Equity multiple
- 0.76×
- Total profit
- $-15,135
- Equity at exit
- $34,294
- IRR
- 1.3%
- Equity multiple
- 1.09×
- Total profit
- $5,740
- Equity at exit
- $19,886
Cash invested: $64,400 (down + closing). Projections, not guarantees.
Landlord ↔ Tenant lean methodology
- Overall (STATE)
- 46 Balanced
- State Minnesota
- 46 Balanced · D+2
- County
- — inherits STATE
- City
- — inherits STATE
ZIP-level market 55902
- Rents YoY
- 1.6%
- Active inventory
- 387
- Price-to-rent
- 7.7×
Monthly cashflow live
- Estimated rent
- $2,482 medium interval (Pro) →
- Mortgage (P&I)
- −$1,206
- Tax from tax record
- −$256 /mo · $3,070/yr
- Insurance
- −$96
- HOA
- −$0
- Vacancy / Maint / Mgmt
- −$521
- Net cashflow
- $403
Break-even live
UW: 25.0% down · 7.5% · 30yr · 1.5% tax · 5.0% vac · 8.0% maint · 8.0% mgmt
Financing live
Cash to close
- Down payment
- $57,500
- Closing costs
- $6,900
- Reserves months
- —
- Total cash needed
- —
Loan-product check · same deal, 3 products live
Conventional
25% down · 7.5% · 30yr
- Down + closing
- —
- Monthly P&I
- —
- Monthly cashflow
- —
- DSCR
- —
- Eligible?
- —
Personal DTI + credit; lowest rate.
DSCR
20% down · 8.5% · 30yr
- Down + closing
- —
- Monthly P&I
- —
- Monthly cashflow
- —
- DSCR
- —
- Eligible?
- —
No personal income docs; deal must DSCR.
Hard money
10% down · 12.0% · 12mo
- Down + closing
- —
- Monthly P&I
- —
- Monthly cashflow
- —
- DSCR
- —
- Eligible?
- —
Short-term bridge; refi at stabilization.
Rent comps 4 comps
| Address | Beds | Baths | Sqft | Rent | $/sqft | DOM | Units | Dist |
|---|---|---|---|---|---|---|---|---|
| 3960 Willow Heights Dr SW Rochester, MN | 3.0 | 1.0 | 1734 | $1,700 | $0.98 | 43d | 1 | 0.04mi |
| 3714 10th Ave SW Rochester, MN | 3.0 | 2.0 | 1783 | $2,250 | $1.26 | 13d | 1 | 0.53mi |
| 350 Boulder Rd SE Rochester, MN | 1.0–3.0 | 1.0–2.5 | 1181 | $2,594 | $2.20 | 13d | 1 | 0.74mi |
| 4850 Maine Ave SE Rochester, MN | 3.0 | 1.0–2.0 | 1039 | $3,284 | $3.16 | 13d | 28 | 1.07mi |
Listing history 29 events
-
2026-06-09days on market $230,000 Active 39 DOM
-
2026-06-08days on market $230,000 Active 38 DOM
-
2026-06-07days on market $230,000 Active 37 DOM
-
2026-06-05days on market $230,000 Active 34 DOM
-
2026-06-03days on market $230,000 Active 33 DOM
-
2026-06-02days on market $230,000 Active 32 DOM
-
2026-06-01days on market $230,000 Active 31 DOM
-
2026-05-31days on market $230,000 Active 30 DOM
-
2026-05-30days on market $230,000 Active 29 DOM
-
2026-04-20price $230,000
-
2026-03-03$1,700
-
2025-05-02historical $1,650
-
2025-04-30historical
-
2025-04-17$1,650
-
2025-04-04price $240,000
-
2025-03-25$250,000 Active
-
2024-03-14historical $1,375
-
2023-11-10$1,375
-
2018-12-11historical
-
2018-12-09historical
-
2012-04-12soldstatus $105,900
-
2012-04-02soldstatus $105,900
-
2012-04-02soldstatus $105,900
-
2012-02-01$112,900
-
2012-02-01$112,900
-
2011-02-16$115,900
-
2011-02-16$115,900
-
2004-07-02soldstatus $120,000
-
2004-06-25soldstatus $120,000
ⓘ Source: listings_history table (triggers on properties + properties_extension) + one-shot
backfill from property_details.listing_events for pre-trigger history.
Tax reassessment forecast MN · Partial reset (capped growth)
- Current annual tax
- $3,070 · $256/mo
- Projected year-2 tax
- $3,070 · $256/mo
- Expected delta
- $0/yr ($0/mo · 0.0%)
ⓘ Screening estimate from a state-policy table — verify with the county assessor before closing.
Climate risk First Street
- Flood 1/10 Low FEMA zone X (unshaded) · 0% chance over 30 yrs
- Wildfire 1/10 Low
- Heat 2/10 Low 7 d/yr ≥97°F today · 15 d/yr by 30 yrs out
- Wind 2/10 Low
- Air quality 2/10 Low 1 unhealthy d/yr today · 1 by 30 yrs out
Nearby sold comps map
Loading sold comps map…
Walkable amenities ~0.75 mi
Loading nearby amenities…
Taxation est. · year 1
- Rental income
- $29,789
- − Mortgage interest
- −$12,884
- − Property taxes
- −$3,070
- − Insurance
- −$1,150
- − Repairs & maintenance
- −$2,383
- − Management
- −$2,383
- − Depreciation
- −$6,691
- Taxable income
- $1,228
- Est. tax owed @ 24.0%
- −$295
- After-tax cash flow
- $4,545/yr
For passive investors: Depreciation is non-cash, so a rental often shows a tax loss while cash-flowing — sheltering income. Rental losses are passive: they offset passive income freely, and up to $25,000/yr can offset ordinary (W-2) income if you actively participate and your MAGI is under $100k (phasing out to $0 by $150k); unused losses carry forward. On sale, claimed depreciation is recaptured at up to 25%, and gains may owe capital-gains tax (a 1031 exchange can defer both). Figures are a year-1 estimate at your 24.0% rate — not tax advice; consult a CPA.
Schools (NCES district)
- District
- Rochester Public School District
- NCES district ID
- 2731800
- Math proficiency
- 40% ▼ -10.00%
- Reading proficiency
- 51% ▼ -4.00%
- Median HH income
- $66,540
- Composite
- 40.6/100
- National rank
- #3695
- State rank
- #152 of 301 in MN
Livability — Rochester
- Score
- 92/100
- State rank
- #1
- US rank
- #27
Category grades
Schools grade is shown separately in the Schools card above.
Census & demographics
- Census place
- Rochester, MN
- County
- Olmsted County · 135,035 people
- City population
- 135,035
- Metro
- Rochester, MN
- Population (ZIP)
- 26,464
- Household income
- $120,611
- Rent vs Own
- Severe rent burden
- 728.0
Population outlook (Olmsted County) Hauer SSP2
- Today (2025)
- 165,999 people
- By 2030
- 172,425 · +3.9%
- By 2040
- 183,785 · +10.7%
- By 2050
- 192,981 · +16.3%
- By 2075
- 215,284 · +29.7%
- By 2100
- 224,887 · +35.5%
Race, ethnicity, and origin ACS 2023
- Neighborhood character
- Predominantly White (75%)
- Race & ethnicity
- White 75% Asian 11% Two or more races 7% Hispanic / Latino 7% Black 2%
- Hispanic origin (detail)
- Mexican 3%
- Common ancestry
- Portuguese 11% Lithuanian 2% Iranian 2%
- Foreign-born
- 14% · Canada, China, Jamaica
- Languages at home
- 82% English-only · Spanish 4% Other Asian/Pacific 4% Other Indo-European 4%
Political lean MEDSL · Olmsted
- 2024 margin
- D (+10.7) · D 54.3% · R 43.6% · Other 2.1%
- 2008→2024 swing
- +7.4pp toward D · 2008: 3.3pp · 2024: 10.7pp
- All cycles
- 2024: D+10.7 2020: D+10.7 2016: D+0.8 2012: D+3.2 2008: D+3.3
Not yet ingested
- Civics
- —
Market trends
- HPI YoY
- ▼ -158.29%
- Current HPI
- 252.3502
- Rent YoY
- ▲ 1.55%
- Metro
- Rochester, MN
- State GDP YoY
- ▲ 2.41%
- F500 in state
- 34
Industry mix (Fortune 500 HQ in MN)
| Industry | F500 HQs | Revenue |
|---|---|---|
| Healthcare | 2 | $407B |
|
||
| Retail | 2 | $150B |
|
||
| Consumer Goods | 2 | $32B |
|
||
| Industrial Machinery | 2 | $6B |
|
||
| Agriculture | 1 | $40B |
|
||
| Healthcare / Medical Devices | 1 | $32B |
|
||
Price history
+91.7% since first listed20 events — show timeline
- 2026-04-20 Price Changed $230,000 NORTHSTARMLS as Distributed by MLS Grid
- 2026-03-03 Listed for Rent $1,700 APPFOLIO
- 2025-05-02 Rental Removed $1,650 APPFOLIO
- 2025-04-30 Listing Removed — NORTHSTARMLS as Distributed by MLS Grid
- 2025-04-17 Listed for Rent $1,650 APPFOLIO
- 2025-04-04 Price Changed $240,000 NORTHSTARMLS as Distributed by MLS Grid
- 2025-03-25 Listed $250,000 NORTHSTARMLS as Distributed by MLS Grid
- 2024-03-14 Rental Removed $1,375 APPFOLIO
- 2023-11-10 Listed for Rent $1,375 APPFOLIO
- 2018-12-11 Listing Removed — NORTHSTARMLS as Distributed by MLS Grid
- 2018-12-09 Listing Removed — NORTHSTARMLS as Distributed by MLS Grid
- 2012-04-12 Sold (Public Records) $105,900 Public Records
- 2012-04-02 Sold (MLS) $105,900 NORTHSTARMLS as Distributed by MLS Grid
- 2012-04-02 Sold (MLS) $105,900 NORTHSTARMLS as Distributed by MLS Grid
- 2012-02-01 Listed $112,900 NORTHSTARMLS as Distributed by MLS Grid
- 2012-02-01 Listed $112,900 NORTHSTARMLS as Distributed by MLS Grid
- 2011-02-16 Listed $115,900 NORTHSTARMLS as Distributed by MLS Grid
- 2011-02-16 Listed $115,900 NORTHSTARMLS as Distributed by MLS Grid
- 2004-07-02 Sold (Public Records) $120,000 Public Records
- 2004-06-25 Sold (Public Records) $120,000 Public Records
Property tax history
+7.1%/yrLatest (2025): $3,070 · +10.3% YoY. Source: county tax records.
Cash-flow waterfall
monthlySold comps — $/sqft
last 12 mo · ≤1 miLoading sold comps…