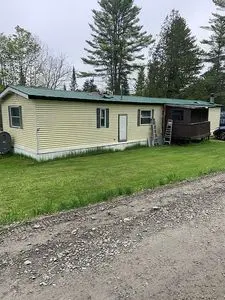
144 Donna Ln · Washington, VT
Flood risk 8/10 · Major
- FEMA flood zone
- A
- Chance of flooding over 30 yrs
- 0.99%
- Est. flood insurance / yr
- $946 – $6,584
Fire risk 3/10 · Minor
- Est. fire insurance / yr
- $480 – $892
Heat risk 1/10 · Minimal
- Hot days now (above 87°F)
- 8 days/yr
- Hot days in 30 yrs
- 18 days/yr
Wind risk 2/10 · Minimal
- Chance of severe wind over 30 yrs
- 3.0%
Air-quality risk 1/10 · Minimal
- Unhealthy air days now
- 0 days/yr
- Unhealthy air days in 30 yrs
- 0 days/yr
Risk factors via First Street. Map © Google.
Why this score? — see what drove the A- grade
The composite is a weighted blend of 9 inputs, each scored 0–100. Each bar is that input's sub-score; the figure is the points it added to the 100-point composite (weight × sub-score).
- Cash flow +30.0/30.0
- ARV discount +15.0/15.0
- 1% rule +10.0/10.0
- DSCR +10.0/10.0
- Appreciation +6.5/10.0
- Schools +5.0/10.0
- Rent growth +2.5/5.0
- Livability +2.5/5.0
- Condition / age +2.5/5.0
$45,000
🖨 Deal sheet (PDF) 📄 Offer letter ✓ Due diligence
Listing remarks
1979, 14x70 Skyline mobile home. In Washington North Mobile Home Park. Home was weatherized aprx 6 yrs ago. Only home in park on cement slab. Have replaced Bathroom, Living Room, Sitting Rook and hallway floors with wood flooring. New kitchen sink and floor cabinets 2yrs ago. Can include furniture and appliances shown in pictures. Has small front porch and larger back porch that had roof replaced 2yrs ago. Has wooden wheelchair ramp connected to back porch that was installed before I moved in 16 yrs ago and does need a little work, but useable. Plenty of lawn space with large back lawn. New Electric Hot Water Heater year ago. Also has a working fireplace in sitting room.
Key facts
- Wood flooring
- Large back lawn
- Working fireplace
Tags
Neighborhood map
What this means for you Summary
Snapshot
- This is a 2-bed/1.0-bath manufactured listed at $45k.
Deal economics
- At list price, monthly cash flow is $353 ($4k/yr) — positive.
- The deal already cash-flows at list — no discount required.
- Meets the 1% rule at list price ($1k rent vs $45k).
- Recommended offer: $44k (1.5% below list) — sets the bar for market timing.
Location & tenants
- Location reads: area grade A — affects rentability + tenant quality, not the cash-flow math above.
- Zoned schools: Washington Village School (math 44% / reading 54%, grade D, #50 of 192 statewide, top 32%, 118 students, 37% FRL); Orange Center School (math 27% / reading 27%, grade F, #22 of 26 statewide, top 84%, 77 students, 35% FRL).
- Market conditions: 6 active listings in the ZIP; 74 units permitted in Orange County in 2024 (28 in 5+ unit buildings).
Forward outlook
- In year one you build about $2k of equity ($311 loan paydown + $1k appreciation (3.0% local appreciation)).
- Orange County population projected at -18% by 2050 — secular population decline; favor cash flow + early exit over multi-decade hold.
- At projected returns (3.0% appreciation + 3.0% rent growth), your $13k cash investment doubles in ~3 years — after that, you're playing with house money.
Negotiation context
- It's been on market 25 days — a 2% lower offer ($44k) is reasonable based on typical stale-listing flexibility.
- Current owner paid $24k; list at $45k implies a 88% gain — meaningful room to come down on a strong offer.
Risks & watch-outs
- Watch-outs: flood insurance adds $314/mo.
- Climate carrying-cost: in FEMA flood zone A (mandatory federal flood insurance) — expect insurance premiums to compound above CPI over the hold.
Questions for the listing agent
- Built in 1979 — when were the roof, HVAC, electrical panel, plumbing, and water heater last replaced?
- What's the actual annual flood-insurance premium (NFIP or private), and is the property in a SFHA with mandatory coverage?
- Is there a deadline driving the sale (1031 exchange, divorce, estate, relocation)? That informs how much negotiation room exists.
- What's the average days-on-market for RENTAL listings here right now (not sales)? A rising rental-DOM trend means longer vacancies and softer asking-rent achievability than the comps imply.
- What's the recent tenant-quality profile in this submarket — average credit score on applications, eviction rate, late-payment / NSF rate, and stable-employment percentage? A property-management company in the area should have these aggregated.
- How much new for-sale + rental construction is in the pipeline within 1–3 miles? Heavy new supply typically softens prices + rents 12–24 months out; constrained supply supports both.
Investment metrics
- 1% rule
- 2.62% ✓
- Cap rate
- 24.07%
- Cash-on-cash
- 63.49%
- DSCR
- 3.83
- GRM
- 3.2
CMA / ARV
- ARV (on-the-fly)
- $68,376
- Comps found
- 1
Show comp detail 1 sale within ~0.75 mi
| Address | Dist | Beds/Ba | Sqft | Sold | Price | $/sf | Match |
|---|---|---|---|---|---|---|---|
| 90 Linnea Ln | 0.11mi | 2/2.0 | 1,008 (+9%) | 14mo | $75,000 | $74 | 64 |
Match score weights: distance 35% · size 25% · config 20% · recency 20%. Top-matched comps best support the ARV.
Projected returns pro-forma
2.95% appreciation · 3.0% rent growth · sell at horizon
- IRR
- 39.4%
- Equity multiple
- 3.22×
- Total profit
- $27,962
- Equity at exit
- $20,108
- IRR
- 39.5%
- Equity multiple
- 6.43×
- Total profit
- $68,444
- Equity at exit
- $30,891
Cash invested: $12,600 (down + closing). Projections, not guarantees.
Landlord ↔ Tenant lean methodology
- Overall (STATE)
- 41 Moderately Tenant-Leaning
- State Vermont
- 41 Moderately Tenant-Leaning · D+15
- County
- — inherits STATE
- City
- — inherits STATE
ZIP-level market 05675
- Home prices YoY
- 3.2%
- Active inventory
- 6
- Price-to-rent
- 3.2×
Monthly cashflow live
- Estimated rent
- $1,179 medium interval (Pro) →
- Mortgage (P&I)
- −$236
- Tax from tax record
- −$10 /mo · $119/yr
- Insurance
- −$19
- Flood insurance flood zone
- −$314 /mo · $3,765/yr
- HOA
- −$0
- Vacancy / Maint / Mgmt
- −$248
- Net cashflow
- $353
Break-even live
Sensitivity live
| Price | -10% $378 | -5% $366 | +0% $353 | +5% $340 | +10% $327 |
|---|---|---|---|---|---|
| Rent | -10% $260 | -5% $306 | +0% $353 | +5% $399 | +10% $446 |
| Rate | -1.0pp $376 | -0.5pp $364 | base $353 | +0.5pp $341 | +1.0pp $329 |
UW: 25.0% down · 7.5% · 30yr · 1.5% tax · 5.0% vac · 8.0% maint · 8.0% mgmt
Financing live
Cash to close
- Down payment
- $11,250
- Closing costs
- $1,350
- Reserves months
- —
- Total cash needed
- —
Loan-product check · same deal, 3 products live
Conventional
25% down · 7.5% · 30yr
- Down + closing
- —
- Monthly P&I
- —
- Monthly cashflow
- —
- DSCR
- —
- Eligible?
- —
Personal DTI + credit; lowest rate.
DSCR
20% down · 8.5% · 30yr
- Down + closing
- —
- Monthly P&I
- —
- Monthly cashflow
- —
- DSCR
- —
- Eligible?
- —
No personal income docs; deal must DSCR.
Hard money
10% down · 12.0% · 12mo
- Down + closing
- —
- Monthly P&I
- —
- Monthly cashflow
- —
- DSCR
- —
- Eligible?
- —
Short-term bridge; refi at stabilization.
Listing history 19 events
-
2026-06-21days on market $45,000 Active 25 DOM
-
2026-06-19days on market $45,000 Active 23 DOM
-
2026-06-18days on market $45,000 Active 22 DOM
-
2026-06-17days on market $45,000 Active 21 DOM
-
2026-06-16pricedays on market $45,000 Active 20 DOM
-
2026-06-15days on market $60,000 Active 19 DOM
-
2026-06-14days on market $60,000 Active 17 DOM
-
2026-06-12days on market $60,000 Active 16 DOM
-
2026-06-09days on market $60,000 Active 13 DOM
-
2026-06-08days on market $60,000 Active 12 DOM
-
2026-06-07days on market $60,000 Active 11 DOM
-
2026-06-07days on market $60,000 Active 10 DOM
-
2026-06-04days on market $60,000 Active 7 DOM
-
2026-06-02days on market $60,000 Active 6 DOM
-
2026-06-01days on market $60,000 Active 5 DOM
-
2026-05-31days on market $60,000 Active 4 DOM
-
2026-05-31days on market $60,000 Active 3 DOM
-
2026-05-28$60,000 Active
-
2010-02-22soldstatus $24,000
ⓘ Source: listings_history table (triggers on properties + properties_extension) + one-shot
backfill from property_details.listing_events for pre-trigger history.
Tax reassessment forecast VT · Partial reset (capped growth)
- Current annual tax
- $119 · $10/mo
- Projected year-2 tax
- $487 · $41/mo
- Expected delta
- +$368/yr (+$31/mo · 309.1%)
ⓘ Screening estimate from a state-policy table — verify with the county assessor before closing.
Climate risk First Street
- Flood 8/10 Severe FEMA zone A · 99% chance over 30 yrs
- Wildfire 3/10 Moderate
- Heat 1/10 Low 8 d/yr ≥87°F today · 18 d/yr by 30 yrs out
- Wind 2/10 Low 3% chance of damaging wind over 30 yrs
- Air quality 1/10 Low 0 unhealthy d/yr today · 0 by 30 yrs out
Nearby sold comps map
Loading sold comps map…
Walkable amenities ~0.75 mi
Loading nearby amenities…
Taxation est. · year 1
- Rental income
- $14,147
- − Mortgage interest
- −$2,521
- − Property taxes
- −$119
- − Insurance
- −$3,990
- − Repairs & maintenance
- −$1,132
- − Management
- −$1,132
- − Depreciation
- −$1,309
- Taxable income
- $3,944
- Est. tax owed @ 24.0%
- −$947
- After-tax cash flow
- $3,288/yr
For passive investors: Depreciation is non-cash, so a rental often shows a tax loss while cash-flowing — sheltering income. Rental losses are passive: they offset passive income freely, and up to $25,000/yr can offset ordinary (W-2) income if you actively participate and your MAGI is under $100k (phasing out to $0 by $150k); unused losses carry forward. On sale, claimed depreciation is recaptured at up to 25%, and gains may owe capital-gains tax (a 1031 exchange can defer both). Figures are a year-1 estimate at your 24.0% rate — not tax advice; consult a CPA.
Schools (NCES district)
No district data.
Livability — Washington
No livability data for this city. (Only ~50 U.S. cities are tracked.)
Census & demographics
- Population (ZIP)
- 897
Population outlook (Orange County) Hauer SSP2
- Today (2025)
- 28,186 people
- By 2030
- 27,359 · -2.9%
- By 2040
- 25,221 · -10.5%
- By 2050
- 23,023 · -18.3%
- By 2075
- 18,621 · -33.9%
- By 2100
- 14,477 · -48.6%
Race, ethnicity, and origin ACS 2023
- Neighborhood character
- Predominantly White (95%)
- Race & ethnicity
- White 95% Two or more races 4% Hispanic / Latino 1%
- Common ancestry
- Lithuanian 8% Italian 6% Slovak 3%
- Foreign-born
- 1%
- Languages at home
- 97% English-only · Spanish 1% French/Haitian/Cajun 1%
Political lean MEDSL · Orange
- 2024 margin
- Strong D (+20.2) · D 58.3% · R 38.1% · Other 3.6%
- 2008→2024 swing
- -11.1pp toward R · 2008: 31.3pp · 2024: 20.2pp
- All cycles
- 2024: D+20.2 2020: D+24.1 2016: D+18.8 2012: D+32.1 2008: D+31.3
Not yet ingested
- Civics
- —
Market trends
- HPI YoY
- ▲ 2.95%
- Current HPI
- 95.94
- Rent YoY
- —
- Metro
- —
- State GDP YoY
- —
- F500 in state
- 0
Price history
+150.0% since first listed2 events — show timeline
- 2026-05-28 Listed $60,000 FSBO.com
- 2010-02-22 Sold (Public Records) $24,000 Public Records
Property tax history
+8.1%/yrLatest (2024): $119 · +0.8% YoY. Source: county tax records.
Cash-flow waterfall
monthlySold comps — $/sqft
last 12 mo · ≤1 miLoading sold comps…