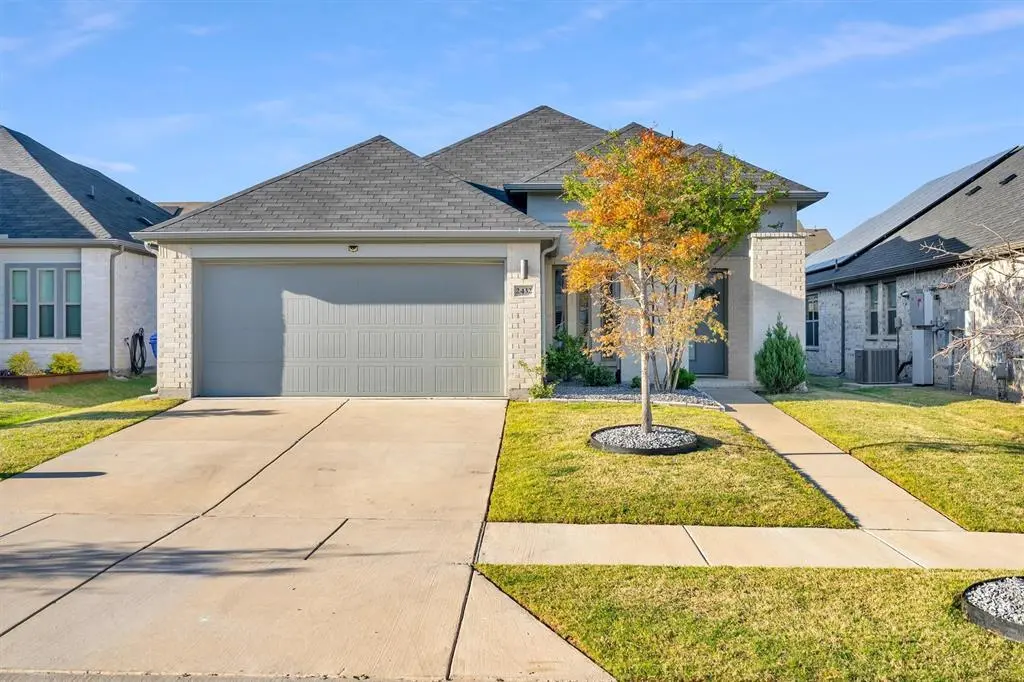
2432 Rocky Mountain Dr · Royse City, TX
Flood risk 1/10 · Minimal
- FEMA flood zone
- X (unshaded)
- Chance of flooding over 30 yrs
- 0.0%
- Est. flood insurance / yr
- $507 – $1,088
Fire risk 3/10 · Minor
- Est. fire insurance / yr
- $1,222 – $2,270
Heat risk 8/10 · Major
- Hot days now (above 110°F)
- 7 days/yr
- Hot days in 30 yrs
- 24 days/yr
Wind risk 6/10 · Moderate
- Chance of severe wind over 30 yrs
- 27.0%
Air-quality risk 2/10 · Minimal
- Unhealthy air days now
- 1 days/yr
- Unhealthy air days in 30 yrs
- 1 days/yr
Risk factors via First Street. Map © Google.
Why this score? — see what drove the D- grade
The composite is a weighted blend of 9 inputs, each scored 0–100. Each bar is that input's sub-score; the figure is the points it added to the 100-point composite (weight × sub-score).
- ARV discount +15.0/15.0
- Cash flow +6.7/30.0
- Schools +3.8/10.0
- Livability +3.8/5.0
- 1% rule +2.6/10.0
- Condition / age +2.5/5.0
- Rent growth +2.2/5.0
- DSCR +1.0/10.0
- Appreciation +0.0/10.0
$279,990
🖨 Deal sheet (PDF) 📄 Offer letter ✓ Due diligence
Listing remarks MLS
PRICE DROP AND SELLER IS NOW OFFERING $5k in closing costs as well! Assumable loan at 2.8 percent gives buyers a rare chance to lock in a rate far below today’s market while stepping into a well kept home in the growing Royse City area. Located at 2432 Rock Mountain Drive this property offers a practical layout with spacious living areas good natural light and a functional kitchen that opens to the main living space making it ideal for both daily living and hosting. The community also offers a nice pool providing a great spot to cool off and enjoy time with family and friends without the maintenance. The home sits in a quiet neighborhood with easy access to Interstate 30 for a quick commute into Rockwall or Dallas while still enjoying a more relaxed setting. Solid option for buyers looking to save thousands over time with the low rate while getting into a clean move in ready home.
Key facts
- Functional kitchen
- Nice pool
- Practical layout
Tags
Neighborhood map
What this means for you Summary
Snapshot
- This is a 3-bed/2.0-bath single-family listed at $280k.
Deal economics
- At list price, monthly cash flow is $-442 ($-5k/yr) — negative.
- To cash-flow at today's rent, offer at most $202k (27.9% below list).
- To meet the 1% rule (rent ≥ 1% of price), the offer needs to be $214k (23.6% below list).
- Recommended offer: $202k (27.9% below list) — sets the bar for cash-flow.
Location & tenants
- Location reads 75/100 on livability (#158 in TX, #4,292 nationally) — a middle-class / working-renter tenant base. Strengths: crime A+, employment A+, housing A+; Watch: schools C-, amenities F, commute F.
- Royse City ISD (rural): math 42% / reading 42% proficiency, ranked #266 of 826 in TX (top 32%) — families likely to look elsewhere, expect single-tenant / working-renter base with shorter leases.
- Market conditions: Rents soft (-1.1%/yr); 1288 active listings in the ZIP; 31 comparable units currently listed for rent nearby; rentals at typical pace (median 15d on market — plan ~3-4 weeks tenant-placement turnaround); high-income renter base; 1,810 units permitted in Rockwall County in 2024 (0 in 5+ unit buildings).
Forward outlook
- Local home prices are declining (-3.0%/yr); year-one equity from $2k of loan paydown is wiped out by about $8k of value loss. Plan a longer hold.
- Rockwall County population projected at +56% by 2050 — long-run rental-demand tailwind backs the buy-and-hold thesis.
Negotiation context
- It's been on market 83 days — a 6% lower offer ($263k) is reasonable based on typical stale-listing flexibility.
- 3 sale attempts since 6y ago; this cycle's ask has dropped $15k (5%) from the opening price — seller is motivated, your offer sets the floor, not the list.
Risks & watch-outs
- Climate carrying-cost: major wind risk, 27% chance of damaging wind over 30y; extreme-heat days projected 7→24/yr by 2055 (HVAC capex compounding) — expect insurance premiums to compound above CPI over the hold.
Questions for the listing agent
- What do current leases actually rent for vs. the listed asking? Can we see a recent rent roll and the last 12 months of T-12 income?
- It's been on market 83 days. Have you received any prior offers? Is the seller open to a 28% concession, seller financing, or rate buy-down credit?
- What does the HOA fee cover, when was the last increase, and are there any pending special assessments or reserve-fund shortfalls?
- Why hasn't it sold? Are there any deal-killer items the seller is aware of (foundation, flood, title, zoning, code violations)?
- Is there a deadline driving the sale (1031 exchange, divorce, estate, relocation)? That informs how much negotiation room exists.
- The area grade is low — what's the realistic commute time and amenity access for the typical tenant pool here? Any planned neighborhood developments (good or bad) we should know about?
- What's the average days-on-market for RENTAL listings here right now (not sales)? A rising rental-DOM trend means longer vacancies and softer asking-rent achievability than the comps imply.
- What's the recent tenant-quality profile in this submarket — average credit score on applications, eviction rate, late-payment / NSF rate, and stable-employment percentage? A property-management company in the area should have these aggregated.
- How much new for-sale + rental construction is in the pipeline within 1–3 miles? Heavy new supply typically softens prices + rents 12–24 months out; constrained supply supports both.
Investment metrics
- 1% rule
- 0.76% ✗
- Cap rate
- 4.40%
- Cash-on-cash
- -6.77%
- DSCR
- 0.70
- GRM
- 10.9
CMA / ARV
- ARV (median comp)
- $339,590
- List price
- $279,990
- Delta
- -17.55%
- Verdict
- UNDERPRICED
- Comps
- 20 within 1.0 mi
Show comp detail 12 sales within ~0.75 mi
| Address | Dist | Beds/Ba | Sqft | Sold | Price | $/sf | Match |
|---|---|---|---|---|---|---|---|
| 1613 Lesli Dr | 0.20mi | 3/2.0 | 1,553 (-0%) | 6mo | $225,000 | $145 | 85 |
| 1525 Lesli Dr | 0.25mi | 3/2.0 | 1,601 (+3%) | 6mo | $219,000 | $137 | 79 |
| 821 Rowdy Dr | 0.23mi | 3/2.0 | 1,645 (+5%) | 4mo | $239,900 | $146 | 77 |
| 1448 Black Canyon Ave | 0.07mi | 4/2.0 (+1) | 1,704 (+9%) | 13mo | $310,000 | $182 | 66 |
| 1625 Kelly Ln | 0.16mi | 3/2.0 | 1,350 (-14%) | 5mo | $219,000 | $162 | 66 |
| 1501 Kelly Ln | 0.28mi | 3/2.0 | 1,402 (-10%) | 6mo | $229,900 | $164 | 65 |
| 508 Ame Ln | 0.30mi | 4/2.0 (+1) | 1,720 (+10%) | 2mo | $190,000 | $110 | 62 |
| 800 Rowdy Dr | 0.28mi | 3/2.0 | 1,382 (-11%) | 8mo | $236,900 | $171 | 61 |
| 329 Ame Ln | 0.45mi | 3/2.0 | 1,706 (+9%) | 4mo | $269,000 | $158 | 60 |
| 400 Welch Dr | 0.42mi | 3/2.0 | 1,780 (+14%) | 1mo | $285,000 | $160 | 56 |
| 204 Victoria Dr | 0.70mi | 3/2.0 | 1,779 (+14%) | 0mo | $285,000 | $160 | 44 |
| 115 Sandy Ln | 0.67mi | 3/2.0 | 1,781 (+14%) | 8mo | $339,000 | $190 | 38 |
Match score weights: distance 35% · size 25% · config 20% · recency 20%. Top-matched comps best support the ARV.
Projected returns pro-forma
-3.0% appreciation · 0.0% rent growth · sell at horizon
- IRR
- -31.8%
- Equity multiple
- -0.02×
- Total profit
- $-79,639
- Equity at exit
- $41,747
- IRR
- -60.3%
- Equity multiple
- -0.65×
- Total profit
- $-129,200
- Equity at exit
- $24,208
Cash invested: $78,397 (down + closing). Projections, not guarantees.
Landlord ↔ Tenant lean methodology
- Overall (STATE)
- 87 Strongly Landlord-Friendly
- State Texas
- 87 Strongly Landlord-Friendly · R+5
- County
- — inherits STATE
- City
- — inherits STATE
ZIP-level market 75189
- Home prices YoY
- -25.0%
- Rents YoY
- -1.1%
- Active inventory
- 1288
- Price-to-rent
- 10.9×
Monthly cashflow live
- Estimated rent
- $2,139 high interval (Pro) →
- Mortgage (P&I)
- −$1,468
- Tax from tax record
- −$497 /mo · $5,959/yr
- Insurance
- −$117
- HOA
- −$50
- Vacancy / Maint / Mgmt
- −$449
- Net cashflow
- $-442
Break-even live
Sensitivity live
| Price | -10% $-284 | -5% $-363 | +0% $-442 | +5% $-521 | +10% $-601 |
|---|---|---|---|---|---|
| Rent | -10% $-611 | -5% $-527 | +0% $-442 | +5% $-358 | +10% $-273 |
| Rate | -1.0pp $-301 | -0.5pp $-371 | base $-442 | +0.5pp $-515 | +1.0pp $-588 |
UW: 25.0% down · 7.5% · 30yr · 1.5% tax · 5.0% vac · 8.0% maint · 8.0% mgmt
Financing live
Cash to close
- Down payment
- $69,998
- Closing costs
- $8,400
- Reserves months
- —
- Total cash needed
- —
Loan-product check · same deal, 3 products live
Conventional
25% down · 7.5% · 30yr
- Down + closing
- —
- Monthly P&I
- —
- Monthly cashflow
- —
- DSCR
- —
- Eligible?
- —
Personal DTI + credit; lowest rate.
DSCR
20% down · 8.5% · 30yr
- Down + closing
- —
- Monthly P&I
- —
- Monthly cashflow
- —
- DSCR
- —
- Eligible?
- —
No personal income docs; deal must DSCR.
Hard money
10% down · 12.0% · 12mo
- Down + closing
- —
- Monthly P&I
- —
- Monthly cashflow
- —
- DSCR
- —
- Eligible?
- —
Short-term bridge; refi at stabilization.
Rent comps 31 comps
| Address | Beds | Baths | Sqft | Rent | $/sqft | DOM | Units | Dist |
|---|---|---|---|---|---|---|---|---|
| 1612 Audrey Dr Royse City, TX | 3.0 | 2.0 | 1224 | $1,799 | $1.47 | 44d | 1 | 0.15mi |
| 1212 Blue Ridge Pl Royse City, TX | 4.0 | 2.5 | 2245 | $2,450 | $1.09 | 19d | 1 | 0.23mi |
| 1204 Blue Ridge Pl Royse City, TX | 4.0 | 2.0 | 1751 | $2,400 | $1.37 | 3d | 1 | 0.23mi |
| 804 Rowdy Dr Royse City, TX | 3.0 | 2.0 | 1671 | $1,700 | $1.02 | 3d | 1 | 0.25mi |
| 1501 Kelly Ln Royse City, TX | 3.0 | 2.0 | 1402 | $1,925 | $1.37 | 5d | 1 | 0.25mi |
| 6127 Tawakoni Ln Royse City, TX | 4.0 | 2.0 | 1739 | $2,200 | $1.27 | 44d | 1 | 0.26mi |
| 512 Cookston Ln Royse City, TX | 3.0 | 2.0 | 1598 | $1,850 | $1.16 | 24d | 1 | 0.28mi |
| 7307 Village Falls Ln Royse City, TX | 4.0 | 2.0 | 1731 | $2,135 | $1.23 | 20d | 1 | 0.30mi |
| 708 Mackenzie Dr Royse City, TX | 4.0 | 2.0 | 1779 | $1,780 | $1.00 | 44d | 1 | 0.34mi |
| 713 Cooper Ln Royse City, TX | 4.0 | 2.0 | 1859 | $1,900 | $1.02 | 10d | 1 | 0.35mi |
| 320 Cookston Ln Royse City, TX | 3.0 | 2.0 | 2213 | $2,095 | $0.95 | 5d | 1 | 0.46mi |
| 609 Rosemary Dr Royse City, TX | 3.0 | 2.0 | 1759 | $1,835 | $1.04 | 5d | 1 | 0.48mi |
| 609 Rosemary Dr Royse City, TX | 3.0 | 2.0 | 1759 | $1,901 | $1.08 | 13d | 1 | 0.48mi |
| 225 Cookston Ln Royse City, TX | 4.0 | 2.0 | 1651 | $1,825 | $1.11 | 14d | 1 | 0.55mi |
| 225 Cookston Ln Royse City, TX | 4.0 | 2.0 | 1651 | $1,825 | $1.11 | 24d | 1 | 0.55mi |
| 524 Timberhaven Trl Royse City, TX | 3.0 | 2.0 | 1693 | $1,900 | $1.12 | 24d | 1 | 0.58mi |
| 220 Fire Rock Dr Royse City, TX | 3.0 | 2.0 | 1618 | $2,000 | $1.24 | 44d | 1 | 0.83mi |
| 525 Janette Ct Royse City, TX | 4.0 | 3.0 | 2059 | $2,095 | $1.02 | 14d | 1 | 0.99mi |
| 3762 S FM 548 Royse City, TX | 3.0 | 2.0 | 1568 | $1,899 | $1.21 | 5d | 1 | 1.01mi |
| 317 Fire Rock Dr Royse City, TX | 3.0 | 2.0 | 1618 | $2,150 | $1.33 | 5d | 1 | 1.01mi |
| 1023 Lakes Dr Royse City, TX | 2.0–3.0 | 2.0 | 1194 | $1,749 | $1.46 | 2d | 1 | 1.04mi |
| 2044 Hearn Dr Royse City, TX | 4.0 | 3.0 | 2060 | $2,200 | $1.07 | 4d | 1 | 1.27mi |
| 2310 Hankinson Ln Fate, TX | 4.0 | 3.0 | 2069 | $2,345 | $1.13 | 44d | 1 | 1.28mi |
| 1120 Decker Dr Fate, TX | 4.0 | 2.0 | 2092 | $2,400 | $1.15 | 44d | 1 | 1.28mi |
| 1012 Brookhaven Dr Royse City, TX | 3.0 | 2.0 | 1642 | $2,149 | $1.31 | 3d | 1 | 1.32mi |
| 221 Rustic Grove Ln Royse City, TX | 3.0 | 2.0 | 1233 | $1,895 | $1.54 | 44d | 1 | 1.37mi |
| 1332 Pierce St Royse City, TX | 4.0 | 2.0 | 2118 | $2,350 | $1.11 | 44d | 1 | 1.41mi |
| 3251 Everly Dr Fate, TX | 4.0 | 2.0 | 1929 | $2,195 | $1.14 | 44d | 1 | 1.43mi |
| 721 Oak Grove Ln Royse City, TX | 3.0 | 2.0 | 1188 | $1,800 | $1.52 | 3d | 1 | 1.44mi |
| 2432 French St Fate, TX | 4.0 | 2.0 | 1850 | $2,100 | $1.14 | 13d | 1 | 1.46mi |
| 821 Loganwood Dr Royse City, TX | 3.0 | 2.0 | 1291 | $1,725 | $1.34 | 24d | 1 | 1.48mi |
HOA detail
- Monthly dues
- $50 · $600/yr
- Likely covers
- pool
Listing history 22 events
-
2026-06-18days on market $279,990 Active 83 DOM
-
2026-06-17days on market $279,990 Active 82 DOM
-
2026-06-16days on market $279,990 Active 81 DOM
-
2026-06-15days on market $279,990 Active 80 DOM
-
2026-06-13days on market $279,990 Active 78 DOM
-
2026-06-09days on market $279,990 Active 74 DOM
-
2026-06-08days on market $279,990 Active 73 DOM
-
2026-06-07days on market $279,990 Active 72 DOM
-
2026-06-04days on market $279,990 Active 69 DOM
-
2026-06-03days on market $279,990 Active 68 DOM
-
2026-06-02days on market $279,990 Active 67 DOM
-
2026-06-01days on market $279,990 Active 66 DOM
-
2026-05-31days on market $279,990 Active 65 DOM
-
2026-04-11price $291,999 899-char remark
Show marketing remark (899 chars)
PRICE DROP AND SELLER IS NOW OFFERING $5k in closing costs as well! Assumable loan at 2.8 percent gives buyers a rare chance to lock in a rate far below today’s market while stepping into a well kept home in the growing Royse City area. Located at 2432 Rock Mountain Drive this property offers a practical layout with spacious living areas good natural light and a functional kitchen that opens to the main living space making it ideal for both daily living and hosting. The community also offers a nice pool providing a great spot to cool off and enjoy time with family and friends without the maintenance. The home sits in a quiet neighborhood with easy access to Interstate 30 for a quick commute into Rockwall or Dallas while still enjoying a more relaxed setting. Solid option for buyers looking to save thousands over time with the low rate while getting into a clean move in ready home.
-
2026-03-27$295,000 Active 899-char remark
Show marketing remark (899 chars)
PRICE DROP AND SELLER IS NOW OFFERING $5k in closing costs as well! Assumable loan at 2.8 percent gives buyers a rare chance to lock in a rate far below today’s market while stepping into a well kept home in the growing Royse City area. Located at 2432 Rock Mountain Drive this property offers a practical layout with spacious living areas good natural light and a functional kitchen that opens to the main living space making it ideal for both daily living and hosting. The community also offers a nice pool providing a great spot to cool off and enjoy time with family and friends without the maintenance. The home sits in a quiet neighborhood with easy access to Interstate 30 for a quick commute into Rockwall or Dallas while still enjoying a more relaxed setting. Solid option for buyers looking to save thousands over time with the low rate while getting into a clean move in ready home.
-
2021-04-30soldstatus Sold 141-char remark
Show marketing remark (141 chars)
Modern 3 bedroom 2 bathroom single story home with a huge living area. All bedrooms are over-sized and the master walk-in closet is enormous!
-
2021-01-11status Pending 141-char remark
Show marketing remark (141 chars)
Modern 3 bedroom 2 bathroom single story home with a huge living area. All bedrooms are over-sized and the master walk-in closet is enormous!
-
2021-01-04status Active 141-char remark
Show marketing remark (141 chars)
Modern 3 bedroom 2 bathroom single story home with a huge living area. All bedrooms are over-sized and the master walk-in closet is enormous!
-
2020-08-28status Pending 141-char remark
Show marketing remark (141 chars)
Modern 3 bedroom 2 bathroom single story home with a huge living area. All bedrooms are over-sized and the master walk-in closet is enormous!
-
2020-08-27historical 141-char remark
Show marketing remark (141 chars)
Modern 3 bedroom 2 bathroom single story home with a huge living area. All bedrooms are over-sized and the master walk-in closet is enormous!
-
2020-08-27price $230,900 141-char remark
Show marketing remark (141 chars)
Modern 3 bedroom 2 bathroom single story home with a huge living area. All bedrooms are over-sized and the master walk-in closet is enormous!
-
2020-08-19$222,900 Active 141-char remark
Show marketing remark (141 chars)
Modern 3 bedroom 2 bathroom single story home with a huge living area. All bedrooms are over-sized and the master walk-in closet is enormous!
ⓘ Source: listings_history table (triggers on properties + properties_extension) + one-shot
backfill from property_details.listing_events for pre-trigger history.
Tax reassessment forecast TX · Resets to sale price
- Current annual tax
- $5,959 · $497/mo
- Projected year-2 tax
- $5,959 · $497/mo
- Expected delta
- $0/yr ($0/mo · 0.0%)
ⓘ Screening estimate from a state-policy table — verify with the county assessor before closing.
Climate risk First Street
- Flood 1/10 Low FEMA zone X (unshaded) · 0% chance over 30 yrs
- Wildfire 3/10 Moderate
- Heat 8/10 Severe 7 d/yr ≥110°F today · 24 d/yr by 30 yrs out
- Wind 6/10 Major 27% chance of damaging wind over 30 yrs
- Air quality 2/10 Low 1 unhealthy d/yr today · 1 by 30 yrs out
Nearby sold comps map
Loading sold comps map…
Walkable amenities ~0.75 mi
Loading nearby amenities…
Taxation est. · year 1
- Rental income
- $25,663
- − Mortgage interest
- −$15,684
- − Property taxes
- −$5,959
- − Insurance
- −$1,400
- − Repairs & maintenance
- −$2,053
- − Management
- −$2,053
- − HOA
- −$600
- − Depreciation
- −$8,145
- Taxable loss
- −$10,231
- Est. tax savings @ 24.0%
- +$2,455
- After-tax cash flow
- $-2,849/yr
For passive investors: Depreciation is non-cash, so a rental often shows a tax loss while cash-flowing — sheltering income. Rental losses are passive: they offset passive income freely, and up to $25,000/yr can offset ordinary (W-2) income if you actively participate and your MAGI is under $100k (phasing out to $0 by $150k); unused losses carry forward. On sale, claimed depreciation is recaptured at up to 25%, and gains may owe capital-gains tax (a 1031 exchange can defer both). Figures are a year-1 estimate at your 24.0% rate — not tax advice; consult a CPA.
Schools (NCES district)
- District
- Royse City ISD
- NCES district ID
- 4838220
- Math proficiency
- 42% ▼ -10.00%
- Reading proficiency
- 42% ▼ -5.00%
- Median HH income
- $73,810
- Composite
- 38.44/100
- National rank
- #4197
- State rank
- #266 of 826 in TX
Livability — Royse City
- Score
- 75/100
- State rank
- #158
- US rank
- #4292
Category grades
Schools grade is shown separately in the Schools card above.
Census & demographics
- Census place
- Royse City, TX
- County
- Rockwall County · 132,930 people
- City population
- 48,739
- Metro
- Dallas-Fort Worth-Arlington, TX
- Population (ZIP)
- 48,739
- Household income
- $117,125
- Rent vs Own
- Severe rent burden
- 569.0
Population outlook (Rockwall County) Hauer SSP2
- Today (2025)
- 118,396 people
- By 2030
- 132,209 · +11.7%
- By 2040
- 159,538 · +34.7%
- By 2050
- 185,299 · +56.5%
- By 2075
- 243,489 · +105.7%
- By 2100
- 277,814 · +134.6%
Race, ethnicity, and origin ACS 2023
- Neighborhood character
- Diverse neighborhood (Simpson 0.57)
- Race & ethnicity
- White 60% Hispanic / Latino 25% Two or more races 12% Black 10% Asian 2%
- Hispanic origin (detail)
- Mexican 20%
- Common ancestry
- Slovak 2% Serbian 1% Lithuanian 1%
- Foreign-born
- 10% · Canada, Philippines, Jamaica
- Languages at home
- 80% English-only · Spanish 15% Other Indo-European 1%
Political lean MEDSL · Rockwall
- 2024 margin
- Solid R (+40.9) · D 29.1% · R 70.0%
- 2008→2024 swing
- +5.3pp toward D · 2008: -46.2pp · 2024: -40.9pp
- All cycles
- 2024: R+40.9 2020: R+37.7 2016: R+47.5 2012: R+53.3 2008: R+46.2
Not yet ingested
- Civics
- —
Market trends
- HPI YoY
- ▼ -71.10%
- Current HPI
- 212.8422
- Rent YoY
- ▼ -1.13%
- Metro
- Dallas-Fort Worth-Arlington, TX
- State GDP YoY
- ▲ 3.95%
- F500 in state
- 110
Industry mix (Fortune 500 HQ in TX)
| Industry | F500 HQs | Revenue |
|---|---|---|
| Energy | 16 | $1,198B |
|
||
| Technology | 5 | $198B |
|
||
| Engineering / Construction | 4 | $72B |
|
||
| Energy Services | 3 | $60B |
|
||
| Utilities | 3 | $41B |
|
||
| Healthcare | 2 | $330B |
|
||
Price history
+31.0% since first listed9 events — show timeline
- 2026-04-11 Price Changed $291,999 NTREIS
- 2026-03-27 Listed $295,000 NTREIS
- 2021-04-30 Sold (MLS) — NTREIS
- 2021-01-11 Pending — NTREIS
- 2021-01-04 Relisted — NTREIS
- 2020-08-28 Pending — NTREIS
- 2020-08-27 Price Changed $230,900 NTREIS
- 2020-08-27 Listing Removed — NTREIS
- 2020-08-19 Listed $222,900 NTREIS
Property tax history
+15.3%/yrLatest (2025): $5,959 · -0.2% YoY. Source: county tax records.
Cash-flow waterfall
monthlySold comps — $/sqft
last 12 mo · ≤1 miLoading sold comps…