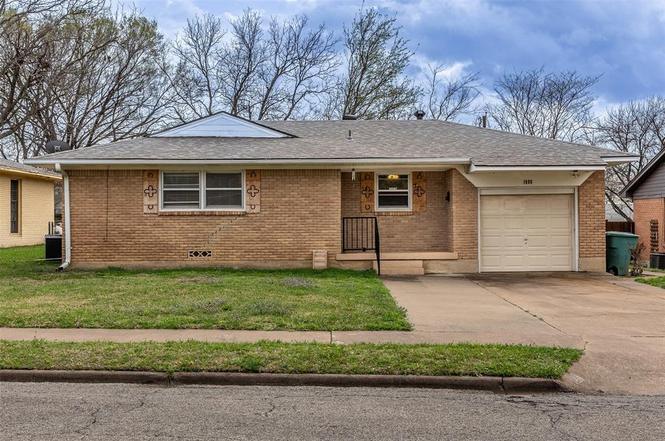
1808 W College St · Sherman, TX
Flood risk 1/10 · Minimal
- FEMA flood zone
- X (unshaded)
- Chance of flooding over 30 yrs
- 0.0%
- Est. flood insurance / yr
- $507 – $1,088
Fire risk 4/10 · Minor
- Est. fire insurance / yr
- $1,222 – $2,270
Heat risk 6/10 · Moderate
- Hot days now (above 108°F)
- 7 days/yr
- Hot days in 30 yrs
- 22 days/yr
Wind risk 4/10 · Minor
- Chance of severe wind over 30 yrs
- 23.0%
Air-quality risk 3/10 · Minor
- Unhealthy air days now
- 2 days/yr
- Unhealthy air days in 30 yrs
- 3 days/yr
Risk factors via First Street. Map © Google.
Why this score? — see what drove the C grade
The composite is a weighted blend of 9 inputs, each scored 0–100. Each bar is that input's sub-score; the figure is the points it added to the 100-point composite (weight × sub-score).
- Cash flow +19.6/30.0
- ARV discount +15.0/15.0
- 1% rule +6.7/10.0
- DSCR +6.2/10.0
- Livability +3.1/5.0
- Schools +2.9/10.0
- Condition / age +2.5/5.0
- Rent growth +1.9/5.0
- Appreciation +0.0/10.0
$125,000
🖨 Deal sheet 📄 Offer letter ✓ Due diligence
Listing remarks MLS
LOCATION! LOCATION! Three spacious bedrooms. Bath updated, large living room and dining room have wood flooring, laminate. Newer dishwasher, extra large open kitchen with lots of cabinets. Wonderful neighborhood. Sunroom has additional square footage to total. Full sprinkler system, large fenced in yard. Mature trees, many flowers and colors. Storage building is another bonus. Owner is selling As Is.
Key facts
- 8,059 sq ft lot
- Garage
- Built 1958
Neighborhood map
What this means for you Summary
Snapshot
- This is a 3-bed/1.0-bath single-family listed at $125k.
Deal economics
- At list price, monthly cash flow is $143 ($2k/yr) — positive.
- The deal already cash-flows at list — no discount required.
- Meets the 1% rule at list price ($1k rent vs $125k).
- Recommended offer: $123k (1.5% below list) — sets the bar for market timing.
- Cap rate 7.7% vs local median 3.7% in Sherman — top-decile yield for the area; either an underpriced asset or a hidden risk that comps aren't pricing in. Stress-test before assuming the spread holds.
Location & tenants
- Location reads 61/100 on livability (#1,027 in TX) — a middle-class / working-renter tenant base. Strengths: cost of living A+, housing A+; Watch: crime C-, employment C-, amenities F.
- Sherman ISD (urban): math 31% / reading 37% proficiency, ranked #546 of 826 in TX (top 66%) — families likely to look elsewhere, expect single-tenant / working-renter base with shorter leases.
- Zoned schools: Fairview El (math 32% / reading 37%, grade F, #1,995 of 4,322 statewide, top 50%, 294 students, 75% FRL) — zoned schools average 75% FRL vs 60% district-wide (15 pts higher); higher-poverty schools than district average — tighter screening recommended.
- Market conditions: Rents soft (-2.4%/yr); 636 active listings in the ZIP; 40 comparable units currently listed for rent nearby; rentals lingering (median 44d on market — plan ~5-8 weeks vacancy on turnover, expect pricing pressure); 55% of comp listings sitting > 30 days — soft ceiling on asking rent; 2,272 units permitted in Grayson County in 2024 (750 in 5+ unit buildings).
Forward outlook
- Local home prices are declining (-3.0%/yr); year-one equity from $864 of loan paydown is wiped out by about $4k of value loss. Plan a longer hold.
- Grayson County population projected at +12% by 2050 — modest demand growth; plan on rents tracking national, not racing it.
Negotiation context
- It's been on market 19 days — a 2% lower offer ($123k) is reasonable based on typical stale-listing flexibility.
- 4 sale attempts since 15y ago; this cycle's ask has dropped $40k (24%) from the opening price — seller is motivated, your offer sets the floor, not the list.
Risks & watch-outs
- Watch-outs: property tax is 2.9% of price; built in 1958 — expect roof / HVAC / electrical / plumbing capex.
- Climate carrying-cost: extreme-heat days projected 7→22/yr by 2055 (HVAC capex compounding) — expect insurance premiums to compound above CPI over the hold.
Questions for the listing agent
- Built in 1958 — when were the roof, HVAC, electrical panel, plumbing, and water heater last replaced?
- Property tax is high relative to price — has the assessment been appealed recently, and will the sale trigger a re-assessment?
- Is there a deadline driving the sale (1031 exchange, divorce, estate, relocation)? That informs how much negotiation room exists.
- Schools are D-rated, which usually means shorter tenancies and higher turnover. Who's the typical renter profile here, and what's been the actual vacancy rate?
- What's the average days-on-market for RENTAL listings here right now (not sales)? A rising rental-DOM trend means longer vacancies and softer asking-rent achievability than the comps imply.
- What's the recent tenant-quality profile in this submarket — average credit score on applications, eviction rate, late-payment / NSF rate, and stable-employment percentage? A property-management company in the area should have these aggregated.
- How much new for-sale + rental construction is in the pipeline within 1–3 miles? Heavy new supply typically softens prices + rents 12–24 months out; constrained supply supports both.
Investment metrics
- 1% rule
- 1.17% ✓
- Cap rate
- 7.67%
- Cash-on-cash
- 4.91%
- DSCR
- 1.22
- GRM
- 7.1
CMA / ARV
- ARV (on-the-fly)
- $182,723
- Comps found
- 12
Show comp detail 12 sales within ~0.75 mi
| Address | Dist | Beds/Ba | Sqft | Sold | Price | $/sf | Match |
|---|---|---|---|---|---|---|---|
| 1808 W College St | 0.00mi | 3/2.0 | 1,121 (0%) | 2mo | $125,000 | $112 | 95 |
| 1809 W Birge St | 0.09mi | 3/1.5 | 1,248 (+11%) | 2mo | $199,500 | $160 | 73 |
| 1711 W Birge St | 0.10mi | 3/2.0 | 1,219 (+9%) | 7mo | $209,900 | $172 | 71 |
| 1003 Blanton Dr | 0.15mi | 3/2.0 | 1,221 (+9%) | 6mo | $209,740 | $172 | 69 |
| 1709 W Birge St | 0.11mi | 3/2.0 | 1,230 (+10%) | 8mo | $199,999 | $163 | 68 |
| 1822 Glenway Dr | 0.46mi | 3/2.0 | 1,076 (-4%) | 4mo | $150,000 | $139 | 64 |
| 900 W Sycamore St | 0.68mi | 3/1.0 | 1,140 (+2%) | 2mo | $160,000 | $140 | 64 |
| 1517 N Highland Ave | 0.66mi | 3/1.0 | 1,100 (-2%) | 5mo | $179,000 | $163 | 62 |
| 646 Denton Dr | 0.72mi | 3/1.5 | 1,191 (+6%) | 4mo | $199,900 | $168 | 50 |
| 1318 Kessler Blvd | 0.49mi | 2/2.0 (-1) | 1,224 (+9%) | 6mo | $224,800 | $184 | 48 |
| 1402 Hillcrest Dr | 0.66mi | 3/1.5 | 1,216 (+8%) | 8mo | $177,500 | $146 | 46 |
| 702 Kessler Blvd | 0.63mi | 3/1.0 | 1,289 (+15%) | 11mo | $235,000 | $182 | 36 |
Match score weights: distance 35% · size 25% · config 20% · recency 20%. Top-matched comps best support the ARV.
Projected returns pro-forma
-3.0% appreciation · 0.0% rent growth · sell at horizon
- IRR
- -12.5%
- Equity multiple
- 0.56×
- Total profit
- $-15,315
- Equity at exit
- $18,638
- IRR
- -9.8%
- Equity multiple
- 0.49×
- Total profit
- $-17,713
- Equity at exit
- $10,808
Cash invested: $35,000 (down + closing). Projections, not guarantees.
Landlord ↔ Tenant lean methodology
- Overall (STATE)
- 87 Strongly Landlord-Friendly
- State Texas
- 87 Strongly Landlord-Friendly · R+5
- County
- — inherits STATE
- City
- — inherits STATE
ZIP-level market 75092
- Rents YoY
- -2.4%
- Active inventory
- 636
- Price-to-rent
- 7.1×
Monthly cashflow live
- Estimated rent
- $1,464 high interval (Pro) →
- Mortgage (P&I)
- −$656
- Tax from tax record
- −$306 /mo · $3,670/yr
- Insurance
- −$52
- HOA
- −$0
- Vacancy / Maint / Mgmt
- −$307
- Net cashflow
- $143
Break-even live
UW: 25.0% down · 7.5% · 30yr · 1.5% tax · 5.0% vac · 8.0% maint · 8.0% mgmt
Financing live
Cash to close
- Down payment
- $31,250
- Closing costs
- $3,750
- Reserves months
- —
- Total cash needed
- —
Loan-product check · same deal, 3 products live
Conventional
25% down · 7.5% · 30yr
- Down + closing
- —
- Monthly P&I
- —
- Monthly cashflow
- —
- DSCR
- —
- Eligible?
- —
Personal DTI + credit; lowest rate.
DSCR
20% down · 8.5% · 30yr
- Down + closing
- —
- Monthly P&I
- —
- Monthly cashflow
- —
- DSCR
- —
- Eligible?
- —
No personal income docs; deal must DSCR.
Hard money
10% down · 12.0% · 12mo
- Down + closing
- —
- Monthly P&I
- —
- Monthly cashflow
- —
- DSCR
- —
- Eligible?
- —
Short-term bridge; refi at stabilization.
Rent comps 40 comps
| Address | Beds | Baths | Sqft | Rent | $/sqft | DOM | Units | Dist |
|---|---|---|---|---|---|---|---|---|
| 1811 W College St Sherman, TX | 3.0 | 1.0 | 1150 | $1,395 | $1.21 | 43d | 1 | 0.07mi |
| 1712 W Birge St Sherman, TX | 3.0 | 2.0 | 1260 | $1,695 | $1.35 | 43d | 1 | 0.09mi |
| 1800 W Washington St Sherman, TX | 1.0–3.0 | 1.0–2.0 | 918 | $1,100 | $1.20 | 21d | 77 | 0.16mi |
| 1500 N Grant Dr Unit B Sherman, TX | 2.0 | 2.0 | 1256 | $1,250 | $1.00 | 43d | 1 | 0.40mi |
| 1500 N Grant Dr Unit A Sherman, TX | 3.0 | 2.0 | 1256 | $1,500 | $1.19 | 43d | 1 | 0.40mi |
| 1509 N Grant Dr Sherman, TX | 2.0 | 1.0 | 839 | $1,250 | $1.49 | 43d | 1 | 0.42mi |
| 2111 Wyldewood Way Sherman, TX | 3.0 | 2.0 | 1433 | $1,950 | $1.36 | 43d | 1 | 0.51mi |
| 1900 W Taylor St Sherman, TX | 1.0–2.0 | 1.5 | 963 | $1,495 | $1.55 | 21d | 1 | 0.51mi |
| 1404 Park Pl Sherman, TX | 3.0 | 2.0 | 1150 | $1,400 | $1.22 | 43d | 1 | 0.56mi |
| 1200 W Taylor St Sherman, TX | 1.0–2.0 | 1.0–2.0 | 814 | $849 | $1.04 | 21d | 42 | 0.60mi |
| 1420 Park Pl Unit 001 Sherman, TX | 2.0 | 1.0 | 800 | $1,050 | $1.31 | 21d | 1 | 0.60mi |
| 1420 Park Pl Sherman, TX | 2.0 | 1.0 | 800 | $1,000 | $1.25 | 43d | 1 | 0.60mi |
| 1925 W Taylor St Sherman, TX | 1.0–2.0 | 1.0–2.0 | 779 | $999 | $1.28 | 21d | 9 | 0.61mi |
| 1350 W Taylor St Sherman, TX | 1.0–3.0 | 1.0–2.0 | 1153 | $2,250 | $1.95 | 21d | 129 | 0.61mi |
| 1402 Hillcrest Dr Sherman, TX | 3.0 | 1.5 | 1216 | $1,595 | $1.31 | 43d | 1 | 0.63mi |
| 1811 Park Pl Sherman, TX | 3.0 | 2.0 | 1326 | $1,425 | $1.07 | 21d | 1 | 0.69mi |
| 1809 Park Pl Sherman, TX | 3.0 | 2.0 | 1326 | $1,425 | $1.07 | 21d | 1 | 0.69mi |
| 2300 W Taylor St Sherman, TX | 1.0–2.0 | 1.0–2.0 | 767 | $1,299 | $1.69 | 21d | 26 | 0.70mi |
| 1920 W Shields Dr Sherman, TX | 1.0–2.0 | 1.0–2.0 | 800 | $1,150 | $1.44 | 21d | 2 | 0.75mi |
| 221 Archer Dr Sherman, TX | 1.0–3.0 | 1.0–2.0 | 1000 | $1,399 | $1.40 | 21d | 9 | 0.76mi |
| 930 W Freeman St Sherman, TX | 3.0 | 2.0 | 1222 | $1,499 | $1.23 | 21d | 1 | 0.87mi |
| 1706 N Ricketts St Sherman, TX | 3.0 | 2.0 | 1106 | $1,600 | $1.45 | 21d | 1 | 0.88mi |
| 914 W Washington St Unit F Sherman, TX | 2.0 | 1.5 | 1287 | $1,165 | $0.91 | 43d | 1 | 0.89mi |
| 907 W Birge St Sherman, TX | 2.0 | 2.0 | 952 | $1,100 | $1.16 | 43d | 1 | 0.89mi |
| 822 W Fischer St Sherman, TX | 3.0 | 1.0 | 1256 | $1,350 | $1.07 | 21d | 1 | 0.92mi |
| 106 N McKown Ave Sherman, TX | 2.0 | 1.0 | 1066 | $1,050 | $0.98 | 21d | 1 | 0.92mi |
| 207 N Highland Ave Sherman, TX | 2.0 | 1.0 | 1175 | $1,300 | $1.11 | 43d | 1 | 0.94mi |
| 114 S Holly Ave Sherman, TX | 3.0 | 1.5 | 1440 | $1,195 | $0.83 | 43d | 1 | 0.94mi |
| 814 W College St Sherman, TX | 2.0 | 2.0 | 1100 | $1,150 | $1.05 | 43d | 1 | 0.94mi |
| 524-526 N Woods St Sherman, TX | 3.0 | 2.0 | 1454 | $1,445 | $0.99 | 43d | 1 | 0.99mi |
| 214 N Ricketts St Sherman, TX | 3.0 | 2.0 | 1211 | $1,550 | $1.28 | 43d | 1 | 1.02mi |
| 301 N Heritage Pkwy Sherman, TX | 1.0–2.0 | 1.0–2.0 | 820 | $1,134 | $1.38 | 43d | 24 | 1.03mi |
| 301 N Heritage Pkwy Sherman, TX | 1.0–2.0 | 1.0–2.0 | 820 | $1,160 | $1.41 | 21d | 27 | 1.03mi |
| 820 N Sam Rayburn Fwy Unit 204 Sherman, TX | 2.0 | 1.5 | 1027 | $1,350 | $1.31 | 43d | 1 | 1.05mi |
| 1615 N Alexander St Sherman, TX | 2.0 | 1.0 | 826 | $950 | $1.15 | 21d | 1 | 1.10mi |
| 906 W Houston St Sherman, TX | 2.0 | 1.0 | 989 | $1,175 | $1.19 | 43d | 1 | 1.10mi |
| 908 W Houston St Sherman, TX | 2.0 | 1.0 | 989 | $1,299 | $1.31 | 21d | 1 | 1.10mi |
| 1916 N Alexander St Sherman, TX | 3.0 | 2.0 | 1240 | $1,575 | $1.27 | 43d | 1 | 1.15mi |
| 817 W Lamar St Sherman, TX | 3.0 | 2.0 | 1074 | $1,495 | $1.39 | 43d | 1 | 1.18mi |
| 302 W Pelton St Sherman, TX | 2.0 | 2.0 | 958 | $1,450 | $1.51 | 43d | 1 | 1.19mi |
Listing history 13 events
-
2026-04-29soldstatus
-
2026-04-15status Pending
-
2026-04-11price $125,000
-
2026-04-10status Active
-
2026-03-25status Pending
-
2026-03-19status Active
-
2026-03-16status Pending
-
2026-03-09$165,000 Active
-
2011-06-03soldstatus Closed 404-char remark
Show marketing remark (404 chars)
LOCATION! LOCATION! Three spacious bedrooms. Bath updated, large living room and dining room have wood flooring, laminate. Newer dishwasher, extra large open kitchen with lots of cabinets. Wonderful neighborhood. Sunroom has additional square footage to total. Full sprinkler system, large fenced in yard. Mature trees, many flowers and colors. Storage building is another bonus. Owner is selling As Is.
-
2011-06-03soldstatus
Show marketing remark (404 chars)
LOCATION! LOCATION! Three spacious bedrooms. Bath updated, large living room and dining room have wood flooring, laminate. Newer dishwasher, extra large open kitchen with lots of cabinets. Wonderful neighborhood. Sunroom has additional square footage to total. Full sprinkler system, large fenced in yard. Mature trees, many flowers and colors. Storage building is another bonus. Owner is selling As Is.
-
2011-05-27status Pending 404-char remark
Show marketing remark (404 chars)
LOCATION! LOCATION! Three spacious bedrooms. Bath updated, large living room and dining room have wood flooring, laminate. Newer dishwasher, extra large open kitchen with lots of cabinets. Wonderful neighborhood. Sunroom has additional square footage to total. Full sprinkler system, large fenced in yard. Mature trees, many flowers and colors. Storage building is another bonus. Owner is selling As Is.
-
2011-05-16$74,900 Active 404-char remark
Show marketing remark (404 chars)
LOCATION! LOCATION! Three spacious bedrooms. Bath updated, large living room and dining room have wood flooring, laminate. Newer dishwasher, extra large open kitchen with lots of cabinets. Wonderful neighborhood. Sunroom has additional square footage to total. Full sprinkler system, large fenced in yard. Mature trees, many flowers and colors. Storage building is another bonus. Owner is selling As Is.
-
2007-06-01soldstatus
ⓘ Source: listings_history table (triggers on properties + properties_extension) + one-shot
backfill from property_details.listing_events for pre-trigger history.
Tax reassessment forecast TX · Resets to sale price
- Current annual tax
- $3,670 · $306/mo
- Projected year-2 tax
- $3,670 · $306/mo
- Expected delta
- $0/yr ($0/mo · 0.0%)
ⓘ Screening estimate from a state-policy table — verify with the county assessor before closing.
Climate risk First Street
- Flood 1/10 Low FEMA zone X (unshaded) · 0% chance over 30 yrs
- Wildfire 4/10 Moderate
- Heat 6/10 Major 7 d/yr ≥108°F today · 22 d/yr by 30 yrs out
- Wind 4/10 Moderate 23% chance of damaging wind over 30 yrs
- Air quality 3/10 Moderate 2 unhealthy d/yr today · 3 by 30 yrs out
Nearby sold comps map
Loading sold comps map…
Walkable amenities ~0.75 mi
Loading nearby amenities…
Taxation est. · year 1
- Rental income
- $17,568
- − Mortgage interest
- −$7,002
- − Property taxes
- −$3,670
- − Insurance
- −$625
- − Repairs & maintenance
- −$1,405
- − Management
- −$1,405
- − Depreciation
- −$3,636
- Taxable loss
- −$176
- Est. tax savings @ 24.0%
- +$42
- After-tax cash flow
- $1,760/yr
For passive investors: Depreciation is non-cash, so a rental often shows a tax loss while cash-flowing — sheltering income. Rental losses are passive: they offset passive income freely, and up to $25,000/yr can offset ordinary (W-2) income if you actively participate and your MAGI is under $100k (phasing out to $0 by $150k); unused losses carry forward. On sale, claimed depreciation is recaptured at up to 25%, and gains may owe capital-gains tax (a 1031 exchange can defer both). Figures are a year-1 estimate at your 24.0% rate — not tax advice; consult a CPA.
Schools (NCES district)
- District
- Sherman ISD
- NCES district ID
- 4840080
- Math proficiency
- 31% ▼ -9.00%
- Reading proficiency
- 37% ▼ -2.00%
- Median HH income
- $42,587
- Composite
- 28.79/100
- National rank
- #6665
- State rank
- #546 of 826 in TX
Livability — Sherman
- Score
- 61/100
- State rank
- #1027
- US rank
- #18243
Category grades
Schools grade is shown separately in the Schools card above.
Census & demographics
- Census place
- Sherman, TX
- County
- Grayson County · 108,053 people
- City population
- 54,936
- Metro
- Sherman-Denison, TX
- Population (ZIP)
- 28,342
- Household income
- $68,036
- Rent vs Own
- Severe rent burden
- 1278.0
Population outlook (Grayson County) Hauer SSP2
- Today (2025)
- 134,540 people
- By 2030
- 138,653 · +3.1%
- By 2040
- 145,958 · +8.5%
- By 2050
- 151,218 · +12.4%
- By 2075
- 161,802 · +20.3%
- By 2100
- 159,036 · +18.2%
Race, ethnicity, and origin ACS 2023
- Neighborhood character
- Predominantly White (77%)
- Race & ethnicity
- White 77% Hispanic / Latino 10% Two or more races 8% Black 6% Asian 3%
- Hispanic origin (detail)
- Mexican 8%
- Common ancestry
- Italian 3% Slovak 3% Lithuanian 2%
- Foreign-born
- 6% · Canada, South Korea
- Languages at home
- 92% English-only · Spanish 5% Other Indo-European 1%
Political lean MEDSL · Grayson
- 2024 margin
- Solid R (+54.3) · D 22.5% · R 76.7%
- 2008→2024 swing
- -16.4pp toward R · 2008: -37.9pp · 2024: -54.3pp
- All cycles
- 2024: R+54.3 2020: R+49.9 2016: R+53.1 2012: R+48.0 2008: R+37.9
Not yet ingested
- Civics
- —
Market trends
- HPI YoY
- ▼ -201.47%
- Current HPI
- 235.984
- Rent YoY
- ▼ -2.36%
- Metro
- Sherman-Denison, TX
- State GDP YoY
- ▲ 3.95%
- F500 in state
- 110
Industry mix (Fortune 500 HQ in TX)
| Industry | F500 HQs | Revenue |
|---|---|---|
| Energy | 16 | $1,198B |
|
||
| Technology | 5 | $198B |
|
||
| Engineering / Construction | 4 | $72B |
|
||
| Energy Services | 3 | $60B |
|
||
| Utilities | 3 | $41B |
|
||
| Healthcare | 2 | $330B |
|
||
Price history
+66.9% since first listed13 events — show timeline
- 2026-04-29 Sold (Public Records) — Public Records
- 2026-04-15 Pending — NTREIS
- 2026-04-11 Price Changed $125,000 NTREIS
- 2026-04-10 Relisted — NTREIS
- 2026-03-25 Pending — NTREIS
- 2026-03-19 Relisted — NTREIS
- 2026-03-16 Pending — NTREIS
- 2026-03-09 Listed $165,000 NTREIS
- 2011-06-03 Sold (Public Records) — Public Records
- 2011-06-03 Sold (MLS) — NTREIS
- 2011-05-27 Pending — NTREIS
- 2011-05-16 Listed $74,900 NTREIS
- 2007-06-01 Sold (Public Records) — Public Records
Property tax history
+7.0%/yrLatest (2025): $3,670 · +10.0% YoY. Source: county tax records.
Cash-flow waterfall
monthlySold comps — $/sqft
last 12 mo · ≤1 miLoading sold comps…