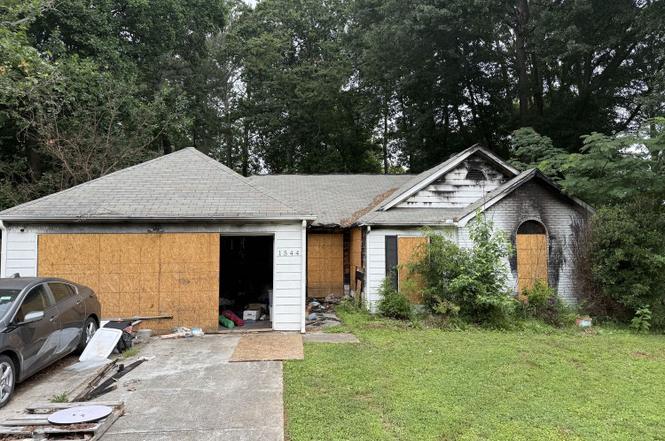
1544 Canberra Dr · Redan, GA
Flood risk 1/10 · Minimal
- FEMA flood zone
- X (unshaded)
- Chance of flooding over 30 yrs
- 0.0%
- Est. flood insurance / yr
- $507 – $1,088
Fire risk 1/10 · Minimal
- Est. fire insurance / yr
- $963 – $1,789
Heat risk 5/10 · Moderate
- Hot days now (above 104°F)
- 7 days/yr
- Hot days in 30 yrs
- 18 days/yr
Wind risk 5/10 · Moderate
- Chance of severe wind over 30 yrs
- 25.0%
Air-quality risk 5/10 · Moderate
- Unhealthy air days now
- 7 days/yr
- Unhealthy air days in 30 yrs
- 10 days/yr
Risk factors via First Street. Map © Google.
Why this score? — see what drove the B- grade
The composite is a weighted blend of 9 inputs, each scored 0–100. Each bar is that input's sub-score; the figure is the points it added to the 100-point composite (weight × sub-score).
- Cash flow +30.0/30.0
- 1% rule +10.0/10.0
- DSCR +10.0/10.0
- ARV discount +7.5/15.0
- Rent growth +3.4/5.0
- Livability +3.2/5.0
- Condition / age +2.5/5.0
- Schools +2.1/10.0
- Appreciation +0.0/10.0
$75,000
🖨 Deal sheet 📄 Offer letter ✓ Due diligence
Listing remarks MLS
Investor Special! This fire-damaged property presents a unique opportunity for experienced investors, contractors, or builders. The home has sustained significant damage and is being sold strictly as-is. Excellent potential for renovation, rebuild, or redevelopment. Enter at your own risk and with caution. PLEASE SIGN HOLD HARMLESS.
Key facts
- 0.34 acre lot
- 2 garage spots
- Built 1988
Property features AI
Exterior
- Parking: 2 total parking spaces; 2-car garage
- Utilities: Public water; Public sewer; Utilities otherwise unspecified
- Home design: Single-level (one story); Frame and other construction materials; Composition roof; Slab foundation
- Construction: Frame construction; Composition roof; Slab foundation; Property listed in fixer condition
- Exterior features: Back yard fencing; Terrace patio/porch; Exterior described as other
Interior
- Kitchen: Kitchen with unspecified/other features; Dining area with unspecified/other features; Appliances listed as other
- Bedrooms: Three bedrooms on the main level
- Flooring: Flooring described as other
- Bathrooms: Two full bathrooms, both on the main level; Master bathroom with non-standard features
- Heating & cooling: Central heating
- Interior features: One fireplace; No shared/common walls; Fixer condition
- Laundry & utility: Laundry/utility details not specified
Neighborhood map
What this means for you Summary
Snapshot
- This is a 3-bed/2.0-bath single-family listed at $75k.
Deal economics
- At list price, monthly cash flow is $974 ($12k/yr) — positive.
- The deal already cash-flows at list — no discount required.
- Meets the 1% rule at list price ($2k rent vs $75k).
- Cap rate 21.9% vs local median 5.4% in Redan — top-decile yield for the area; either an underpriced asset or a hidden risk that comps aren't pricing in. Stress-test before assuming the spread holds.
Location & tenants
- Location reads 64/100 on livability (#274 in GA) — a middle-class / working-renter tenant base. Strengths: cost of living A+, housing A+; Watch: crime D, amenities F, commute F.
- Dekalb County (suburban): math 19% / reading 28% proficiency, ranked #125 of 174 in GA (top 72%) — low school quality limits family demand, transient renter base, plan for 1-2y turnover; 68% free/reduced lunch — lower-income household profile, screen leases tightly.
- Zoned schools: Woodridge Elementary School (math 8% / reading 12%, grade F, #1,092 of 1,228 statewide, top 91%, 475 students, 97% FRL); Miller Grove Middle School (math 8% / reading 18%, grade F, #410 of 470 statewide, top 87%, 722 students, 100% FRL); Redan High School (math 8% / reading 17%, grade F, #336 of 424 statewide, top 80%, 951 students, 100% FRL) — zoned schools average 99% FRL vs 68% district-wide (32 pts higher); higher-poverty schools than district average — tighter screening recommended.
- Market conditions: Rents rising (+3.7%/yr); 215 active listings in the ZIP; 37 comparable units currently listed for rent nearby; rentals leasing fast (median 13d on market — plan ~1-2 weeks tenant-placement turnaround); 1,240 units permitted in DeKalb County in 2024 (385 in 5+ unit buildings).
- This rent runs 32% of the median local income ($70k/yr) — at the standard rent-burdened threshold; future hikes will face affordability resistance.
Forward outlook
- Local home prices are declining (-3.0%/yr); year-one equity from $519 of loan paydown is wiped out by about $2k of value loss. Plan a longer hold.
- DeKalb County population projected at +28% by 2050 — long-run rental-demand tailwind backs the buy-and-hold thesis.
- At projected returns (-3.0% appreciation + 3.7% rent growth), your $21k cash investment doubles in ~3 years — after that, you're playing with house money.
Negotiation context
- Only 8 days on market — expect competitive offers; lowballing is unlikely to land.
- 12 sale attempts since 8y ago with the ask held roughly flat each time — persistent listings suggest the price (not the market) is what's stuck; bring a comps-based counter.
Risks & watch-outs
- Climate carrying-cost: moderate wind risk, 25% chance of damaging wind over 30y; extreme-heat days projected 7→18/yr by 2055 (HVAC capex compounding) — expect insurance premiums to compound above CPI over the hold.
Questions for the listing agent
- Is there a deadline driving the sale (1031 exchange, divorce, estate, relocation)? That informs how much negotiation room exists.
- Schools are B-rated — typically a magnet for longer-tenancy family renters. What's the average tenant stay here, and is there a school-zone premium baked into asking?
- Crime grade is D in this area — have there been break-ins, vandalism, or insurance claims at this property in the last 3 years? What carrier currently insures it and at what premium?
- What's the average days-on-market for RENTAL listings here right now (not sales)? A rising rental-DOM trend means longer vacancies and softer asking-rent achievability than the comps imply.
- What's the recent tenant-quality profile in this submarket — average credit score on applications, eviction rate, late-payment / NSF rate, and stable-employment percentage? A property-management company in the area should have these aggregated.
- How much new for-sale + rental construction is in the pipeline within 1–3 miles? Heavy new supply typically softens prices + rents 12–24 months out; constrained supply supports both.
Investment metrics
- 1% rule
- 2.52% ✓
- Cap rate
- 21.88%
- Cash-on-cash
- 55.68%
- DSCR
- 3.48
- GRM
- 3.3
CMA / ARV
- ARV (on-the-fly)
- $245,340
- Comps found
- 12
Show comp detail 12 sales within ~0.75 mi
| Address | Dist | Beds/Ba | Sqft | Sold | Price | $/sf | Match |
|---|---|---|---|---|---|---|---|
| 1584 S Hairston Rd | 0.11mi | 4/2.0 (+1) | 1,569 (-7%) | 2mo | $285,000 | $182 | 76 |
| 4828 White Oak Tree | 0.37mi | 3/2.0 | 1,757 (+4%) | 4mo | $160,000 | $91 | 73 |
| 4859 Terrace Green Trce | 0.38mi | 3/2.0 | 1,833 (+8%) | 0mo | $245,000 | $134 | 68 |
| 4448 Cedar Ridge Trl | 0.61mi | 3/2.0 | 1,617 (-4%) | 4mo | $212,000 | $131 | 60 |
| 4504 Cedar Ridge Trl | 0.56mi | 3/2.0 | 1,591 (-6%) | 5mo | $230,000 | $145 | 60 |
| 4803 Wyndam Dr | 0.67mi | 3/2.5 | 1,682 (-1%) | 8mo | $279,900 | $166 | 60 |
| 4827 Wyndam Dr | 0.68mi | 3/2.5 | 1,682 (-1%) | 9mo | $187,000 | $111 | 58 |
| 4601 Wendover Dr | 0.60mi | 3/2.0 | 1,548 (-8%) | 0mo | $265,000 | $171 | 58 |
| 4706 Bexley Dr | 0.68mi | 3/2.0 | 1,592 (-6%) | 1mo | $220,000 | $138 | 57 |
| 4873 Fenbrook Dr | 0.70mi | 3/2.0 | 1,589 (-6%) | 3mo | $250,000 | $157 | 55 |
| 4766 White Oak Path | 0.39mi | 3/2.0 | 1,450 (-14%) | 8mo | $206,000 | $142 | 51 |
| 4812 White Oak Path | 0.48mi | 3/2.0 | 1,460 (-14%) | 6mo | $224,000 | $153 | 49 |
Match score weights: distance 35% · size 25% · config 20% · recency 20%. Top-matched comps best support the ARV.
Projected returns pro-forma
-3.0% appreciation · 3.72% rent growth · sell at horizon
- IRR
- 54.8%
- Equity multiple
- 3.44×
- Total profit
- $51,318
- Equity at exit
- $11,183
- IRR
- 60.2%
- Equity multiple
- 7.21×
- Total profit
- $130,461
- Equity at exit
- $6,485
Cash invested: $21,000 (down + closing). Projections, not guarantees.
Landlord ↔ Tenant lean methodology
- Overall (STATE)
- 90 Strongly Landlord-Friendly
- State Georgia
- 90 Strongly Landlord-Friendly · R+3
- County
- — inherits STATE
- City
- — inherits STATE
ZIP-level market 30088
- Rents YoY
- 3.7%
- Active inventory
- 215
- Price-to-rent
- 3.3×
Monthly cashflow live
- Estimated rent
- $1,890 high interval (Pro) →
- Mortgage (P&I)
- −$393
- Tax est. 1.5%
- −$94 /mo · $1,125/yr
- Insurance
- −$31
- HOA
- −$0
- Vacancy / Maint / Mgmt
- −$397
- Net cashflow
- $974
Break-even live
UW: 25.0% down · 7.5% · 30yr · 1.5% tax · 5.0% vac · 8.0% maint · 8.0% mgmt
Financing live
Cash to close
- Down payment
- $18,750
- Closing costs
- $2,250
- Reserves months
- —
- Total cash needed
- —
Loan-product check · same deal, 3 products live
Conventional
25% down · 7.5% · 30yr
- Down + closing
- —
- Monthly P&I
- —
- Monthly cashflow
- —
- DSCR
- —
- Eligible?
- —
Personal DTI + credit; lowest rate.
DSCR
20% down · 8.5% · 30yr
- Down + closing
- —
- Monthly P&I
- —
- Monthly cashflow
- —
- DSCR
- —
- Eligible?
- —
No personal income docs; deal must DSCR.
Hard money
10% down · 12.0% · 12mo
- Down + closing
- —
- Monthly P&I
- —
- Monthly cashflow
- —
- DSCR
- —
- Eligible?
- —
Short-term bridge; refi at stabilization.
Rent comps 37 comps
| Address | Beds | Baths | Sqft | Rent | $/sqft | DOM | Units | Dist |
|---|---|---|---|---|---|---|---|---|
| 4701 Lost Colony Ct Stone Mountain, GA | 3.0 | 2.0 | 1120 | $1,565 | $1.40 | 43d | 1 | 0.08mi |
| 1576 Canberra Dr Stone Mountain, GA | 3.0 | 2.0 | 1850 | $1,000 | $0.54 | 3d | 1 | 0.09mi |
| 1576 Canberra Dr Stone Mountain, GA | 3.0 | 2.0 | 1850 | $1,900 | $1.03 | 2d | 1 | 0.09mi |
| 1600 Devon Ct Stone Mountain, GA | 4.0 | 3.0 | 2100 | $2,145 | $1.02 | 24d | 1 | 0.14mi |
| 4852 Lost Colony Ct Stone Mountain, GA | 4.0 | 3.0 | 1694 | $1,775 | $1.05 | 24d | 1 | 0.22mi |
| 4169 Cedar Ridge Trl Stone Mountain, GA | 3.0 | 2.0 | 1591 | $1,870 | $1.18 | 5d | 1 | 0.40mi |
| 4073 Cedar Ridge Trl Stone Mountain, GA | 4.0 | 2.5 | 2100 | $1,761 | $0.84 | 43d | 1 | 0.41mi |
| 1420 S Hairston Rd Stone Mountain, GA | 1.0–2.0 | 1.0–2.5 | 1011 | $1,358 | $1.34 | 19d | 31 | 0.44mi |
| 4939 Clubgreen Smt Stone Mountain, GA | 4.0 | 2.5 | 2156 | $2,139 | $0.99 | 43d | 1 | 0.63mi |
| 1247 Adcox Rd Stone Mountain, GA | 1.0–2.0 | 1.0–2.0 | 919 | $1,259 | $1.37 | 1d | 10 | 0.66mi |
| 1922 Manhattan Pkwy Decatur, GA | 2.0 | 2.5 | 1814 | $2,000 | $1.10 | 5d | 1 | 0.79mi |
| 4935 Millstone Walk Stone Mountain, GA | 3.0 | 2.5 | 1248 | $1,950 | $1.56 | 5d | 1 | 0.85mi |
| 2014 Manhattan Pkwy Decatur, GA | 3.0 | 2.5 | 1620 | $1,956 | $1.21 | 5d | 1 | 0.87mi |
| 4612 Grand Central Pkwy Decatur, GA | 2.0 | 2.5 | 1328 | $2,100 | $1.58 | 24d | 1 | 0.91mi |
| 1338 Mill Lake Cir Stone Mountain, GA | 3.0 | 2.0 | 1844 | $1,900 | $1.03 | 1d | 1 | 0.92mi |
| 1299 To Lani Path Stone Mountain, GA | 3.0 | 2.0 | 1507 | $1,675 | $1.11 | 12d | 1 | 0.92mi |
| 5118 Rocky Gln Stone Mountain, GA | 4.0 | 2.0 | 1932 | $2,100 | $1.09 | 43d | 1 | 0.93mi |
| 1563 Pine Glen Cir Decatur, GA | 3.0 | 2.0 | 1608 | $1,695 | $1.05 | 5d | 1 | 0.93mi |
| 1373 Mill Lake Cir Stone Mountain, GA | 3.0 | 2.0 | 1296 | $1,773 | $1.37 | 24d | 1 | 0.93mi |
| 1859 Broadway St Decatur, GA | 3.0 | 2.5 | 1620 | $2,200 | $1.36 | 3d | 1 | 0.95mi |
| 1401 Mill Lake Cir Stone Mountain, GA | 3.0 | 2.0 | 1320 | $1,675 | $1.27 | 12d | 1 | 0.95mi |
| 1183 Mill Lake Cir Stone Mountain, GA | 3.0 | 2.0 | 1373 | $1,751 | $1.28 | 5d | 1 | 0.97mi |
| 1406 High Meadow Dr Stone Mountain, GA | 3.0 | 2.0 | 1621 | $900 | $0.56 | 21d | 1 | 0.98mi |
| 1406 High Meadow Dr Stone Mountain, GA | 3.0 | 2.0 | 1621 | $1,625 | $1.00 | 12d | 1 | 0.98mi |
| 1228 Mill Lake Cir Stone Mountain, GA | 3.0 | 2.0 | 1344 | $1,645 | $1.22 | 43d | 1 | 1.00mi |
| 1217 To Lani Path Stone Mountain, GA | 3.0 | 2.5 | 1404 | $1,754 | $1.25 | 1d | 1 | 1.01mi |
| 1127 Mainstreet Valley Dr Stone Mountain, GA | 2.0 | 2.0 | 1074 | $1,731 | $1.61 | 21d | 1 | 1.01mi |
| 4336 Glenhaven Dr Decatur, GA | 4.0 | 3.0 | 2100 | $2,500 | $1.19 | 43d | 1 | 1.03mi |
| 1127 Cherokee Hts Stone Mountain, GA | 4.0 | 3.0 | 2184 | $1,831 | $0.84 | 12d | 1 | 1.23mi |
| 1038 S Hairston Rd Stone Mountain, GA | 1.0–3.0 | 1.0–2.0 | 912 | $1,285 | $1.41 | 5d | 1 | 1.24mi |
| 1102 Cherokee Hts Stone Mountain, GA | 4.0 | 2.5 | 1867 | $2,140 | $1.15 | 11d | 1 | 1.24mi |
| 1380 Colony Hill Ct Stone Mountain, GA | 3.0 | 1.5 | 1350 | $1,500 | $1.11 | 10d | 1 | 1.25mi |
| 1380 Colony Hill Ct Stone Mountain, GA | 4.0 | 4.5 | 1350 | $1,690 | $1.25 | 12d | 1 | 1.25mi |
| 1000 Hidden Chase Stone Mountain, GA | 1.0–3.0 | 1.0–2.0 | 1185 | $1,510 | $1.27 | 5d | 1 | 1.29mi |
| 1467 Muirfield Dr Stone Mountain, GA | 3.0 | 2.0 | 1630 | $1,870 | $1.15 | 21d | 1 | 1.36mi |
| 1076 Martin Rd Stone Mountain, GA | 4.0 | 2.0 | 1760 | $2,011 | $1.14 | 16d | 1 | 1.46mi |
| 924 Lake Drive Ter Stone Mountain, GA | 3.0 | 2.0 | 1380 | $1,670 | $1.21 | 43d | 1 | 1.47mi |
Listing history 6 events
-
2026-06-18days on market $75,000 Active 8 DOM
-
2026-06-17days on market $75,000 Active 7 DOM
-
2026-06-16days on market $75,000 Active 6 DOM
-
2026-06-15days on market $75,000 Active 5 DOM
-
2026-06-13remarks 334-char remark
-
2026-06-13$75,000 Active 3 DOM
ⓘ Source: listings_history table (triggers on properties + properties_extension) + one-shot
backfill from property_details.listing_events for pre-trigger history.
Climate risk First Street
- Flood 1/10 Low FEMA zone X (unshaded) · 0% chance over 30 yrs
- Wildfire 1/10 Low
- Heat 5/10 Major 7 d/yr ≥104°F today · 18 d/yr by 30 yrs out
- Wind 5/10 Major 25% chance of damaging wind over 30 yrs
- Air quality 5/10 Major 7 unhealthy d/yr today · 10 by 30 yrs out
Nearby sold comps map
Loading sold comps map…
Walkable amenities ~0.75 mi
Loading nearby amenities…
Taxation est. · year 1
- Rental income
- $22,675
- − Mortgage interest
- −$4,201
- − Property taxes
- −$1,125
- − Insurance
- −$375
- − Repairs & maintenance
- −$1,814
- − Management
- −$1,814
- − Depreciation
- −$2,182
- Taxable income
- $11,164
- Est. tax owed @ 24.0%
- −$2,679
- After-tax cash flow
- $9,014/yr
For passive investors: Depreciation is non-cash, so a rental often shows a tax loss while cash-flowing — sheltering income. Rental losses are passive: they offset passive income freely, and up to $25,000/yr can offset ordinary (W-2) income if you actively participate and your MAGI is under $100k (phasing out to $0 by $150k); unused losses carry forward. On sale, claimed depreciation is recaptured at up to 25%, and gains may owe capital-gains tax (a 1031 exchange can defer both). Figures are a year-1 estimate at your 24.0% rate — not tax advice; consult a CPA.
Schools (NCES district)
- District
- Dekalb County
- NCES district ID
- 1301740
- Math proficiency
- 19% ▼ -12.00%
- Reading proficiency
- 28% ▼ -7.00%
- Median HH income
- $51,448
- Composite
- 20.92/100
- National rank
- #8482
- State rank
- #125 of 174 in GA
Livability — Redan
- Score
- 64/100
- State rank
- #274
- US rank
- #14766
Category grades
Schools grade is shown separately in the Schools card above.
Census & demographics
- Census place
- Redan, GA
- County
- Dekalb County · 782,738 people
- City population
- 29,279
- Metro
- Atlanta-Sandy Springs-Alpharetta, GA
- Population (ZIP)
- 29,240
- Household income
- $70,325
- Rent vs Own
- Severe rent burden
- 1106.0
Population outlook (DeKalb County) Hauer SSP2
- Today (2025)
- 839,977 people
- By 2030
- 891,768 · +6.2%
- By 2040
- 988,894 · +17.7%
- By 2050
- 1,074,583 · +27.9%
- By 2075
- 1,245,026 · +48.2%
- By 2100
- 1,303,135 · +55.1%
Race, ethnicity, and origin ACS 2023
- Neighborhood character
- Predominantly Black (84%)
- Race & ethnicity
- Black 84% White 5% Hispanic / Latino 5% Two or more races 5%
- Common ancestry
- Swedish 1% Russian 1%
- Foreign-born
- 11% · Canada
- Languages at home
- 90% English-only · Spanish 4% French/Haitian/Cajun 1% Other Indo-European 1%
Political lean MEDSL · DeKalb
- 2024 margin
- Solid D (+64.8) · D 81.9% · R 17.1% · Other 1.0%
- 2008→2024 swing
- +6.1pp toward D · 2008: 58.6pp · 2024: 64.8pp
- All cycles
- 2024: D+64.8 2020: D+67.4 2016: D+64.8 2012: D+56.8 2008: D+58.6
Not yet ingested
- Civics
- —
Market trends
- HPI YoY
- ▼ -169.92%
- Current HPI
- 206.5421
- Rent YoY
- ▲ 3.72%
- Metro
- Atlanta-Sandy Springs-Alpharetta, GA
- State GDP YoY
- ▲ 2.66%
- F500 in state
- 28
Industry mix (Fortune 500 HQ in GA)
| Industry | F500 HQs | Revenue |
|---|---|---|
| Paper / Packaging | 2 | $29B |
|
||
| Retail | 1 | $160B |
|
||
| Transportation / Logistics | 1 | $91B |
|
||
| Airlines | 1 | $62B |
|
||
| Consumer Goods | 1 | $47B |
|
||
| Utilities | 1 | $25B |
|
||
Price history
-41.6% since first listed36 events — show timeline
- 2026-06-10 Listed $75,000 FMLS
- 2026-06-10 Listed $75,000 GAMLS
- 2023-05-20 Rental Removed — RENT.
- 2022-02-07 Sold (MLS) $282,000 GAMLS
- 2022-02-07 Sold (MLS) $282,000 FMLS
- 2022-01-22 Pending — FMLS
- 2022-01-16 Contingent — FMLS
- 2022-01-15 Listing Removed — GAMLS
- 2022-01-10 Listed $264,900 GAMLS
- 2022-01-10 Listed $264,900 FMLS
- 2021-04-08 Sold (Public Records) $225,000 Public Records
- 2021-04-06 Listing Removed — GAMLS
- 2021-03-31 Sold (MLS) $225,000 GAMLS
- 2021-03-31 Sold (MLS) $225,000 FMLS
- 2021-03-04 Pending — GAMLS
- 2021-03-04 Pending — FMLS
- 2021-03-02 Relisted — GAMLS
- 2021-03-02 Relisted — FMLS
- 2021-02-12 Pending — GAMLS
- 2021-02-12 Pending — FMLS
- 2021-02-10 Price Changed $215,000 GAMLS
- 2021-02-10 Price Changed $215,000 FMLS
- 2021-02-09 Relisted — GAMLS
- 2021-02-09 Relisted — FMLS
- 2020-11-02 Pending — FMLS
- 2020-11-02 Pending — GAMLS
- 2020-10-30 Listed $189,900 GAMLS
- 2020-10-30 Listed $189,900 FMLS
- 2018-12-24 Sold (Public Records) $118,500 Public Records
- 2018-12-14 Sold (MLS) $118,500 GAMLS
- 2018-12-14 Sold (MLS) $118,500 FMLS
- 2018-11-15 Pending — FMLS
- 2018-11-14 Listing Removed — GAMLS
- 2018-11-14 Listed $140,000 GAMLS
- 2018-11-14 Listed $140,000 FMLS
- 2003-12-19 Sold (Public Records) $128,500 Public Records
Property tax history
+3.4%/yrLatest (2025): $4,770 · -2.7% YoY. Source: county tax records.
Cash-flow waterfall
monthlySold comps — $/sqft
last 12 mo · ≤1 miLoading sold comps…