 Duplex
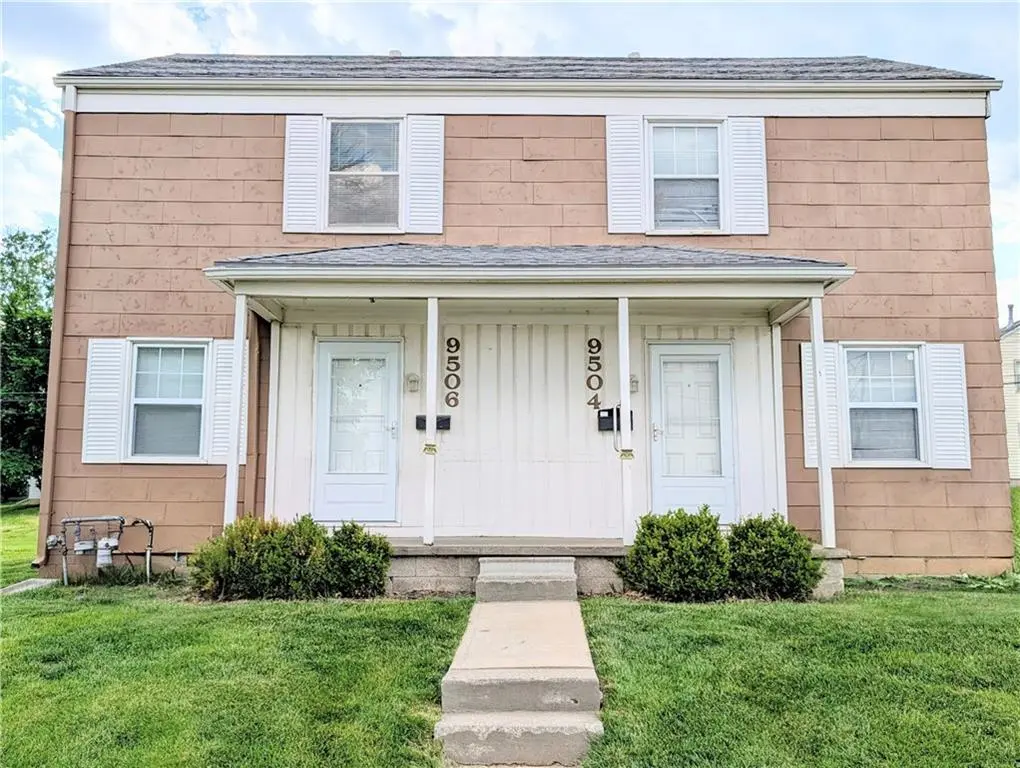
9504 Harrison St · Kansas City, MO
Flood risk 1/10 · Minimal
- FEMA flood zone
- X (unshaded)
- Chance of flooding over 30 yrs
- 0.0%
- Est. flood insurance / yr
- $507 – $1,088
Fire risk 1/10 · Minimal
- Est. fire insurance / yr
- $1,054 – $1,958
Heat risk 4/10 · Minor
- Hot days now (above 107°F)
- 7 days/yr
- Hot days in 30 yrs
- 17 days/yr
Wind risk 2/10 · Minimal
- Chance of severe wind over 30 yrs
- —
Air-quality risk 3/10 · Minor
- Unhealthy air days now
- 2 days/yr
- Unhealthy air days in 30 yrs
- 4 days/yr
Risk factors via First Street. Map © Google.
Why this score? — see what drove the B- grade
The composite is a weighted blend of 9 inputs, each scored 0–100. Each bar is that input's sub-score; the figure is the points it added to the 100-point composite (weight × sub-score).
- Cash flow +30.0/30.0
- DSCR +10.0/10.0
- 1% rule +8.3/10.0
- ARV discount +7.5/15.0
- Livability +3.9/5.0
- Rent growth +3.5/5.0
- Condition / age +2.5/5.0
- Schools +1.8/10.0
- Appreciation +0.0/10.0
$209,900
🖨 Deal sheet (PDF) 📄 Offer letter ✓ Due diligence
Multi-family units
County records classify this as Multi-Family (2-4 Unit). Listing-text estimate: 2 units. confirmed
Listing remarks MLS
This is one of seven identical duplexes in same sub-division. Buildings must sell as a package. Other buildings in same sub-division also available. Excellent income property with excellent cash flow. Priced below appraisals. Instant equity. Owner is motivated. Bring all offers. Each building has two units. Each unit has own address, legal description and tax ID. Ideal for dividing into condos.
Key facts
- Turnkey duplex
- Prime location
- Bus lines access
Tags
Property features AI
Finance
- Financial info: Gross income reported as $19,080; Operating expenses include maintenance, insurance, real estate tax, refuse collection, water/sewer, and supplies
- HOA & community: No association fees
Exterior
- Parking: Assigned parking; Off-street parking; Total of 2 parking spaces
- Security: Smoke detector(s)
- Utilities: Public water; Public sewer; 100 amp electric service; Individual heating and air; Individual water heaters; Separate meters; Cable available
- Home design: Residential income property (duplex); Duplex zoning; Two-story building
- Construction: Frame construction; Composition roof
- Exterior features: Private entrance; Porch
Interior
- Kitchen: Refrigerator; Electric range; Gas range; Stainless steel appliances
- Bedrooms: Two 2-bedroom units; Additional unit type listed as 4+ bedrooms
- Bathrooms: Each 2-bedroom unit has 1 bathroom
- Heating & cooling: Natural gas heating; Electric cooling (has air conditioning)
- Interior features: Window coverings throughout; Apply to all units (features consistent across units)
- Laundry & utility: Laundry located inside units
Neighborhood map
What this means for you Summary
Snapshot
- This is a 2 × 4-bed/1.0-bath units multifamily listed at $210k.
Deal economics
- At list price, monthly cash flow is $934 ($11k/yr) — positive. Per door: $467/mo.
- The deal already cash-flows at list — no discount required.
- Meets the 1% rule at list price ($3k rent vs $210k).
- Recommended offer: $207k (1.5% below list) — sets the bar for market timing.
- Cap rate 11.6% vs local median 3.9% in Kansas City — top-decile yield for the area; either an underpriced asset or a hidden risk that comps aren't pricing in. Stress-test before assuming the spread holds.
Location & tenants
- Location reads 78/100 on livability (#28 in MO, #2,671 nationally) — a middle-class / working-renter tenant base. Strengths: amenities A+, commute A+, cost of living A+; Watch: crime F.
- Center 58 (urban): math 12% / reading 29% proficiency, ranked #301 of 324 in MO (top 93%) — low school quality limits family demand, transient renter base, plan for 1-2y turnover; 63% free/reduced lunch — lower-income household profile, screen leases tightly.
- Zoned schools: Indian Creek Elem. (math 12% / reading 17%, grade F, #993 of 1,115 statewide, top 90%, 274 students, 99% FRL); Center Middle (math 7% / reading 28%, grade F, #350 of 391 statewide, top 90%, 560 students, 66% FRL); Center Sr. High (math 5% / reading 37%, grade F, #468 of 521 statewide, top 90%, 742 students, 62% FRL).
- Market conditions: Rents rising (+4.0%/yr); 133 active listings in the ZIP; 13 comparable units currently listed for rent nearby; rentals at typical pace (median 19d on market — plan ~3-4 weeks tenant-placement turnaround); 4,002 units permitted in Jackson County in 2024 (2,271 in 5+ unit buildings).
- At $2,785/mo this rent would consume 52% of the median local household income ($64k/yr) (locally 1249% of renters already pay >50% of income on rent) — very limited rent-growth headroom before tenants either downsize or default.
Forward outlook
- Local home prices are declining (-3.0%/yr); year-one equity from $1k of loan paydown is wiped out by about $6k of value loss. Plan a longer hold.
- Jackson County population projected at +4% by 2050 — modest demand growth; plan on rents tracking national, not racing it.
- At projected returns (-3.0% appreciation + 4.0% rent growth), your $59k cash investment doubles in ~7 years — after that, you're playing with house money.
Negotiation context
- It's been on market 23 days — a 2% lower offer ($207k) is reasonable based on typical stale-listing flexibility.
- 2 sale attempts since 19y ago with the ask held roughly flat each time — persistent listings suggest the price (not the market) is what's stuck; bring a comps-based counter.
- Current owner paid $49k; list at $210k implies a 331% gain — meaningful room to come down on a strong offer.
Risks & watch-outs
- Watch-outs: built in 1954 — expect roof / HVAC / electrical / plumbing capex.
Questions for the listing agent
- Can we see the unit-by-unit rent roll, current vacancy, and any below-market leases? What's the average tenancy length?
- What capital expenditures (roof, boiler, parking lot, exteriors) have been made in the last 5 years, and what's planned in the next 2?
- Built in 1954 — when were the roof, HVAC, electrical panel, plumbing, and water heater last replaced?
- Is there a deadline driving the sale (1031 exchange, divorce, estate, relocation)? That informs how much negotiation room exists.
- Crime grade is F in this area — have there been break-ins, vandalism, or insurance claims at this property in the last 3 years? What carrier currently insures it and at what premium?
- What's the average days-on-market for RENTAL listings here right now (not sales)? A rising rental-DOM trend means longer vacancies and softer asking-rent achievability than the comps imply.
- What's the recent tenant-quality profile in this submarket — average credit score on applications, eviction rate, late-payment / NSF rate, and stable-employment percentage? A property-management company in the area should have these aggregated.
- How much new apartment / multifamily construction is in the pipeline within 1–3 miles? Heavy new supply (>2% of stock underway) typically softens rents 12–24 months out; light construction supports rent growth.
Investment metrics
- 1% rule
- 1.33% ✓
- Cap rate
- 11.63%
- Cash-on-cash
- 19.07%
- DSCR
- 1.85
- GRM
- 6.3
CMA / ARV
No comps found within radius.
Projected returns pro-forma
-3.0% appreciation · 3.97% rent growth · sell at horizon
- IRR
- 11.9%
- Equity multiple
- 1.48×
- Total profit
- $28,161
- Equity at exit
- $31,297
- IRR
- 21.6%
- Equity multiple
- 2.91×
- Total profit
- $112,335
- Equity at exit
- $18,148
Cash invested: $58,772 (down + closing). Projections, not guarantees.
Landlord ↔ Tenant lean methodology
- Overall (STATE)
- 81 Strongly Landlord-Friendly
- State Missouri
- 81 Strongly Landlord-Friendly · R+10
- County
- — inherits STATE
- City
- — inherits STATE
ZIP-level market 64131
- Rents YoY
- 4.0%
- Active inventory
- 133
- Price-to-rent
- 12.6×
Monthly cashflow live
- Estimated rent
- $2,785 medium interval (Pro) →
- Mortgage (P&I)
- −$1,101
- Tax from tax record
- −$78 /mo · $933/yr
- Insurance
- −$87
- HOA
- −$0
- Vacancy / Maint / Mgmt
- −$585
- Net cashflow
- $934
Break-even live
Sensitivity live
| Price | -10% $1,053 | -5% $994 | +0% $934 | +5% $875 | +10% $815 |
|---|---|---|---|---|---|
| Rent | -10% $714 | -5% $824 | +0% $934 | +5% $1,044 | +10% $1,154 |
| Rate | -1.0pp $1,040 | -0.5pp $988 | base $934 | +0.5pp $880 | +1.0pp $824 |
2-unit breakdown (identical units grouped — click to expand)
| Units | Beds | Baths | Est. rent |
|---|---|---|---|
| 2× units | 4 | 1 | $2,786 |
| #1 | 4 | 1 | $1,393 |
| #2 | 4 | 1 | $1,393 |
| Total (2 units) | $2,785 | ||
UW: 25.0% down · 7.5% · 30yr · 1.5% tax · 5.0% vac · 8.0% maint · 8.0% mgmt
Financing live
Cash to close
- Down payment
- $52,475
- Closing costs
- $6,297
- Reserves months
- —
- Total cash needed
- —
Loan-product check · same deal, 3 products live
Conventional
25% down · 7.5% · 30yr
- Down + closing
- —
- Monthly P&I
- —
- Monthly cashflow
- —
- DSCR
- —
- Eligible?
- —
Personal DTI + credit; lowest rate.
DSCR
20% down · 8.5% · 30yr
- Down + closing
- —
- Monthly P&I
- —
- Monthly cashflow
- —
- DSCR
- —
- Eligible?
- —
No personal income docs; deal must DSCR.
Hard money
10% down · 12.0% · 12mo
- Down + closing
- —
- Monthly P&I
- —
- Monthly cashflow
- —
- DSCR
- —
- Eligible?
- —
Short-term bridge; refi at stabilization.
Rent comps 13 comps
| Address | Beds | Baths | Sqft | Rent | $/sqft | DOM | Units | Dist |
|---|---|---|---|---|---|---|---|---|
| 9534 Charlotte St Kansas City, MO | 2.0 | 1.0 | 828 | $795 | $0.96 | 18d | 1 | 0.06mi |
| 9548 Charlotte St Kansas City, MO | 2.0 | 1.0 | 850 | $1,025 | $1.21 | 22d | 1 | 0.09mi |
| 1520 E 97th St Kansas City, MO | 1.0–3.0 | 1.0–2.0 | 1163 | $1,246 | $1.07 | 4d | 7 | 0.51mi |
| 808 E 100 Ter Kansas City, MO | 1.0 | 1.0 | 576 | $1,020 | $1.77 | 26d | 1 | 0.64mi |
| 808 E 100 Ter Kansas City, MO | 1.0–2.0 | 1.0 | 660 | $1,170 | $1.77 | 46d | 4 | 0.64mi |
| 510 E 101st St Kansas City, MO | 1.0–2.0 | 1.0–2.0 | 918 | $1,290 | $1.41 | 6d | 5 | 0.80mi |
| 201 W 99th Ter Kansas City, MO | 1.0–2.0 | 1.0–2.5 | 1262 | $1,962 | $1.55 | 4d | 52 | 0.97mi |
| 8701 Chestnut Cir Kansas City, MO | 1.0–2.0 | 1.0–2.0 | 925 | $1,115 | $1.21 | 4d | 15 | 1.06mi |
| 114 W 103rd St Kansas City, MO | 1.0–2.0 | 1.0–2.0 | 925 | $1,225 | $1.32 | 6d | 9 | 1.15mi |
| 8704 Wornall Rd Unit B Kansas City, MO | 2.0 | 1.0 | 820 | $995 | $1.21 | 18d | 1 | 1.39mi |
| 439 W 87 Pl Kansas City, MO | 1.0 | 1.0 | 616 | $795 | $1.29 | 18d | 1 | 1.40mi |
| 8700 Wornall Rd Kansas City, MO | 1.0–3.0 | 1.0 | 836 | $995 | $1.19 | 17d | 3 | 1.41mi |
| 421 W 87 Pl Kansas City, MO | 3.0 | 1.0 | 1056 | $1,195 | $1.13 | 18d | 1 | 1.43mi |
Listing history 11 events
-
2026-06-08status $209,900 Pending 23 DOM
-
2026-06-07days on market $209,900 Active Under Contract 23 DOM
-
2026-06-03days on market $209,900 Active Under Contract 19 DOM
-
2026-06-02days on market $209,900 Active Under Contract 18 DOM
-
2026-06-01days on market $209,900 Active Under Contract 17 DOM
-
2026-05-31days on market $209,900 Active Under Contract 16 DOM
-
2026-05-15$209,900 Active
-
2010-06-03soldstatus $48,750
-
2007-07-11soldstatus 397-char remark
Show marketing remark (397 chars)
This is one of seven identical duplexes in same sub-division. Buildings must sell as a package. Other buildings in same sub-division also available. Excellent income property with excellent cash flow. Priced below appraisals. Instant equity. Owner is motivated. Bring all offers. Each building has two units. Each unit has own address, legal description and tax ID. Ideal for dividing into condos.
-
2007-02-22$89,000 397-char remark
Show marketing remark (397 chars)
This is one of seven identical duplexes in same sub-division. Buildings must sell as a package. Other buildings in same sub-division also available. Excellent income property with excellent cash flow. Priced below appraisals. Instant equity. Owner is motivated. Bring all offers. Each building has two units. Each unit has own address, legal description and tax ID. Ideal for dividing into condos.
-
1996-03-18soldstatus
ⓘ Source: listings_history table (triggers on properties + properties_extension) + one-shot
backfill from property_details.listing_events for pre-trigger history.
Tax reassessment forecast MO · Resets to sale price
- Current annual tax
- $933 · $78/mo
- Projected year-2 tax
- $2,036 · $170/mo
- Expected delta
- +$1,103/yr (+$92/mo · 118.3%)
ⓘ Screening estimate from a state-policy table — verify with the county assessor before closing.
Climate risk First Street
- Flood 1/10 Low FEMA zone X (unshaded) · 0% chance over 30 yrs
- Wildfire 1/10 Low
- Heat 4/10 Moderate 7 d/yr ≥107°F today · 17 d/yr by 30 yrs out
- Wind 2/10 Low
- Air quality 3/10 Moderate 2 unhealthy d/yr today · 4 by 30 yrs out
Nearby sold comps map
Loading sold comps map…
Walkable amenities ~0.75 mi
Loading nearby amenities…
Taxation est. · year 1
- Rental income
- $33,420
- − Mortgage interest
- −$11,758
- − Property taxes
- −$933
- − Insurance
- −$1,050
- − Repairs & maintenance
- −$2,674
- − Management
- −$2,674
- − Depreciation
- −$6,106
- Taxable income
- $8,227
- Est. tax owed @ 24.0%
- −$1,974
- After-tax cash flow
- $9,236/yr
For passive investors: Depreciation is non-cash, so a rental often shows a tax loss while cash-flowing — sheltering income. Rental losses are passive: they offset passive income freely, and up to $25,000/yr can offset ordinary (W-2) income if you actively participate and your MAGI is under $100k (phasing out to $0 by $150k); unused losses carry forward. On sale, claimed depreciation is recaptured at up to 25%, and gains may owe capital-gains tax (a 1031 exchange can defer both). Figures are a year-1 estimate at your 24.0% rate — not tax advice; consult a CPA.
Schools (NCES district)
- District
- Center 58
- NCES district ID
- 2908250
- Math proficiency
- 12% ▼ -15.00%
- Reading proficiency
- 29% ▼ -6.00%
- Median HH income
- $43,544
- Composite
- 17.64/100
- National rank
- #9031
- State rank
- #301 of 324 in MO
Livability — Kansas City
- Score
- 78/100
- State rank
- #28
- US rank
- #2671
Category grades
Schools grade is shown separately in the Schools card above.
Census & demographics
- Census place
- Kansas City, MO
- County
- Jackson County · 687,798 people
- City population
- 439,467
- Metro
- Kansas City, MO-KS
- Population (ZIP)
- 21,942
- Household income
- $64,201
- Rent vs Own
- Severe rent burden
- 1249.0
Population outlook (Jackson County) Hauer SSP2
- Today (2025)
- 719,589 people
- By 2030
- 731,456 · +1.6%
- By 2040
- 746,689 · +3.8%
- By 2050
- 749,289 · +4.1%
- By 2075
- 736,227 · +2.3%
- By 2100
- 668,210 · -7.1%
Race, ethnicity, and origin ACS 2023
- Neighborhood character
- Diverse neighborhood (Simpson 0.61)
- Race & ethnicity
- White 48% Black 39% Hispanic / Latino 7% Two or more races 7% Asian 1%
- Hispanic origin (detail)
- Mexican 3%
- Common ancestry
- Italian 5% Slovak 1% Lithuanian 1%
- Foreign-born
- 5% · Canada, Vietnam
- Languages at home
- 93% English-only · Spanish 3% French/Haitian/Cajun 1%
Political lean MEDSL · Jackson
- 2024 margin
- D (+19.3) · D 58.9% · R 39.5% · Other 1.6%
- 2008→2024 swing
- -6.1pp toward R · 2008: 25.4pp · 2024: 19.3pp
- All cycles
- 2024: D+19.3 2020: D+22.0 2016: D+16.6 2012: D+19.0 2008: D+25.4
Not yet ingested
- Civics
- —
Market trends
- HPI YoY
- ▼ -253.25%
- Current HPI
- 340.8202
- Rent YoY
- ▲ 3.97%
- Metro
- Kansas City, MO-KS
- State GDP YoY
- ▲ 1.84%
- F500 in state
- 20
Industry mix (Fortune 500 HQ in MO)
| Industry | F500 HQs | Revenue |
|---|---|---|
| Healthcare | 1 | $163B |
|
||
| Insurance | 1 | $21B |
|
||
| Industrial Technology | 1 | $17B |
|
||
| Retail | 1 | $16B |
|
||
| Industrial Distribution | 1 | $10B |
|
||
| Utilities | 1 | $9B |
|
||
Price history
+135.8% since first listed5 events — show timeline
- 2026-05-15 Listed $209,900 Heartland MLS as Distributed by MLS Grid
- 2010-06-03 Sold (Public Records) $48,750 Public Records
- 2007-07-11 Sold (MLS) — Heartland MLS as Distributed by MLS Grid
- 2007-02-22 Listed $89,000 Heartland MLS as Distributed by MLS Grid
- 1996-03-18 Sold (Public Records) — Public Records
Property tax history
+12.4%/yrLatest (2025): $933 · -11.3% YoY. Source: county tax records.
Cash-flow waterfall
monthlySold comps — $/sqft
last 12 mo · ≤1 miLoading sold comps…